 🔨 Auction
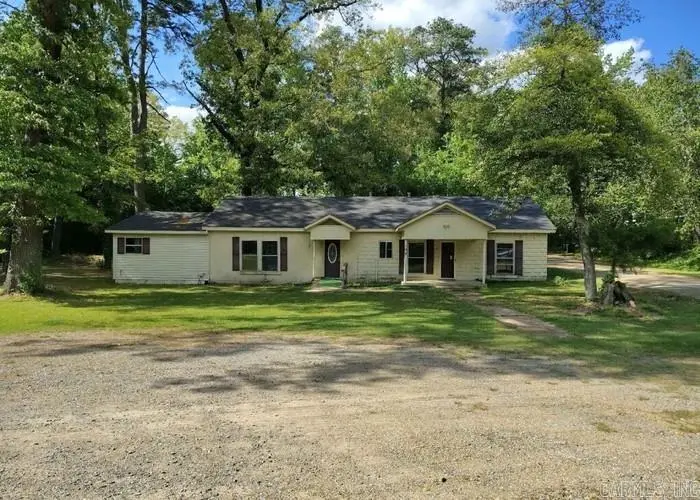
194 Ouachita 54 · Camden, AR
Flood risk 1/10 · Minimal
- FEMA flood zone
- X (unshaded)
- Chance of flooding over 30 yrs
- 0.0%
- Est. flood insurance / yr
- $507 – $1,088
Fire risk 4/10 · Minor
- Est. fire insurance / yr
- $1,499 – $2,785
Heat risk 6/10 · Moderate
- Hot days now (above 111°F)
- 7 days/yr
- Hot days in 30 yrs
- 21 days/yr
Wind risk 6/10 · Moderate
- Chance of severe wind over 30 yrs
- 27.0%
Air-quality risk 1/10 · Minimal
- Unhealthy air days now
- 0 days/yr
- Unhealthy air days in 30 yrs
- 0 days/yr
Risk factors via First Street. Map © Google.
Why this score? — see what drove the F grade
The composite is a weighted blend of 9 inputs, each scored 0–100. Each bar is that input's sub-score; the figure is the points it added to the 100-point composite (weight × sub-score).
- Cash flow +8.1/30.0
- ARV discount +7.5/15.0
- Livability +2.9/5.0
- 1% rule +2.5/10.0
- Rent growth +2.5/5.0
- Condition / age +2.5/5.0
- DSCR +2.1/10.0
- Schools +0.9/10.0
- Appreciation +0.0/10.0
$41,600
🖨 Deal sheet 📄 Offer letter ✓ Due diligence
Listing remarks
Very nice opportunity to buy a home with an upside, on one acre and lots of appeal. 3/2 with basement. Large handicap accessible shower. Will need some repairs. Fixer upper? Check it out! RESERVE AUCTION PROPERTY- Property sold “AS-IS” without contingencies, repairs, warranties, guarantees or representation as to listing accuracy, property information, photo or other depiction included or described herein. Inspect before bidding.
Key facts
- 1 acre lot
- Built 1954
- Listed 52 days
Property features AI
Exterior
- Utilities: Public water; Septic system
- Home design: Single-family property (see remarks for details); Approx. 1,752 total living area (per appraisal); Facing direction not specified
- Construction: Composition roof; Other foundation (see remarks)
- Exterior features: Brick exterior; Paved road access; Lot described as other (see remarks); Approximately 1 acre lot
Interior
- Flooring: Other flooring (see remarks)
- Bathrooms: 2 full bathrooms
- Heating & cooling: Central heat (electric); Central cooling (electric)
- Interior features: Formal living room; Unfinished basement; Other flooring (see remarks); Central cooling (electric); Central heat (electric)
Neighborhood map
What this means for you Summary
Snapshot
- This is a 3-bed/2.0-bath single-family listed at $42k.
Deal economics
- At list price, monthly cash flow is $-177 ($-2k/yr) — negative.
- The deal already cash-flows at list — no discount required.
- Meets the 1% rule at list price ($1k rent vs $42k).
- Recommended offer: $40k (3.0% below list) — sets the bar for market timing.
Location & tenants
- Location reads 57/100 on livability (#364 in AR) — a working-class tenant base; expect higher turnover. Strengths: cost of living A+, housing A+, health & safety A+; Watch: schools F, crime F, amenities F.
- Camden Fairview School District (town): math 9% / reading 15% proficiency, ranked #229 of 238 in AR (top 96%) — low school quality limits family demand, transient renter base, plan for 1-2y turnover; 68% free/reduced lunch — lower-income household profile, screen leases tightly.
- Market conditions: 131 active listings in the ZIP; 18 units permitted in Ouachita County in 2024 (0 in 5+ unit buildings).
Forward outlook
- Local home prices are declining (-3.0%/yr); year-one equity from $1k of loan paydown is wiped out by about $5k of value loss. Plan a longer hold.
- Ouachita County population projected at -33% by 2050 — secular population decline; favor cash flow + early exit over multi-decade hold.
Negotiation context
- It's been on market 53 days — a 3% lower offer ($40k) is reasonable based on typical stale-listing flexibility.
Risks & watch-outs
- Watch-outs: property tax is 6.6% of price; built in 1954 — expect roof / HVAC / electrical / plumbing capex.
- Climate carrying-cost: major wind risk, 27% chance of damaging wind over 30y; extreme-heat days projected 7→21/yr by 2055 (HVAC capex compounding) — expect insurance premiums to compound above CPI over the hold.
Questions for the listing agent
- What do current leases actually rent for vs. the listed asking? Can we see a recent rent roll and the last 12 months of T-12 income?
- It's been on market 53 days. Have you received any prior offers? Is the seller open to a 3% concession, seller financing, or rate buy-down credit?
- Built in 1954 — when were the roof, HVAC, electrical panel, plumbing, and water heater last replaced?
- Property tax is high relative to price — has the assessment been appealed recently, and will the sale trigger a re-assessment?
- Is there a deadline driving the sale (1031 exchange, divorce, estate, relocation)? That informs how much negotiation room exists.
- Schools are F-rated, which usually means shorter tenancies and higher turnover. Who's the typical renter profile here, and what's been the actual vacancy rate?
- Crime grade is F in this area — have there been break-ins, vandalism, or insurance claims at this property in the last 3 years? What carrier currently insures it and at what premium?
- The area grade is low — what's the realistic commute time and amenity access for the typical tenant pool here? Any planned neighborhood developments (good or bad) we should know about?
- What's the average days-on-market for RENTAL listings here right now (not sales)? A rising rental-DOM trend means longer vacancies and softer asking-rent achievability than the comps imply.
- What's the recent tenant-quality profile in this submarket — average credit score on applications, eviction rate, late-payment / NSF rate, and stable-employment percentage? A property-management company in the area should have these aggregated.
- How much new for-sale + rental construction is in the pipeline within 1–3 miles? Heavy new supply typically softens prices + rents 12–24 months out; constrained supply supports both.
Investment metrics
- 1% rule
- 0.75% ✗
- Cap rate
- 5.13%
- Cash-on-cash
- -4.16%
- DSCR
- 0.81
- GRM
- 11.1
CMA / ARV
- ARV (median comp)
- $182,332
- List price
- $41,600
- Delta
- -77.18%
- Verdict
- UNDERPRICED
- Comps
- 4 within 2.0 mi
Projected returns pro-forma
-3.0% appreciation · 3.0% rent growth · sell at horizon
- IRR
- -23.3%
- Equity multiple
- 0.20×
- Total profit
- $-40,810
- Equity at exit
- $27,186
- IRR
- -18.0%
- Equity multiple
- 0.02×
- Total profit
- $-49,983
- Equity at exit
- $15,765
Cash invested: $51,053 (down + closing). Projections, not guarantees.
Landlord ↔ Tenant lean methodology
- Overall (STATE)
- 92 Strongly Landlord-Friendly
- State Arkansas
- 92 Strongly Landlord-Friendly · R+14
- County
- — inherits STATE
- City
- — inherits STATE
ZIP-level market 71701
- Home prices YoY
- -20.5%
- Active inventory
- 131
- Price-to-rent
- 2.5×
Monthly cashflow live
- Estimated rent
- $1,371 medium interval (Pro) →
- Mortgage (P&I)
- −$956
- Tax est. 1.5%
- −$228 /mo · $2,735/yr
- Insurance
- −$76
- HOA
- −$0
- Vacancy / Maint / Mgmt
- −$288
- Net cashflow
- $-177
Break-even live
UW: 25.0% down · 7.5% · 30yr · 1.5% tax · 5.0% vac · 8.0% maint · 8.0% mgmt
Financing live
Cash to close
- Down payment
- $45,583
- Closing costs
- $5,470
- Reserves months
- —
- Total cash needed
- —
Loan-product check · same deal, 3 products live
Conventional
25% down · 7.5% · 30yr
- Down + closing
- —
- Monthly P&I
- —
- Monthly cashflow
- —
- DSCR
- —
- Eligible?
- —
Personal DTI + credit; lowest rate.
DSCR
20% down · 8.5% · 30yr
- Down + closing
- —
- Monthly P&I
- —
- Monthly cashflow
- —
- DSCR
- —
- Eligible?
- —
No personal income docs; deal must DSCR.
Hard money
10% down · 12.0% · 12mo
- Down + closing
- —
- Monthly P&I
- —
- Monthly cashflow
- —
- DSCR
- —
- Eligible?
- —
Short-term bridge; refi at stabilization.
Listing history 14 events
-
2026-06-16days on market $41,600 Active 53 DOM
-
2026-06-15days on market $41,600 Active 52 DOM
-
2026-06-14days on market $41,600 Active 50 DOM
-
2026-06-12statusdays on market $41,600 Active 49 DOM
-
2026-06-09days on market $41,600 Price Change 46 DOM
-
2026-06-08days on market $41,600 Price Change 45 DOM
-
2026-06-07pricestatusdays on market $41,600 Price Change 44 DOM
-
2026-06-05days on market $45,700 Active 42 DOM
-
2026-06-04days on market $45,700 Active 40 DOM
-
2026-06-02days on market $45,700 Active 39 DOM
-
2026-06-01days on market $45,700 Active 38 DOM
-
2026-05-31days on market $45,700 Active 37 DOM
-
2026-05-31days on market $45,700 Active 36 DOM
-
2026-04-24$49,700 New Listing 445-char remark
ⓘ Source: listings_history table (triggers on properties + properties_extension) + one-shot
backfill from property_details.listing_events for pre-trigger history.
Climate risk First Street
- Flood 1/10 Low FEMA zone X (unshaded) · 0% chance over 30 yrs
- Wildfire 4/10 Moderate
- Heat 6/10 Major 7 d/yr ≥111°F today · 21 d/yr by 30 yrs out
- Wind 6/10 Major 27% chance of damaging wind over 30 yrs
- Air quality 1/10 Low 0 unhealthy d/yr today · 0 by 30 yrs out
Nearby sold comps map
Loading sold comps map…
Walkable amenities ~0.75 mi
Loading nearby amenities…
Taxation est. · year 1
- Rental income
- $16,449
- − Mortgage interest
- −$10,213
- − Property taxes
- −$2,735
- − Insurance
- −$912
- − Repairs & maintenance
- −$1,316
- − Management
- −$1,316
- − Depreciation
- −$5,304
- Taxable loss
- −$5,347
- Est. tax savings @ 24.0%
- +$1,283
- After-tax cash flow
- $-843/yr
For passive investors: Depreciation is non-cash, so a rental often shows a tax loss while cash-flowing — sheltering income. Rental losses are passive: they offset passive income freely, and up to $25,000/yr can offset ordinary (W-2) income if you actively participate and your MAGI is under $100k (phasing out to $0 by $150k); unused losses carry forward. On sale, claimed depreciation is recaptured at up to 25%, and gains may owe capital-gains tax (a 1031 exchange can defer both). Figures are a year-1 estimate at your 24.0% rate — not tax advice; consult a CPA.
Schools (NCES district)
- District
- Camden Fairview School District
- NCES district ID
- 0506060
- Math proficiency
- 9% ▼ -16.00%
- Reading proficiency
- 15% ▼ -12.00%
- Median HH income
- $30,854
- Composite
- 9.43/100
- National rank
- #9853
- State rank
- #229 of 238 in AR
Livability — Camden
- Score
- 57/100
- State rank
- #364
- US rank
- #22245
Category grades
Schools grade is shown separately in the Schools card above.
Census & demographics
- City population
- 17,883
- Population (ZIP)
- 17,883
Population outlook (Ouachita County) Hauer SSP2
- Today (2025)
- 21,485 people
- By 2030
- 19,947 · -7.2%
- By 2040
- 16,990 · -20.9%
- By 2050
- 14,431 · -32.8%
- By 2075
- 10,003 · -53.4%
- By 2100
- 7,418 · -65.5%
Race, ethnicity, and origin ACS 2023
- Neighborhood character
- Diverse neighborhood (Simpson 0.56)
- Race & ethnicity
- White 53% Black 39% Hispanic / Latino 5% Two or more races 4%
- Hispanic origin (detail)
- Mexican 4%
- Common ancestry
- Slovak 2% Iranian 1% Lithuanian 1%
- Foreign-born
- 1% · Canada
- Languages at home
- 97% English-only · Spanish 3%
Political lean MEDSL · Ouachita
- 2024 margin
- R (+19.1) · D 39.5% · R 58.6% · Other 1.8%
- 2008→2024 swing
- -8.2pp toward R · 2008: -10.9pp · 2024: -19.1pp
- All cycles
- 2024: R+19.1 2020: R+13.5 2016: R+10.4 2012: R+8.6 2008: R+10.9
Not yet ingested
- Civics
- —
Market trends
- HPI YoY
- ▼ -44.10%
- Current HPI
- 171.0106
- Rent YoY
- —
- Metro
- —
- State GDP YoY
- ▲ 3.80%
- F500 in state
- 10
Industry mix (Fortune 500 HQ in AR)
| Industry | F500 HQs | Revenue |
|---|---|---|
| Retail | 1 | $681B |
|
||
| Food / Agriculture | 1 | $53B |
|
||
| Retail / Energy | 1 | $22B |
|
||
| Transportation / Logistics | 1 | $12B |
|
||
| Energy | 1 | $4B |
|
||
Price history
-16.3% since first listed4 events — show timeline
- 2026-06-16 Listing Removed — CARMLS
- 2026-06-06 Price Changed $41,600 CARMLS
- 2026-05-21 Price Changed $45,700 CARMLS
- 2026-04-24 Listed $49,700 CARMLS
Property tax history
+2.2%/yrLatest (2025): $34 · +0.0% YoY. Source: county tax records.
Cash-flow waterfall
monthlySold comps — $/sqft
last 12 mo · ≤1 miLoading sold comps…