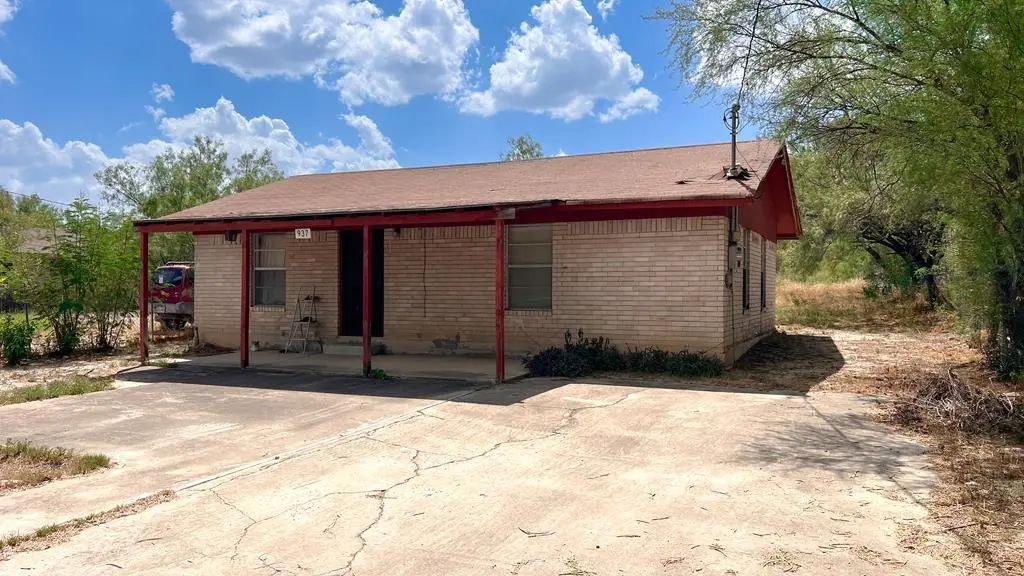
937 Calle Frente · Eidson Road, TX
Flood risk 1/10 · Minimal
- FEMA flood zone
- X (unshaded)
- Chance of flooding over 30 yrs
- 0.0%
- Est. flood insurance / yr
- $507 – $1,088
Fire risk 5/10 · Moderate
- Est. fire insurance / yr
- $1,222 – $2,270
Heat risk 8/10 · Major
- Hot days now (above 111°F)
- 7 days/yr
- Hot days in 30 yrs
- 23 days/yr
Wind risk 6/10 · Moderate
- Chance of severe wind over 30 yrs
- 27.0%
Air-quality risk 1/10 · Minimal
- Unhealthy air days now
- 0 days/yr
- Unhealthy air days in 30 yrs
- 0 days/yr
Risk factors via First Street. Map © Google.
Why this score? — see what drove the D grade
The composite is a weighted blend of 9 inputs, each scored 0–100. Each bar is that input's sub-score; the figure is the points it added to the 100-point composite (weight × sub-score).
- Cash flow +20.0/30.0
- DSCR +6.3/10.0
- 1% rule +4.9/10.0
- Livability +2.8/5.0
- Rent growth +2.5/5.0
- Condition / age +2.5/5.0
- Schools +1.7/10.0
- ARV discount +0.0/15.0
- Appreciation +0.0/10.0
$119,000
🖨 Deal sheet (PDF) 📄 Offer letter ✓ Due diligence
Listing remarks
This 2 bedroom, 1 bathroom home offers 1,040 square feet of living space and is conveniently located just outside the city limits, no city taxes! The property sits on a deep lot, providing plenty of outdoor space and potential for future improvements. A storage shed in the backyard offers additional storage. Your TLC will bring your own special touch to this home, presenting a great opportunity for someone looking for their first home, a renovation, or as an investment. The AC has been recently updated. Schedule a showing today!; Original MLS#: 81598; Age Range: 21-30 Yrs; Appraisal District ID: 12091; Apx Bsmt SqFt: 0; Apx Lot Size SqFt: 12375.00; Dining: Hard Surface; Family Room/Den: Har
Key facts
- Recently updated ac
- Deep lot
- Fenced
Tags
Property features AI
Exterior
- Utilities: City water and sewer
- Home design: Brick exterior
- Construction: Slab foundation; Composition roof
- Exterior features: Covered patio; Storage shed; Paved street access
Interior
- Kitchen: Eat-in kitchen layout
- Bathrooms: One full bathroom
- Heating & cooling: Central heating (electric); Central air conditioning
- Interior features: Ceiling fans; Eat-in kitchen; One living area
Neighborhood map
What this means for you Summary
Snapshot
- This is a 2-bed/1.0-bath single-family listed at $119k.
Deal economics
- At list price, monthly cash flow is $145 ($2k/yr) — positive.
- The deal already cash-flows at list — no discount required.
- To meet the 1% rule (rent ≥ 1% of price), the offer needs to be $118k (0.6% below list).
- Recommended offer: $118k (0.6% below list) — sets the bar for 1% rule.
- Cap rate 7.8% vs local median 4.3% in Eidson Road — top-decile yield for the area; either an underpriced asset or a hidden risk that comps aren't pricing in. Stress-test before assuming the spread holds.
Location & tenants
- Location reads 56/100 on livability (#1,298 in TX) — a working-class tenant base; expect higher turnover. Strengths: cost of living A+, housing A; Watch: health & safety C-, crime F, amenities F.
- Eagle Pass ISD (town): math 15% / reading 28% proficiency, ranked #774 of 826 in TX (top 94%) — low school quality limits family demand, transient renter base, plan for 1-2y turnover.
- Zoned schools: Henry B Gonzalez El (math 4% / reading 9%, grade F, #4,313 of 4,322 statewide, top 100%, 374 students, 99% FRL); Memorial J H (math 12% / reading 27%, grade F, #1,445 of 1,662 statewide, top 88%, 976 students, 90% FRL); C C Winn H S (math 16% / reading 40%, grade F, #1,170 of 1,632 statewide, top 72%, 2,001 students, 86% FRL) — zoned schools average 92% FRL vs 32% district-wide (60 pts higher); higher-poverty schools than district average — tighter screening recommended.
- Market conditions: 462 active listings in the ZIP; 6 comparable units currently listed for rent nearby; rentals lingering (median 46d on market — plan ~5-8 weeks vacancy on turnover, expect pricing pressure); 100% of comp listings sitting > 30 days — soft ceiling on asking rent; 66 units permitted in Maverick County in 2024 (0 in 5+ unit buildings).
Forward outlook
- Local home prices are declining (-3.0%/yr); year-one equity from $823 of loan paydown is wiped out by about $4k of value loss. Plan a longer hold.
- Maverick County population projected at +18% by 2050 — long-run rental-demand tailwind backs the buy-and-hold thesis.
Negotiation context
- Only 12 days on market — expect competitive offers; lowballing is unlikely to land.
Risks & watch-outs
- Climate carrying-cost: major wind risk, 27% chance of damaging wind over 30y; moderate wildfire risk; extreme-heat days projected 7→23/yr by 2055 (HVAC capex compounding) — expect insurance premiums to compound above CPI over the hold.
Questions for the listing agent
- Is there a deadline driving the sale (1031 exchange, divorce, estate, relocation)? That informs how much negotiation room exists.
- Schools are F-rated, which usually means shorter tenancies and higher turnover. Who's the typical renter profile here, and what's been the actual vacancy rate?
- Crime grade is F in this area — have there been break-ins, vandalism, or insurance claims at this property in the last 3 years? What carrier currently insures it and at what premium?
- The area grade is low — what's the realistic commute time and amenity access for the typical tenant pool here? Any planned neighborhood developments (good or bad) we should know about?
- What's the average days-on-market for RENTAL listings here right now (not sales)? A rising rental-DOM trend means longer vacancies and softer asking-rent achievability than the comps imply.
- What's the recent tenant-quality profile in this submarket — average credit score on applications, eviction rate, late-payment / NSF rate, and stable-employment percentage? A property-management company in the area should have these aggregated.
- How much new for-sale + rental construction is in the pipeline within 1–3 miles? Heavy new supply typically softens prices + rents 12–24 months out; constrained supply supports both.
Investment metrics
- 1% rule
- 0.99% ✗
- Cap rate
- 7.76%
- Cash-on-cash
- 5.23%
- DSCR
- 1.23
- GRM
- 8.4
CMA / ARV
- ARV (median comp)
- $95,578
- List price
- $119,000
- Delta
- 24.51%
- Verdict
- OVERPRICED
- Comps
- 2 within 2.0 mi
Show comp detail 7 sales within ~0.75 mi
| Address | Dist | Beds/Ba | Sqft | Sold | Price | $/sf | Match |
|---|---|---|---|---|---|---|---|
| 1715 Eidson Rd | 0.46mi | 2/2.0 | 1,073 (+3%) | 3mo | $139,000 | $130 | 67 |
| 1617 Avenida Encuentro | 0.40mi | 2/2.0 | 965 (-7%) | 2mo | $185,000 | $192 | 64 |
| 996 Calle Progreso Unit N/A | 0.21mi | 3/2.0 (+1) | 1,118 (+8%) | 8mo | $199,000 | $178 | 62 |
| 472 Hacienditas | 0.53mi | 3/2.0 (+1) | 1,040 (0%) | 7mo | $169,500 | $163 | 60 |
| 317 Balcones Blvd Unit N/A | 0.36mi | 3/2.0 (+1) | 1,173 (+13%) | 3mo | $195,000 | $166 | 50 |
| 317 Balcones Blvd | 0.36mi | 3/2.0 (+1) | 1,173 (+13%) | 10mo | $124,000 | $106 | 44 |
| 406 Zaragoza | 0.42mi | 3/2.0 (+1) | 1,145 (+10%) | 14mo | $214,900 | $188 | 42 |
Match score weights: distance 35% · size 25% · config 20% · recency 20%. Top-matched comps best support the ARV.
Projected returns pro-forma
-3.0% appreciation · 3.0% rent growth · sell at horizon
- IRR
- -8.2%
- Equity multiple
- 0.70×
- Total profit
- $-10,044
- Equity at exit
- $17,743
- IRR
- 1.3%
- Equity multiple
- 1.09×
- Total profit
- $3,144
- Equity at exit
- $10,289
Cash invested: $33,320 (down + closing). Projections, not guarantees.
Landlord ↔ Tenant lean methodology
- Overall (STATE)
- 87 Strongly Landlord-Friendly
- State Texas
- 87 Strongly Landlord-Friendly · R+5
- County
- — inherits STATE
- City
- — inherits STATE
ZIP-level market 78852
- Home prices YoY
- -27.5%
- Active inventory
- 462
- Price-to-rent
- 8.4×
Monthly cashflow live
- Estimated rent
- $1,183 high interval (Pro) →
- Mortgage (P&I)
- −$624
- Tax from tax record
- −$116 /mo · $1,388/yr
- Insurance
- −$50
- HOA
- −$0
- Vacancy / Maint / Mgmt
- −$248
- Net cashflow
- $145
Break-even live
Sensitivity live
| Price | -10% $212 | -5% $179 | +0% $145 | +5% $111 | +10% $78 |
|---|---|---|---|---|---|
| Rent | -10% $52 | -5% $98 | +0% $145 | +5% $192 | +10% $239 |
| Rate | -1.0pp $205 | -0.5pp $175 | base $145 | +0.5pp $114 | +1.0pp $83 |
UW: 25.0% down · 7.5% · 30yr · 1.5% tax · 5.0% vac · 8.0% maint · 8.0% mgmt
Financing live
Cash to close
- Down payment
- $29,750
- Closing costs
- $3,570
- Reserves months
- —
- Total cash needed
- —
Loan-product check · same deal, 3 products live
Conventional
25% down · 7.5% · 30yr
- Down + closing
- —
- Monthly P&I
- —
- Monthly cashflow
- —
- DSCR
- —
- Eligible?
- —
Personal DTI + credit; lowest rate.
DSCR
20% down · 8.5% · 30yr
- Down + closing
- —
- Monthly P&I
- —
- Monthly cashflow
- —
- DSCR
- —
- Eligible?
- —
No personal income docs; deal must DSCR.
Hard money
10% down · 12.0% · 12mo
- Down + closing
- —
- Monthly P&I
- —
- Monthly cashflow
- —
- DSCR
- —
- Eligible?
- —
Short-term bridge; refi at stabilization.
Rent comps 6 comps
| Address | Beds | Baths | Sqft | Rent | $/sqft | DOM | Units | Dist |
|---|---|---|---|---|---|---|---|---|
| 1001 Colon Ln Eagle Pass, TX | 3.0 | 2.0 | 1376 | $1,800 | $1.31 | 46d | 1 | 0.40mi |
| 1787 Calle Ginebra Unit 7 Eagle Pass, TX | 2.0 | 1.0 | 850 | $825 | $0.97 | 45d | 1 | 0.40mi |
| 2458 De Leon Dr Unit 1 Eagle Pass, TX | 2.0 | 1.0 | 800 | $950 | $1.19 | 45d | 1 | 0.51mi |
| 416 J R Rodriguez St Unit 7 Eagle Pass, TX | 2.0 | 1.5 | 1032 | $1,100 | $1.07 | 45d | 1 | 0.57mi |
| 1009 Kiriaka Dr Eagle Pass, TX | 3.0 | 2.0 | 1327 | $1,600 | $1.21 | 45d | 1 | 1.18mi |
| 580 S Bibb Ave Eagle Pass, TX | 1.0–2.0 | 1.0 | 760 | $900 | $1.18 | 45d | 57 | 1.39mi |
Listing history 20 events
-
2026-06-21days on market $119,000 Active 12 DOM
-
2026-06-19days on market $119,000 Active 10 DOM
-
2026-06-18days on market $119,000 Active 9 DOM
-
2026-06-17days on market $119,000 Active 8 DOM
-
2026-06-16days on market $119,000 Active 7 DOM
-
2026-06-15days on market $119,000 Active 6 DOM
-
2026-06-14days on market $119,000 Active 4 DOM
-
2026-06-13days on market $119,000 Active 3 DOM
-
2026-06-10remarks 699-char remark
-
2026-06-10days on market $119,000 Active 1 DOM
-
2026-06-09days on market $119,000 Active 285 DOM
-
2026-06-08days on market $119,000 Active 284 DOM
-
2026-06-07days on market $119,000 Active 283 DOM
-
2026-06-05days on market $119,000 Active 280 DOM
-
2026-06-03price $119,000 Active 278 DOM
-
2026-06-02days on market $127,700 Active 278 DOM
-
2026-06-01days on market $127,700 Active 277 DOM
-
2026-05-31days on market $127,700 Active 276 DOM
-
2026-05-30days on market $127,700 Active 275 DOM
-
2025-08-25$127,700 Active 534-char remark
ⓘ Source: listings_history table (triggers on properties + properties_extension) + one-shot
backfill from property_details.listing_events for pre-trigger history.
Tax reassessment forecast TX · Resets to sale price
- Current annual tax
- $1,388 · $116/mo
- Projected year-2 tax
- $2,178 · $181/mo
- Expected delta
- +$789/yr (+$66/mo · 56.9%)
ⓘ Screening estimate from a state-policy table — verify with the county assessor before closing.
Climate risk First Street
- Flood 1/10 Low FEMA zone X (unshaded) · 0% chance over 30 yrs
- Wildfire 5/10 Major
- Heat 8/10 Severe 7 d/yr ≥111°F today · 23 d/yr by 30 yrs out
- Wind 6/10 Major 27% chance of damaging wind over 30 yrs
- Air quality 1/10 Low 0 unhealthy d/yr today · 0 by 30 yrs out
Nearby sold comps map
Loading sold comps map…
Walkable amenities ~0.75 mi
Loading nearby amenities…
Taxation est. · year 1
- Rental income
- $14,194
- − Mortgage interest
- −$6,666
- − Property taxes
- −$1,388
- − Insurance
- −$595
- − Repairs & maintenance
- −$1,135
- − Management
- −$1,135
- − Depreciation
- −$3,462
- Taxable loss
- −$188
- Est. tax savings @ 24.0%
- +$45
- After-tax cash flow
- $1,786/yr
For passive investors: Depreciation is non-cash, so a rental often shows a tax loss while cash-flowing — sheltering income. Rental losses are passive: they offset passive income freely, and up to $25,000/yr can offset ordinary (W-2) income if you actively participate and your MAGI is under $100k (phasing out to $0 by $150k); unused losses carry forward. On sale, claimed depreciation is recaptured at up to 25%, and gains may owe capital-gains tax (a 1031 exchange can defer both). Figures are a year-1 estimate at your 24.0% rate — not tax advice; consult a CPA.
Schools (NCES district)
- District
- Eagle Pass ISD
- NCES district ID
- 4817730
- Math proficiency
- 15% ▼ -41.00%
- Reading proficiency
- 28% ▼ -18.00%
- Median HH income
- $32,967
- Composite
- 17.48/100
- National rank
- #9057
- State rank
- #774 of 826 in TX
Livability — Eidson Road
- Score
- 56/100
- State rank
- #1298
- US rank
- #22544
Category grades
Schools grade is shown separately in the Schools card above.
Census & demographics
- Census place
- Eidson Road, TX
- County
- Maverick County · 57,434 people
- Metro
- Eagle Pass, TX
- Population (ZIP)
- 57,434
- Household income
- $49,954
- Rent vs Own
- Severe rent burden
- 822.0
Population outlook (Maverick County) Hauer SSP2
- Today (2025)
- 62,919 people
- By 2030
- 65,440 · +4.0%
- By 2040
- 70,229 · +11.6%
- By 2050
- 74,218 · +18.0%
- By 2075
- 80,765 · +28.4%
- By 2100
- 76,268 · +21.2%
Race, ethnicity, and origin ACS 2023
- Neighborhood character
- Predominantly Hispanic (95%)
- Race & ethnicity
- Hispanic / Latino 95% Two or more races 53% White 3% Native American 2%
- Hispanic origin (detail)
- Mexican 91% Puerto Rican 1%
- Foreign-born
- 30% · Canada
- Languages at home
- 11% English-only · Spanish 88%
Political lean MEDSL · Maverick
- 2024 margin
- R (+18.5) · D 40.5% · R 59.0%
- 2008→2024 swing
- -75.5pp toward R · 2008: 57.0pp · 2024: -18.5pp
- All cycles
- 2024: R+18.5 2020: D+9.4 2016: D+55.8 2012: D+58.0 2008: D+57.0
Not yet ingested
- Civics
- —
Market trends
- HPI YoY
- ▼ -65.62%
- Current HPI
- 172.9298
- Rent YoY
- —
- Metro
- Eagle Pass, TX
- State GDP YoY
- ▲ 3.95%
- F500 in state
- 110
Industry mix (Fortune 500 HQ in TX)
| Industry | F500 HQs | Revenue |
|---|---|---|
| Energy | 16 | $1,198B |
|
||
| Technology | 5 | $198B |
|
||
| Engineering / Construction | 4 | $72B |
|
||
| Energy Services | 3 | $60B |
|
||
| Utilities | 3 | $41B |
|
||
| Healthcare | 2 | $330B |
|
||
Price history
1 event — show timeline
- 2025-08-25 Listed $119,000 LERA
Property tax history
+4.4%/yrLatest (2025): $1,388 · +5.1% YoY. Source: county tax records.
Cash-flow waterfall
monthlySold comps — $/sqft
last 12 mo · ≤1 miLoading sold comps…