33888 Indian Hills Rd · Stover, MO
Flood risk 1/10 · Minimal
- FEMA flood zone
- X (unshaded)
- Chance of flooding over 30 yrs
- 0.0%
- Est. flood insurance / yr
- $507 – $1,088
Fire risk 4/10 · Minor
- Est. fire insurance / yr
- $1,054 – $1,958
Heat risk 4/10 · Minor
- Hot days now (above 107°F)
- 7 days/yr
- Hot days in 30 yrs
- 19 days/yr
Wind risk 2/10 · Minimal
- Chance of severe wind over 30 yrs
- 0.0%
Air-quality risk 2/10 · Minimal
- Unhealthy air days now
- 0 days/yr
- Unhealthy air days in 30 yrs
- 1 days/yr
Risk factors via First Street. Map © Google.
Why this score? — see what drove the C- grade
The composite is a weighted blend of 9 inputs, each scored 0–100. Each bar is that input's sub-score; the figure is the points it added to the 100-point composite (weight × sub-score).
- Cash flow +16.8/30.0
- Appreciation +8.4/10.0
- ARV discount +7.5/15.0
- DSCR +5.2/10.0
- 1% rule +3.2/10.0
- Schools +3.2/10.0
- Livability +3.0/5.0
- Rent growth +2.5/5.0
- Condition / age +2.5/5.0
$99,000
🖨 Deal sheet 📄 Offer letter ✓ Due diligence
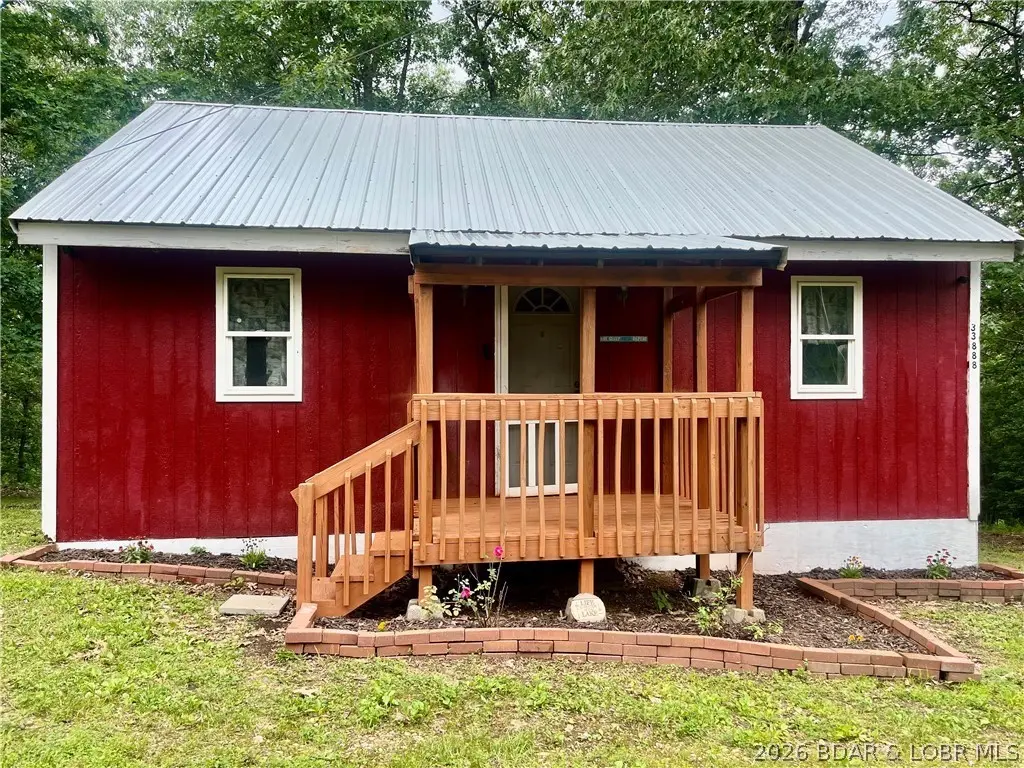
Listing remarks
Lake Life Doesn't Have to Break the Bank! Take a look at this cozy 2-bedroom, 1-bath cabin nestled on 1.25 wooded acres and priced under $100,000! Turn-key and ready for you to start enjoying summer at the lake, this property offers the perfect blend of privacy, relaxation, and outdoor adventure. Enjoy your morning coffee on the covered front porch and unwind in the evenings on the covered back porch surrounded by nature. Located just under 5 miles from conservation access, you'll have quick access to some of the area's best fishing, boating, and outdoor recreation. And for the anglers, you'll love the fish cleaning station already set up right in the backyard—making it easy to clean
Key facts
- Covered front porch
- Conservation access
- Covered back porch
Tags
Property features AI
Exterior
- Parking: Gravel parking; no garage
- Utilities: Public water; Septic tank
- Home design: Single-family detached residence; One level
- Construction: Wood siding
- Exterior features: Wooded lot; Gravel road access
Interior
- Kitchen: Cooktop; Range; Refrigerator; Dishwasher not listed
- Bathrooms: 1 full bathroom
- Heating & cooling: Propane heating with wall furnace; Window air conditioning units
- Interior features: Cooktop, Range, Refrigerator; Washer and Dryer included; No fireplace; Crawl space basement
- Laundry & utility: Washer and Dryer; Dryer
Neighborhood map
What this means for you Summary
Snapshot
- This is a 2-bed/1.0-bath other listed at $99k.
Deal economics
- At list price, monthly cash flow is $63 ($761/yr) — positive.
- The deal already cash-flows at list — no discount required.
- To meet the 1% rule (rent ≥ 1% of price), the offer needs to be $81k (17.7% below list).
- Recommended offer: $81k (17.7% below list) — sets the bar for 1% rule.
Location & tenants
- Location reads 60/100 on livability (#473 in MO) — a middle-class / working-renter tenant base. Strengths: cost of living A+, housing A+, crime B+; Watch: schools D-, amenities F, commute F.
- Morgan County R-I (rural): math 38% / reading 41% proficiency, ranked #173 of 324 in MO (top 53%) — families likely to look elsewhere, expect single-tenant / working-renter base with shorter leases.
- Market conditions: 83 active listings in the ZIP; 14 units permitted in Morgan County in 2024 (0 in 5+ unit buildings).
Forward outlook
- In year one you build about $7k of equity ($684 loan paydown + $7k appreciation (6.9% local appreciation)).
- Morgan County population projected at -22% by 2050 — secular population decline; favor cash flow + early exit over multi-decade hold.
- At projected returns (6.9% appreciation + 3.0% rent growth), your $28k cash investment doubles in ~4 years — after that, you're playing with house money.
- By year 5, paydown + projected appreciation supports a ~$33k cash-out refi (75% LTV) — recoverable capital for the next deal without selling this one.
Negotiation context
- Only 9 days on market — expect competitive offers; lowballing is unlikely to land.
Questions for the listing agent
- Is there a deadline driving the sale (1031 exchange, divorce, estate, relocation)? That informs how much negotiation room exists.
- Schools are D-rated, which usually means shorter tenancies and higher turnover. Who's the typical renter profile here, and what's been the actual vacancy rate?
- What's the average days-on-market for RENTAL listings here right now (not sales)? A rising rental-DOM trend means longer vacancies and softer asking-rent achievability than the comps imply.
- What's the recent tenant-quality profile in this submarket — average credit score on applications, eviction rate, late-payment / NSF rate, and stable-employment percentage? A property-management company in the area should have these aggregated.
- How much new for-sale + rental construction is in the pipeline within 1–3 miles? Heavy new supply typically softens prices + rents 12–24 months out; constrained supply supports both.
Investment metrics
- 1% rule
- 0.82% ✗
- Cap rate
- 7.06%
- Cash-on-cash
- 2.75%
- DSCR
- 1.12
- GRM
- 10.1
CMA / ARV
No comps found within radius.
Projected returns pro-forma
6.88% appreciation · 3.0% rent growth · sell at horizon
- IRR
- 19.6%
- Equity multiple
- 2.36×
- Total profit
- $37,814
- Equity at exit
- $67,810
- IRR
- 18.6%
- Equity multiple
- 4.86×
- Total profit
- $106,864
- Equity at exit
- $128,095
Cash invested: $27,720 (down + closing). Projections, not guarantees.
Landlord ↔ Tenant lean methodology
- Overall (STATE)
- 81 Strongly Landlord-Friendly
- State Missouri
- 81 Strongly Landlord-Friendly · R+10
- County
- — inherits STATE
- City
- — inherits STATE
ZIP-level market 65078
- Home prices YoY
- 4.4%
- Active inventory
- 83
- Price-to-rent
- 10.1×
Monthly cashflow live
- Estimated rent
- $815 medium interval (Pro) →
- Mortgage (P&I)
- −$519
- Tax from tax record
- −$20 /mo · $239/yr
- Insurance
- −$41
- HOA
- −$0
- Vacancy / Maint / Mgmt
- −$171
- Net cashflow
- $63
Break-even live
UW: 25.0% down · 7.5% · 30yr · 1.5% tax · 5.0% vac · 8.0% maint · 8.0% mgmt
Financing live
Cash to close
- Down payment
- $24,750
- Closing costs
- $2,970
- Reserves months
- —
- Total cash needed
- —
Loan-product check · same deal, 3 products live
Conventional
25% down · 7.5% · 30yr
- Down + closing
- —
- Monthly P&I
- —
- Monthly cashflow
- —
- DSCR
- —
- Eligible?
- —
Personal DTI + credit; lowest rate.
DSCR
20% down · 8.5% · 30yr
- Down + closing
- —
- Monthly P&I
- —
- Monthly cashflow
- —
- DSCR
- —
- Eligible?
- —
No personal income docs; deal must DSCR.
Hard money
10% down · 12.0% · 12mo
- Down + closing
- —
- Monthly P&I
- —
- Monthly cashflow
- —
- DSCR
- —
- Eligible?
- —
Short-term bridge; refi at stabilization.
Listing history 7 events
-
2026-06-18days on market $99,000 Active 9 DOM
-
2026-06-17days on market $99,000 Active 8 DOM
-
2026-06-16days on market $99,000 Active 7 DOM
-
2026-06-15days on market $99,000 Active 6 DOM
-
2026-06-13days on market $99,000 Active 4 DOM
-
2026-06-12remarks 693-char remark
-
2026-06-12$99,000 Active 3 DOM
ⓘ Source: listings_history table (triggers on properties + properties_extension) + one-shot
backfill from property_details.listing_events for pre-trigger history.
Tax reassessment forecast MO · Resets to sale price
- Current annual tax
- $239 · $20/mo
- Projected year-2 tax
- $960 · $80/mo
- Expected delta
- +$721/yr (+$60/mo · 301.1%)
ⓘ Screening estimate from a state-policy table — verify with the county assessor before closing.
Climate risk First Street
- Flood 1/10 Low FEMA zone X (unshaded) · 0% chance over 30 yrs
- Wildfire 4/10 Moderate
- Heat 4/10 Moderate 7 d/yr ≥107°F today · 19 d/yr by 30 yrs out
- Wind 2/10 Low 0% chance of damaging wind over 30 yrs
- Air quality 2/10 Low 0 unhealthy d/yr today · 1 by 30 yrs out
Nearby sold comps map
Loading sold comps map…
Walkable amenities ~0.75 mi
Loading nearby amenities…
Taxation est. · year 1
- Rental income
- $9,780
- − Mortgage interest
- −$5,546
- − Property taxes
- −$239
- − Insurance
- −$495
- − Repairs & maintenance
- −$782
- − Management
- −$782
- − Depreciation
- −$2,880
- Taxable loss
- −$945
- Est. tax savings @ 24.0%
- +$227
- After-tax cash flow
- $988/yr
For passive investors: Depreciation is non-cash, so a rental often shows a tax loss while cash-flowing — sheltering income. Rental losses are passive: they offset passive income freely, and up to $25,000/yr can offset ordinary (W-2) income if you actively participate and your MAGI is under $100k (phasing out to $0 by $150k); unused losses carry forward. On sale, claimed depreciation is recaptured at up to 25%, and gains may owe capital-gains tax (a 1031 exchange can defer both). Figures are a year-1 estimate at your 24.0% rate — not tax advice; consult a CPA.
Schools (NCES district)
- District
- Morgan County R-I
- NCES district ID
- 2929610
- Math proficiency
- 38% ▬ 0.00%
- Reading proficiency
- 41% ▼ -1.00%
- Median HH income
- $33,188
- Composite
- 32.47/100
- National rank
- #5714
- State rank
- #173 of 324 in MO
Livability — Stover
- Score
- 60/100
- State rank
- #473
- US rank
- #18738
Category grades
Schools grade is shown separately in the Schools card above.
Census & demographics
- Population (ZIP)
- 3,716
Population outlook (Morgan County) Hauer SSP2
- Today (2025)
- 18,779 people
- By 2030
- 17,891 · -4.7%
- By 2040
- 16,227 · -13.6%
- By 2050
- 14,735 · -21.5%
- By 2075
- 11,433 · -39.1%
- By 2100
- 7,717 · -58.9%
Race, ethnicity, and origin ACS 2023
- Neighborhood character
- Predominantly White (86%)
- Race & ethnicity
- White 86% Two or more races 10% Hispanic / Latino 3%
- Common ancestry
- Lithuanian 3% Romanian 1% Iranian 1%
- Foreign-born
- 2% · Canada, Vietnam
- Languages at home
- 94% English-only · Spanish 3% German/W. Germanic 1% French/Haitian/Cajun 1%
Political lean MEDSL · Morgan
- 2024 margin
- Solid R (+59.7) · D 19.7% · R 79.4%
- 2008→2024 swing
- -39.1pp toward R · 2008: -20.6pp · 2024: -59.7pp
- All cycles
- 2024: R+59.7 2020: R+58.2 2016: R+56.6 2012: R+34.1 2008: R+20.6
Not yet ingested
- Civics
- —
Market trends
- HPI YoY
- ▲ 6.88%
- Current HPI
- 164.4454
- Rent YoY
- —
- Metro
- —
- State GDP YoY
- ▲ 1.84%
- F500 in state
- 20
Industry mix (Fortune 500 HQ in MO)
| Industry | F500 HQs | Revenue |
|---|---|---|
| Healthcare | 1 | $163B |
|
||
| Insurance | 1 | $21B |
|
||
| Industrial Technology | 1 | $17B |
|
||
| Retail | 1 | $16B |
|
||
| Industrial Distribution | 1 | $10B |
|
||
| Utilities | 1 | $9B |
|
||
Price history
2 events — show timeline
- 2026-06-09 Listed $99,000 LOBR
- 2023-09-05 Sold (Public Records) — Public Records
Property tax history
+5.9%/yrLatest (2025): $239 · +8.5% YoY. Source: county tax records.
Cash-flow waterfall
monthlySold comps — $/sqft
last 12 mo · ≤1 miLoading sold comps…