 Duplex
1206 Harlem Blvd · Rockford, IL
Flood risk 7/10 · Major
- FEMA flood zone
- X (unshaded)
- Chance of flooding over 30 yrs
- 0.99%
- Est. flood insurance / yr
- $473 – $860
Fire risk 1/10 · Minimal
- Est. fire insurance / yr
- $804 – $1,492
Heat risk 2/10 · Minimal
- Hot days now (above 102°F)
- 7 days/yr
- Hot days in 30 yrs
- 15 days/yr
Wind risk 2/10 · Minimal
- Chance of severe wind over 30 yrs
- —
Air-quality risk 2/10 · Minimal
- Unhealthy air days now
- 1 days/yr
- Unhealthy air days in 30 yrs
- 2 days/yr
Risk factors via First Street. Map © Google.
Why this score? — see what drove the D+ grade
The composite is a weighted blend of 9 inputs, each scored 0–100. Each bar is that input's sub-score; the figure is the points it added to the 100-point composite (weight × sub-score).
- Cash flow +16.6/30.0
- ARV discount +7.5/15.0
- DSCR +5.1/10.0
- 1% rule +4.7/10.0
- Rent growth +4.5/5.0
- Livability +3.1/5.0
- Condition / age +2.5/5.0
- Schools +1.2/10.0
- Appreciation +0.0/10.0
$240,000
🖨 Deal sheet (PDF) 📄 Offer letter ✓ Due diligence
Multi-family units
County records classify this as Multi-Family (2-4 Unit). Listing-text estimate: 2 units. confirmed
Listing remarks MLS
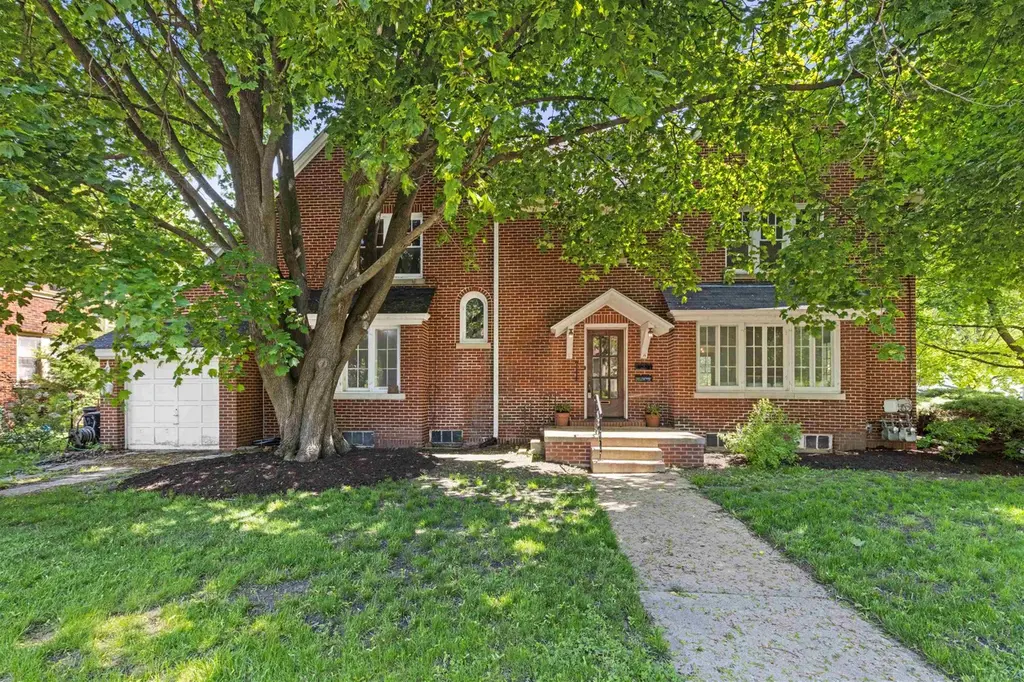
Gorgeous all-brick duplex in historic Churchill Grove neighborhood with over 3,000 sqft! Both units have been freshly painted throughout and hardwood floors have been refinished. The main floor unit has three spacious bedrooms (one room is a pass through), spacious closets, updated bathroom with new subway tile, vanity and toilet. Kitchen has new tile flooring, cabinets have been professionally painted and new hardware added. Adorable breakfast nook with built-in seating and table. Light and bright living room with wood burning fireplace, crown molding and separate dining room. Upstairs unit has all the same amazing features as the lower unit but has two bedrooms and a screened porch. Attached one car garage. Minutes from downtown and Rock River!
Key facts
- New tile flooring
- Built-in seating
- All brick duplex
Tags
Property features AI
Finance
- Financial info: Annual tax amount reported
Exterior
- Parking: 1 parking space
- Home design: Duplex residential income property; 2 stories
- Construction: Brick construction
- Exterior features: Shingle roof
Interior
- Kitchen: Refrigerator
- Interior features: Refrigerator; Gas water heater; Full basement
- Laundry & utility: Gas water heater
Neighborhood map
What this means for you Summary
Snapshot
- This is a 2 × 2-bed/1.0-bath units multifamily listed at $240k.
Deal economics
- At list price, monthly cash flow is $88 ($1k/yr) — positive. Per door: $44/mo.
- The deal already cash-flows at list — no discount required.
- To meet the 1% rule (rent ≥ 1% of price), the offer needs to be $232k (3.2% below list).
- Recommended offer: $232k (3.2% below list) — sets the bar for 1% rule.
Location & tenants
- Location reads 62/100 on livability (#876 in IL) — a middle-class / working-renter tenant base. Strengths: cost of living A+, housing A+, health & safety A+; Watch: crime F, amenities F, commute F.
- Rockford SD 205 (urban): math 12% / reading 16% proficiency, ranked #533 of 620 in IL (top 86%) — low school quality limits family demand, transient renter base, plan for 1-2y turnover; 73% free/reduced lunch — lower-income household profile, screen leases tightly.
- Zoned schools: R K Welsh Elem School (math 7% / reading 7%, grade F, #1,719 of 2,056 statewide, top 84%, 435 students, 0% FRL); West Middle School (math 3% / reading 11%, grade F, #627 of 665 statewide, top 95%, 849 students, 0% FRL); Guilford High School (math 15% / reading 28%, grade F, #345 of 693 statewide, top 50%, 2,071 students, 0% FRL) — zoned schools average 0% FRL vs 73% district-wide (73 pts lower); this property's tenant base skews higher-income than the district average.
- Market conditions: Rents rising fast (+8.1%/yr); 105 active listings in the ZIP; 21 comparable units currently listed for rent nearby; rentals at typical pace (median 23d on market — plan ~3-4 weeks tenant-placement turnaround); 285 units permitted in Winnebago County in 2024 (0 in 5+ unit buildings).
- At $2,324/mo this rent would consume 55% of the median local household income ($51k/yr) (locally 1402% of renters already pay >50% of income on rent) — very limited rent-growth headroom before tenants either downsize or default.
Forward outlook
- Local home prices are declining (-3.0%/yr); year-one equity from $2k of loan paydown is wiped out by about $7k of value loss. Plan a longer hold.
- Winnebago County population projected at -20% by 2050 — secular population decline; favor cash flow + early exit over multi-decade hold.
Negotiation context
- Only 6 days on market — expect competitive offers; lowballing is unlikely to land.
- 7 sale attempts since 5y ago with the ask held roughly flat each time — persistent listings suggest the price (not the market) is what's stuck; bring a comps-based counter.
- Current owner paid $120k; list at $240k implies a 100% gain — meaningful room to come down on a strong offer.
Risks & watch-outs
- Watch-outs: flood insurance adds $56/mo; built in 1922 — expect roof / HVAC / electrical / plumbing capex.
- Climate carrying-cost: major flood risk — expect insurance premiums to compound above CPI over the hold.
Questions for the listing agent
- Can we see the unit-by-unit rent roll, current vacancy, and any below-market leases? What's the average tenancy length?
- What capital expenditures (roof, boiler, parking lot, exteriors) have been made in the last 5 years, and what's planned in the next 2?
- Built in 1922 — when were the roof, HVAC, electrical panel, plumbing, and water heater last replaced?
- What's the actual annual flood-insurance premium (NFIP or private), and is the property in a SFHA with mandatory coverage?
- Is there a deadline driving the sale (1031 exchange, divorce, estate, relocation)? That informs how much negotiation room exists.
- Schools are F-rated, which usually means shorter tenancies and higher turnover. Who's the typical renter profile here, and what's been the actual vacancy rate?
- Crime grade is F in this area — have there been break-ins, vandalism, or insurance claims at this property in the last 3 years? What carrier currently insures it and at what premium?
- The area grade is low — what's the realistic commute time and amenity access for the typical tenant pool here? Any planned neighborhood developments (good or bad) we should know about?
- What's the average days-on-market for RENTAL listings here right now (not sales)? A rising rental-DOM trend means longer vacancies and softer asking-rent achievability than the comps imply.
- What's the recent tenant-quality profile in this submarket — average credit score on applications, eviction rate, late-payment / NSF rate, and stable-employment percentage? A property-management company in the area should have these aggregated.
- How much new apartment / multifamily construction is in the pipeline within 1–3 miles? Heavy new supply (>2% of stock underway) typically softens rents 12–24 months out; light construction supports rent growth.
Investment metrics
- 1% rule
- 0.97% ✗
- Cap rate
- 7.01%
- Cash-on-cash
- 2.56%
- DSCR
- 1.11
- GRM
- 8.6
CMA / ARV
No comps found within radius.
Show comp detail 12 sales within ~0.75 mi
| Address | Dist | Beds/Ba | Sqft | Sold | Price | $/sf | Match |
|---|---|---|---|---|---|---|---|
| 1315 N Court St | 0.29mi | 4/2.0 | — | 1mo | $135,000 | — | 73 |
| 1128 Grant Ave | 0.35mi | 4/2.0 | — | 3mo | $185,000 | — | 69 |
| 1023 N Court St | 0.31mi | 4/2.0 | — | 6mo | $160,000 | — | 68 |
| 1401 N Court St | 0.33mi | 5/2.0 (+1) | — | 3mo | $160,000 | — | 65 |
| 1124 N Main St | 0.18mi | 4/4.0 | — | 10mo | $240,000 | — | 62 |
| 1305 Garrison Ave | 0.53mi | 4/2.0 | — | 3mo | $215,000 | — | 60 |
| 706-708 King St | 0.43mi | 4/2.0 | — | 12mo | $190,000 | — | 57 |
| 1324 Evelyn St | 0.52mi | 4/3.0 | 1,240 | 6mo | $1,320,000 | $1,065 | 54 |
| 635 Garfield Ave | 0.65mi | 4/2.0 | — | 10mo | $171,000 | — | 49 |
| 801 N Winnebago St | 0.71mi | 3/2.0 (-1) | — | 2mo | $91,000 | — | 48 |
| 915-917 N Winnebago St | 0.69mi | 5/2.0 (+1) | — | 5mo | $105,000 | — | 46 |
| 2121 Auburn St | 0.69mi | 4/4.0 | — | 7mo | $270,000 | — | 41 |
Match score weights: distance 35% · size 25% · config 20% · recency 20%. Top-matched comps best support the ARV.
Projected returns pro-forma
-3.0% appreciation · 8.0% rent growth · sell at horizon
- IRR
- -8.0%
- Equity multiple
- 0.69×
- Total profit
- $-20,913
- Equity at exit
- $35,785
- IRR
- 7.2%
- Equity multiple
- 1.67×
- Total profit
- $45,273
- Equity at exit
- $20,751
Cash invested: $67,200 (down + closing). Projections, not guarantees.
Landlord ↔ Tenant lean methodology
- Overall (STATE)
- 43 Moderately Tenant-Leaning
- State Illinois
- 43 Moderately Tenant-Leaning · D+7
- County
- — inherits STATE
- City
- — inherits STATE
ZIP-level market 61103
- Home prices YoY
- -27.3%
- Rents YoY
- 8.1%
- Active inventory
- 105
- Price-to-rent
- 17.2×
Monthly cashflow live
- Estimated rent
- $2,324 high interval (Pro) →
- Mortgage (P&I)
- −$1,259
- Tax from tax record
- −$334 /mo · $4,006/yr
- Insurance
- −$100
- Flood insurance flood zone
- −$56 /mo · $666/yr
- HOA
- −$0
- Vacancy / Maint / Mgmt
- −$488
- Net cashflow
- $88
Break-even live
Sensitivity live
| Price | -10% $224 | -5% $156 | +0% $88 | +5% $20 | +10% $-48 |
|---|---|---|---|---|---|
| Rent | -10% $-96 | -5% $-4 | +0% $88 | +5% $180 | +10% $272 |
| Rate | -1.0pp $209 | -0.5pp $149 | base $88 | +0.5pp $26 | +1.0pp $-37 |
2-unit breakdown (identical units grouped — click to expand)
| Units | Beds | Baths | Est. rent |
|---|---|---|---|
| 2× units | 2 | 1 | $2,324 |
| #1 | 2 | 1 | $1,162 |
| #2 | 2 | 1 | $1,162 |
| Total (2 units) | $2,324 | ||
UW: 25.0% down · 7.5% · 30yr · 1.5% tax · 5.0% vac · 8.0% maint · 8.0% mgmt
Financing live
Cash to close
- Down payment
- $60,000
- Closing costs
- $7,200
- Reserves months
- —
- Total cash needed
- —
Loan-product check · same deal, 3 products live
Conventional
25% down · 7.5% · 30yr
- Down + closing
- —
- Monthly P&I
- —
- Monthly cashflow
- —
- DSCR
- —
- Eligible?
- —
Personal DTI + credit; lowest rate.
DSCR
20% down · 8.5% · 30yr
- Down + closing
- —
- Monthly P&I
- —
- Monthly cashflow
- —
- DSCR
- —
- Eligible?
- —
No personal income docs; deal must DSCR.
Hard money
10% down · 12.0% · 12mo
- Down + closing
- —
- Monthly P&I
- —
- Monthly cashflow
- —
- DSCR
- —
- Eligible?
- —
Short-term bridge; refi at stabilization.
Rent comps 21 comps
| Address | Beds | Baths | Sqft | Rent | $/sqft | DOM | Units | Dist |
|---|---|---|---|---|---|---|---|---|
| 330 King St Rockford, IL | 4.0 | 2.0 | — | $1,700 | — | 45d | 1 | 0.24mi |
| 977 Indian Ter Rockford, IL | 3.0 | 2.5 | — | $3,250 | — | 45d | 1 | 0.35mi |
| 1832 N Main St Rockford, IL | 2.0–3.0 | 1.0–2.0 | 872 | $1,199 | $1.37 | 15d | 1 | 0.55mi |
| 728 N Winnebago St Rockford, IL | 4.0 | 1.0 | 1250 | $1,600 | $1.28 | 15d | 1 | 0.76mi |
| 2208 Fremont St Rockford, IL | 3.0 | 1.0 | 938 | $1,400 | $1.49 | 15d | 1 | 0.84mi |
| 2215 Hecker Ave Unit 2215 Rockford, IL | 3.0 | 1.0 | 800 | $1,095 | $1.37 | 45d | 1 | 0.87mi |
| 2308 Fremont St Rockford, IL | 3.0 | 1.0 | 1320 | $1,600 | $1.21 | 45d | 1 | 0.91mi |
| 718 Locust St Rockford, IL | 3.0 | 1.0 | — | $1,550 | — | 15d | 1 | 0.99mi |
| 512 Market St Unit 512 UPPER Rockford, IL | 3.0 | 1.0 | — | $1,750 | — | 45d | 1 | 1.11mi |
| 620 Paris Ave Rockford, IL | 5.0 | 3.5 | — | $2,200 | — | 23d | 1 | 1.19mi |
| 222 S 2nd St Unit 224 Rockford, IL | 3.0 | 1.0 | — | $1,350 | — | 23d | 1 | 1.31mi |
| 1803 Sauber Ave Rockford, IL | 3.0 | 1.0 | — | $1,400 | — | 23d | 1 | 1.32mi |
| 507 Oak St Unit 2 Rockford, IL | 3.0 | 2.5 | — | $1,250 | — | 23d | 1 | 1.36mi |
| 3007 Huffman Blvd Rockford, IL | 3.0 | 1.5 | 1296 | $1,450 | $1.12 | 45d | 1 | 1.38mi |
| 1823 Overdene Ave Rockford, IL | 3.0 | 1.0 | 875 | $1,400 | $1.60 | 15d | 1 | 1.40mi |
| 1823 Overdene Ave Rockford, IL | 3.0 | 1.0 | 875 | $1,500 | $1.71 | 23d | 1 | 1.40mi |
| 2019 Overdene Ave Rockford, IL | 3.0 | 1.0 | 875 | $1,500 | $1.71 | 45d | 1 | 1.43mi |
| 2019 Overdene Ave Rockford, IL | 3.0 | 1.0 | 875 | $1,400 | $1.60 | 15d | 1 | 1.43mi |
| 1146 Fairview Ave Rockford, IL | 4.0 | 1.5 | 1344 | $1,250 | $0.93 | 23d | 1 | 1.45mi |
| 3133 Liberty Dr Rockford, IL | 3.0 | 1.5 | — | $1,675 | — | 23d | 1 | 1.46mi |
| 4719 Illinois St Loves Park, IL | 3.0 | 1.0 | 1188 | $1,600 | $1.35 | 15d | 1 | 1.48mi |
Listing history 17 events
-
2026-06-03status $240,000 Pending 6 DOM
-
2026-06-02days on market $240,000 Active 6 DOM
-
2026-06-01days on market $240,000 Active 5 DOM
-
2026-05-31days on market $240,000 Active 4 DOM
-
2026-05-30days on market $240,000 Active 3 DOM
-
2026-05-27$240,000 Active
Show marketing remark (756 chars)
Gorgeous all-brick duplex in historic Churchill Grove neighborhood with over 3,000 sqft! Both units have been freshly painted throughout and hardwood floors have been refinished. The main floor unit has three spacious bedrooms (one room is a pass through), spacious closets, updated bathroom with new subway tile, vanity and toilet. Kitchen has new tile flooring, cabinets have been professionally painted and new hardware added. Adorable breakfast nook with built-in seating and table. Light and bright living room with wood burning fireplace, crown molding and separate dining room. Upstairs unit has all the same amazing features as the lower unit but has two bedrooms and a screened porch. Attached one car garage. Minutes from downtown and Rock River!
-
2026-05-27$240,000 Active 756-char remark
Show marketing remark (756 chars)
Gorgeous all-brick duplex in historic Churchill Grove neighborhood with over 3,000 sqft! Both units have been freshly painted throughout and hardwood floors have been refinished. The main floor unit has three spacious bedrooms (one room is a pass through), spacious closets, updated bathroom with new subway tile, vanity and toilet. Kitchen has new tile flooring, cabinets have been professionally painted and new hardware added. Adorable breakfast nook with built-in seating and table. Light and bright living room with wood burning fireplace, crown molding and separate dining room. Upstairs unit has all the same amazing features as the lower unit but has two bedrooms and a screened porch. Attached one car garage. Minutes from downtown and Rock River!
-
2025-05-06historical
-
2025-04-28status Active
-
2025-04-20status Pending
-
2025-04-05Active
-
2024-12-22historical
-
2024-10-05Active
-
2023-07-27historical
-
2023-06-19Active
-
2022-02-04soldstatus $120,000
-
2021-12-16$119,900
ⓘ Source: listings_history table (triggers on properties + properties_extension) + one-shot
backfill from property_details.listing_events for pre-trigger history.
Tax reassessment forecast IL · Partial reset (capped growth)
- Current annual tax
- $4,006 · $334/mo
- Projected year-2 tax
- $4,727 · $394/mo
- Expected delta
- +$721/yr (+$60/mo · 18.0%)
ⓘ Screening estimate from a state-policy table — verify with the county assessor before closing.
Climate risk First Street
- Flood 7/10 Severe FEMA zone X (unshaded) · 99% chance over 30 yrs
- Wildfire 1/10 Low
- Heat 2/10 Low 7 d/yr ≥102°F today · 15 d/yr by 30 yrs out
- Wind 2/10 Low
- Air quality 2/10 Low 1 unhealthy d/yr today · 2 by 30 yrs out
Nearby sold comps map
Loading sold comps map…
Walkable amenities ~0.75 mi
Loading nearby amenities…
Taxation est. · year 1
- Rental income
- $27,888
- − Mortgage interest
- −$13,444
- − Property taxes
- −$4,006
- − Insurance
- −$1,866
- − Repairs & maintenance
- −$2,231
- − Management
- −$2,231
- − Depreciation
- −$6,982
- Taxable loss
- −$2,872
- Est. tax savings @ 24.0%
- +$689
- After-tax cash flow
- $1,745/yr
For passive investors: Depreciation is non-cash, so a rental often shows a tax loss while cash-flowing — sheltering income. Rental losses are passive: they offset passive income freely, and up to $25,000/yr can offset ordinary (W-2) income if you actively participate and your MAGI is under $100k (phasing out to $0 by $150k); unused losses carry forward. On sale, claimed depreciation is recaptured at up to 25%, and gains may owe capital-gains tax (a 1031 exchange can defer both). Figures are a year-1 estimate at your 24.0% rate — not tax advice; consult a CPA.
Schools (NCES district)
- District
- Rockford SD 205
- NCES district ID
- 1734510
- Math proficiency
- 12% ▼ -2.00%
- Reading proficiency
- 16% ▼ -3.00%
- Median HH income
- $42,533
- Composite
- 12.21/100
- National rank
- #9649
- State rank
- #533 of 620 in IL
Livability — Rockford
- Score
- 62/100
- State rank
- #876
- US rank
- #17035
Category grades
Schools grade is shown separately in the Schools card above.
Census & demographics
- Census place
- Rockford, IL
- County
- Winnebago County · 147,297 people
- City population
- 147,297
- Metro
- Rockford, IL
- Population (ZIP)
- 22,869
- Household income
- $51,161
- Rent vs Own
- Severe rent burden
- 1402.0
Population outlook (Winnebago County) Hauer SSP2
- Today (2025)
- 271,080 people
- By 2030
- 260,684 · -3.8%
- By 2040
- 238,405 · -12.1%
- By 2050
- 216,129 · -20.3%
- By 2075
- 172,882 · -36.2%
- By 2100
- 135,336 · -50.1%
Race, ethnicity, and origin ACS 2023
- Neighborhood character
- Diverse neighborhood (Simpson 0.61)
- Race & ethnicity
- White 56% Black 25% Two or more races 13% Hispanic / Latino 12%
- Hispanic origin (detail)
- Mexican 10%
- Common ancestry
- Romanian 3% Portuguese 2% Italian 2%
- Foreign-born
- 7% · Canada
- Languages at home
- 88% English-only · Spanish 9% Russian/Polish/Slavic 1%
Political lean MEDSL · Winnebago
- 2024 margin
- Toss-up / Even · D 49.5% · R 49.0% · Other 1.5%
- 2008→2024 swing
- -12.2pp toward R · 2008: 12.8pp · 2024: 0.6pp
- All cycles
- 2024: D+0.6 2020: D+2.5 2016: R+1.2 2012: D+5.7 2008: D+12.8
Not yet ingested
- Civics
- —
Market trends
- HPI YoY
- ▼ -81.02%
- Current HPI
- 215.8559
- Rent YoY
- ▲ 8.11%
- Metro
- Rockford, IL
- State GDP YoY
- ▲ 1.59%
- F500 in state
- 60
Industry mix (Fortune 500 HQ in IL)
| Industry | F500 HQs | Revenue |
|---|---|---|
| Insurance | 4 | $201B |
|
||
| Consumer Goods | 4 | $87B |
|
||
| Industrial Machinery | 3 | $64B |
|
||
| Healthcare | 2 | $55B |
|
||
| Retail / Pharmacy | 1 | $148B |
|
||
| Agriculture / Food | 1 | $86B |
|
||
Price history
+100.2% since first listed12 events — show timeline
- 2026-05-27 Listed $240,000 NWIAR
- 2026-05-27 Listed $240,000 MRED as Distributed by MLS Grid
- 2025-05-06 Listing Removed — MRED as Distributed by MLS Grid
- 2025-04-28 Relisted — MRED as Distributed by MLS Grid
- 2025-04-20 Pending — MRED as Distributed by MLS Grid
- 2025-04-05 Listed — MRED as Distributed by MLS Grid
- 2024-12-22 Listing Removed — MRED as Distributed by MLS Grid
- 2024-10-05 Listed — MRED as Distributed by MLS Grid
- 2023-07-27 Listing Removed — MRED as Distributed by MLS Grid
- 2023-06-19 Listed — MRED as Distributed by MLS Grid
- 2022-02-04 Sold (MLS) $120,000 NWIAR
- 2021-12-16 Listed $119,900 NWIAR
Property tax history
-1.2%/yrLatest (2024): $4,006 · +3.5% YoY. Source: county tax records.
Cash-flow waterfall
monthlySold comps — $/sqft
last 12 mo · ≤1 miLoading sold comps…