2014 Warren Dr · Austell, GA
Flood risk 1/10 · Minimal
- FEMA flood zone
- X (unshaded)
- Chance of flooding over 30 yrs
- 0.0%
- Est. flood insurance / yr
- $507 – $1,088
Fire risk 2/10 · Minimal
- Est. fire insurance / yr
- $963 – $1,789
Heat risk 5/10 · Moderate
- Hot days now (above 103°F)
- 7 days/yr
- Hot days in 30 yrs
- 17 days/yr
Wind risk 5/10 · Moderate
- Chance of severe wind over 30 yrs
- 25.0%
Air-quality risk 4/10 · Minor
- Unhealthy air days now
- 4 days/yr
- Unhealthy air days in 30 yrs
- 5 days/yr
Risk factors via First Street. Map © Google.
Why this score? — see what drove the B- grade
The composite is a weighted blend of 9 inputs, each scored 0–100. Each bar is that input's sub-score; the figure is the points it added to the 100-point composite (weight × sub-score).
- Cash flow +30.0/30.0
- DSCR +10.0/10.0
- 1% rule +9.8/10.0
- ARV discount +7.5/15.0
- Schools +3.8/10.0
- Livability +3.4/5.0
- Rent growth +2.8/5.0
- Condition / age +2.5/5.0
- Appreciation +0.0/10.0
$130,000
🖨 Deal sheet 📄 Offer letter ✓ Due diligence
Listing remarks MLS
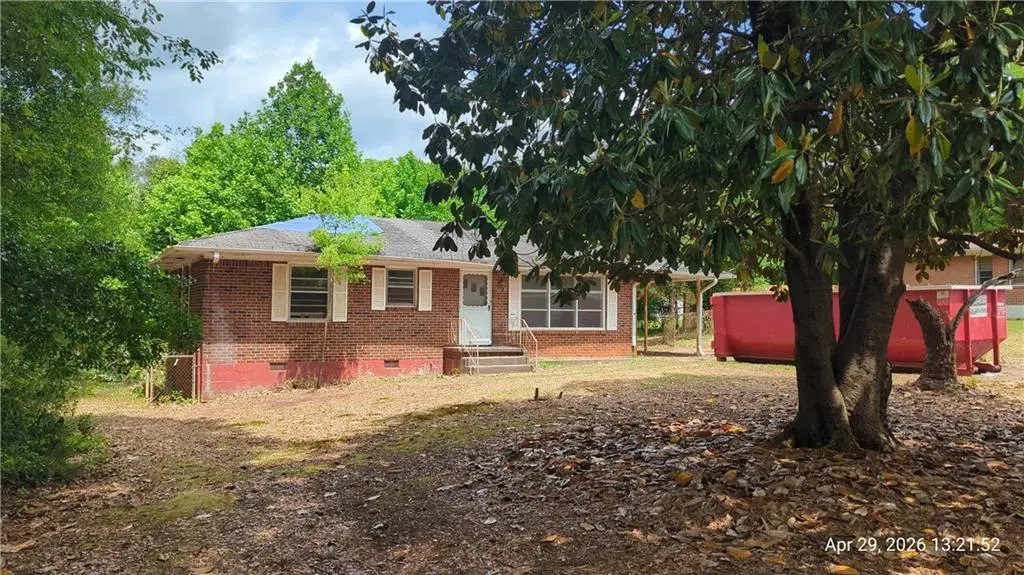
Attention investors! Fixer-upper opportunity in a solid Austell location with no HOA. This property needs significant renovation but offers excellent upside for a flip, rental, or long-term hold. Features a nice wooded backyard and strong value-add potential. Sold as-is. Cash offers preferred. You don’t want to miss this opportunity!
Key facts
- Wooded backyard
- Value-add potential
- Solid location
Tags
Neighborhood map
What this means for you Summary
Snapshot
- This is a 3-bed/1.0-bath single-family listed at $130k.
Deal economics
- At list price, monthly cash flow is $759 ($9k/yr) — positive.
- The deal already cash-flows at list — no discount required.
- Meets the 1% rule at list price ($2k rent vs $130k).
- Cap rate 13.3% vs local median 4.7% in Austell — top-decile yield for the area; either an underpriced asset or a hidden risk that comps aren't pricing in. Stress-test before assuming the spread holds.
Location & tenants
- Location reads 67/100 on livability (#175 in GA) — a middle-class / working-renter tenant base. Strengths: cost of living A+, housing A+; Watch: employment D+, schools D-, amenities F.
- Cobb County (suburban): math 39% / reading 45% proficiency, ranked #25 of 174 in GA (top 14%) — families likely to look elsewhere, expect single-tenant / working-renter base with shorter leases.
- Market conditions: Rents rising (+1.3%/yr); 184 active listings in the ZIP; 15 comparable units currently listed for rent nearby; rentals leasing fast (median 13d on market — plan ~1-2 weeks tenant-placement turnaround); 1,625 units permitted in Cobb County in 2024 (389 in 5+ unit buildings).
- This rent runs 33% of the median local income ($69k/yr) — at the standard rent-burdened threshold; future hikes will face affordability resistance.
Forward outlook
- Local home prices are declining (-3.0%/yr); year-one equity from $899 of loan paydown is wiped out by about $4k of value loss. Plan a longer hold.
- Cobb County population projected at +33% by 2050 — long-run rental-demand tailwind backs the buy-and-hold thesis.
- At projected returns (-3.0% appreciation + 1.3% rent growth), your $36k cash investment doubles in ~6 years — after that, you're playing with house money.
Negotiation context
- Only 3 days on market — expect competitive offers; lowballing is unlikely to land.
Risks & watch-outs
- Watch-outs: built in 1956 — expect roof / HVAC / electrical / plumbing capex.
- Climate carrying-cost: moderate wind risk, 25% chance of damaging wind over 30y; extreme-heat days projected 7→17/yr by 2055 (HVAC capex compounding) — expect insurance premiums to compound above CPI over the hold.
Questions for the listing agent
- Built in 1956 — when were the roof, HVAC, electrical panel, plumbing, and water heater last replaced?
- Is there a deadline driving the sale (1031 exchange, divorce, estate, relocation)? That informs how much negotiation room exists.
- Schools are D-rated, which usually means shorter tenancies and higher turnover. Who's the typical renter profile here, and what's been the actual vacancy rate?
- What's the average days-on-market for RENTAL listings here right now (not sales)? A rising rental-DOM trend means longer vacancies and softer asking-rent achievability than the comps imply.
- What's the recent tenant-quality profile in this submarket — average credit score on applications, eviction rate, late-payment / NSF rate, and stable-employment percentage? A property-management company in the area should have these aggregated.
- How much new for-sale + rental construction is in the pipeline within 1–3 miles? Heavy new supply typically softens prices + rents 12–24 months out; constrained supply supports both.
Investment metrics
- 1% rule
- 1.48% ✓
- Cap rate
- 13.30%
- Cash-on-cash
- 25.04%
- DSCR
- 2.11
- GRM
- 5.6
CMA / ARV
- ARV (median comp)
- $306,421
- List price
- $130,000
- Delta
- -57.57%
- Verdict
- UNDERPRICED
- Comps
- 20 within 1.0 mi
Show comp detail 12 sales within ~0.75 mi
| Address | Dist | Beds/Ba | Sqft | Sold | Price | $/sf | Match |
|---|---|---|---|---|---|---|---|
| 2014 Warren Dr | 0.00mi | 3/1.0 | 1,479 (0%) | 1mo | $120,000 | $81 | 99 |
| 4688 Bennett St | 0.41mi | 3/1.5 | 1,464 (-1%) | 3mo | $259,777 | $177 | 75 |
| 2110 Plum Ln | 0.56mi | 3/2.0 | 1,564 (+6%) | 3mo | $360,000 | $230 | 58 |
| 2232 Warren Dr | 0.57mi | 3/1.5 | 1,358 (-8%) | 2mo | $285,000 | $210 | 56 |
| 2349 Shire Ct | 0.53mi | 3/2.0 | 1,591 (+8%) | 3mo | $299,000 | $188 | 56 |
| 2179 Warren Dr | 0.38mi | 3/1.5 | 1,675 (+13%) | 4mo | $305,000 | $182 | 55 |
| 2276 Clay Rd SW | 0.45mi | 2/2.0 (-1) | 1,350 (-9%) | 4mo | $248,000 | $184 | 52 |
| 2163 Willow Ln | 0.53mi | 3/2.0 | 1,604 (+8%) | 6mo | $349,000 | $218 | 52 |
| 1756 Fairview Cir | 0.64mi | 4/2.5 (+1) | 1,550 (+5%) | 4mo | $215,000 | $139 | 48 |
| 1711 Seayes Rd SW | 0.57mi | 3/2.0 | 1,667 (+13%) | 7mo | $295,000 | $177 | 42 |
| 1650 Seayes Rd SW | 0.66mi | 3/2.0 | 1,590 (+8%) | 12mo | $264,000 | $166 | 42 |
| 1687 Virginia Cir SW | 0.59mi | 3/1.5 | 1,650 (+12%) | 14mo | $305,000 | $185 | 39 |
Match score weights: distance 35% · size 25% · config 20% · recency 20%. Top-matched comps best support the ARV.
Projected returns pro-forma
-3.0% appreciation · 1.3% rent growth · sell at horizon
- IRR
- 16.7%
- Equity multiple
- 1.66×
- Total profit
- $24,012
- Equity at exit
- $19,383
- IRR
- 24.1%
- Equity multiple
- 2.93×
- Total profit
- $70,140
- Equity at exit
- $11,240
Cash invested: $36,400 (down + closing). Projections, not guarantees.
Landlord ↔ Tenant lean methodology
- Overall (STATE)
- 90 Strongly Landlord-Friendly
- State Georgia
- 90 Strongly Landlord-Friendly · R+3
- County
- — inherits STATE
- City
- — inherits STATE
ZIP-level market 30106
- Home prices YoY
- -33.4%
- Rents YoY
- 1.3%
- Active inventory
- 184
- Price-to-rent
- 5.6×
Monthly cashflow live
- Estimated rent
- $1,922 high interval (Pro) →
- Mortgage (P&I)
- −$682
- Tax from tax record
- −$23 /mo · $276/yr
- Insurance
- −$54
- HOA
- −$0
- Vacancy / Maint / Mgmt
- −$404
- Net cashflow
- $759
Break-even live
UW: 25.0% down · 7.5% · 30yr · 1.5% tax · 5.0% vac · 8.0% maint · 8.0% mgmt
Financing live
Cash to close
- Down payment
- $32,500
- Closing costs
- $3,900
- Reserves months
- —
- Total cash needed
- —
Loan-product check · same deal, 3 products live
Conventional
25% down · 7.5% · 30yr
- Down + closing
- —
- Monthly P&I
- —
- Monthly cashflow
- —
- DSCR
- —
- Eligible?
- —
Personal DTI + credit; lowest rate.
DSCR
20% down · 8.5% · 30yr
- Down + closing
- —
- Monthly P&I
- —
- Monthly cashflow
- —
- DSCR
- —
- Eligible?
- —
No personal income docs; deal must DSCR.
Hard money
10% down · 12.0% · 12mo
- Down + closing
- —
- Monthly P&I
- —
- Monthly cashflow
- —
- DSCR
- —
- Eligible?
- —
Short-term bridge; refi at stabilization.
Rent comps 15 comps
| Address | Beds | Baths | Sqft | Rent | $/sqft | DOM | Units | Dist |
|---|---|---|---|---|---|---|---|---|
| 2141 Sandalwood Ln SW Austell, GA | 3.0 | 2.0 | 1475 | $2,136 | $1.45 | 15d | 1 | 0.43mi |
| 4649 Danna Dr Austell, GA | 3.0 | 2.0 | 1438 | $1,765 | $1.23 | 24d | 1 | 0.46mi |
| 1707 Virginia Cir SW Mableton, GA | 3.0 | 2.0 | 1235 | $1,835 | $1.49 | 24d | 1 | 0.51mi |
| 2020 Annette Ln Austell, GA | 3.0 | 2.0 | 1452 | $1,900 | $1.31 | 24d | 1 | 0.69mi |
| 1975 Padgett Dr Unit 1 Austell, GA | 2.0 | 2.5 | 1200 | $1,449 | $1.21 | 21d | 1 | 0.71mi |
| 1917 Annette Ln Austell, GA | 3.0 | 2.0 | 1585 | $1,796 | $1.13 | 12d | 1 | 0.76mi |
| 2051 Lenoa Ln Austell, GA | 2.0 | 2.5 | 1078 | $1,600 | $1.48 | 5d | 1 | 0.77mi |
| 1860 Gherry Dr Austell, GA | 3.0 | 2.0 | 1465 | $1,606 | $1.10 | 5d | 1 | 0.79mi |
| 5128 Lakeview Ct Austell, GA | 2.0 | 1.5 | 1080 | $1,605 | $1.49 | 12d | 1 | 0.79mi |
| 1761 Orange Grove Pl Austell, GA | 3.0 | 2.5 | 1843 | $2,400 | $1.30 | 17d | 1 | 0.92mi |
| 1650 Anderson Mill Rd Austell, GA | 1.0–3.0 | 1.0–2.0 | 1026 | $1,804 | $1.76 | 1d | 22 | 0.99mi |
| 4236 Austell Rd Austell, GA | 1.0–2.0 | 1.0–2.0 | 1050 | $1,623 | $1.55 | 2d | 17 | 1.13mi |
| 2105 Mesa Valley Way Austell, GA | 1.0–3.0 | 1.0–2.0 | 1102 | $2,074 | $1.88 | 1d | 35 | 1.17mi |
| 2735 Dahlonega Trl Austell, GA | 4.0 | 2.0 | 1560 | $1,981 | $1.27 | 20d | 1 | 1.48mi |
| 5575 Burrus Rd Austell, GA | 3.0 | 2.0 | 1301 | $1,500 | $1.15 | 12d | 1 | 1.48mi |
Listing history 3 events
-
2026-05-04status Pending 341-char remark
Show marketing remark (341 chars)
Attention investors! Fixer-upper opportunity in a solid Austell location with no HOA. This property needs significant renovation but offers excellent upside for a flip, rental, or long-term hold. Features a nice wooded backyard and strong value-add potential. Sold as-is. Cash offers preferred. You don’t want to miss this opportunity!
-
2026-05-01$130,000 Active 341-char remark
Show marketing remark (341 chars)
Attention investors! Fixer-upper opportunity in a solid Austell location with no HOA. This property needs significant renovation but offers excellent upside for a flip, rental, or long-term hold. Features a nice wooded backyard and strong value-add potential. Sold as-is. Cash offers preferred. You don’t want to miss this opportunity!
-
2026-04-17soldstatus $70,000
ⓘ Source: listings_history table (triggers on properties + properties_extension) + one-shot
backfill from property_details.listing_events for pre-trigger history.
Tax reassessment forecast GA · Resets to sale price
- Current annual tax
- $276 · $23/mo
- Projected year-2 tax
- $1,196 · $100/mo
- Expected delta
- +$920/yr (+$77/mo · 333.6%)
ⓘ Screening estimate from a state-policy table — verify with the county assessor before closing.
Climate risk First Street
- Flood 1/10 Low FEMA zone X (unshaded) · 0% chance over 30 yrs
- Wildfire 2/10 Low
- Heat 5/10 Major 7 d/yr ≥103°F today · 17 d/yr by 30 yrs out
- Wind 5/10 Major 25% chance of damaging wind over 30 yrs
- Air quality 4/10 Moderate 4 unhealthy d/yr today · 5 by 30 yrs out
Nearby sold comps map
Loading sold comps map…
Walkable amenities ~0.75 mi
Loading nearby amenities…
Taxation est. · year 1
- Rental income
- $23,063
- − Mortgage interest
- −$7,282
- − Property taxes
- −$276
- − Insurance
- −$650
- − Repairs & maintenance
- −$1,845
- − Management
- −$1,845
- − Depreciation
- −$3,782
- Taxable income
- $7,383
- Est. tax owed @ 24.0%
- −$1,772
- After-tax cash flow
- $7,341/yr
For passive investors: Depreciation is non-cash, so a rental often shows a tax loss while cash-flowing — sheltering income. Rental losses are passive: they offset passive income freely, and up to $25,000/yr can offset ordinary (W-2) income if you actively participate and your MAGI is under $100k (phasing out to $0 by $150k); unused losses carry forward. On sale, claimed depreciation is recaptured at up to 25%, and gains may owe capital-gains tax (a 1031 exchange can defer both). Figures are a year-1 estimate at your 24.0% rate — not tax advice; consult a CPA.
Schools (NCES district)
- District
- Cobb County
- NCES district ID
- 1301290
- Math proficiency
- 39% ▼ -15.00%
- Reading proficiency
- 45% ▼ -10.00%
- Median HH income
- $68,845
- Composite
- 37.93/100
- National rank
- #4308
- State rank
- #25 of 174 in GA
Livability — Austell
- Score
- 67/100
- State rank
- #175
- US rank
- #11059
Category grades
Schools grade is shown separately in the Schools card above.
Census & demographics
- County
- Cobb County · 777,758 people
- City population
- 49,719
- Metro
- Atlanta-Sandy Springs-Alpharetta, GA
- Population (ZIP)
- 23,107
- Household income
- $68,881
- Rent vs Own
- Severe rent burden
- 907.0
Population outlook (Cobb County) Hauer SSP2
- Today (2025)
- 868,385 people
- By 2030
- 929,614 · +7.1%
- By 2040
- 1,047,533 · +20.6%
- By 2050
- 1,155,537 · +33.1%
- By 2075
- 1,405,030 · +61.8%
- By 2100
- 1,555,058 · +79.1%
Race, ethnicity, and origin ACS 2023
- Neighborhood character
- Diverse neighborhood (Simpson 0.62)
- Race & ethnicity
- Black 54% White 22% Hispanic / Latino 20% Two or more races 8% Asian 1%
- Hispanic origin (detail)
- Mexican 9% Puerto Rican 6%
- Common ancestry
- Italian 2% Hispanic 1% Romanian 1%
- Foreign-born
- 14% · Canada, Jamaica, Vietnam
- Languages at home
- 79% English-only · Spanish 16% Other Indo-European 1% French/Haitian/Cajun 1%
Political lean MEDSL · Cobb
- 2024 margin
- D (+14.9) · D 56.9% · R 42.0% · Other 1.1%
- 2008→2024 swing
- +24.3pp toward D · 2008: -9.4pp · 2024: 14.9pp
- All cycles
- 2024: D+14.9 2020: D+14.3 2016: D+2.1 2012: R+12.6 2008: R+9.4
Not yet ingested
- Civics
- —
Market trends
- HPI YoY
- ▼ -128.55%
- Current HPI
- 256.6988
- Rent YoY
- ▲ 1.30%
- Metro
- Atlanta-Sandy Springs-Alpharetta, GA
- State GDP YoY
- ▲ 2.66%
- F500 in state
- 28
Industry mix (Fortune 500 HQ in GA)
| Industry | F500 HQs | Revenue |
|---|---|---|
| Paper / Packaging | 2 | $29B |
|
||
| Retail | 1 | $160B |
|
||
| Transportation / Logistics | 1 | $91B |
|
||
| Airlines | 1 | $62B |
|
||
| Consumer Goods | 1 | $47B |
|
||
| Utilities | 1 | $25B |
|
||
Price history
+71.4% since first listed5 events — show timeline
- 2026-05-15 Sold (Public Records) $120,000 Public Records
- 2026-05-15 Sold (MLS) $120,000 FMLS
- 2026-05-04 Pending — FMLS
- 2026-05-01 Listed $130,000 FMLS
- 2026-04-17 Sold (Public Records) $70,000 Public Records
Property tax history
+2.9%/yrLatest (2025): $276 · -0.4% YoY. Source: county tax records.
Cash-flow waterfall
monthlySold comps — $/sqft
last 12 mo · ≤1 miLoading sold comps…