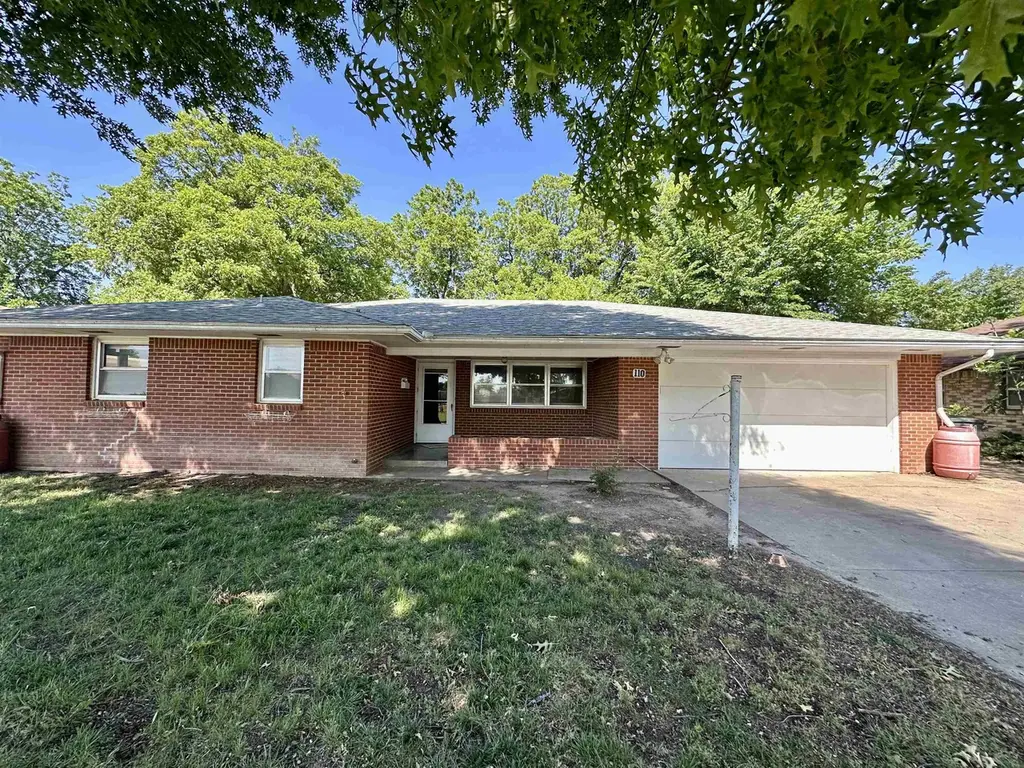
110 S Harding St · Enid, OK
Flood risk 1/10 · Minimal
- FEMA flood zone
- X (unshaded)
- Chance of flooding over 30 yrs
- 0.0%
- Est. flood insurance / yr
- $507 – $1,088
Fire risk 1/10 · Minimal
- Est. fire insurance / yr
- $2,463 – $4,575
Heat risk 5/10 · Moderate
- Hot days now (above 107°F)
- 7 days/yr
- Hot days in 30 yrs
- 19 days/yr
Wind risk 2/10 · Minimal
- Chance of severe wind over 30 yrs
- 2.0%
Air-quality risk 2/10 · Minimal
- Unhealthy air days now
- 0 days/yr
- Unhealthy air days in 30 yrs
- 1 days/yr
Risk factors via First Street. Map © Google.
Why this score? — see what drove the D+ grade
The composite is a weighted blend of 9 inputs, each scored 0–100. Each bar is that input's sub-score; the figure is the points it added to the 100-point composite (weight × sub-score).
- Cash flow +16.6/30.0
- ARV discount +13.3/15.0
- DSCR +5.1/10.0
- 1% rule +3.9/10.0
- Livability +3.2/5.0
- Rent growth +3.1/5.0
- Condition / age +2.5/5.0
- Schools +1.8/10.0
- Appreciation +0.0/10.0
$169,500
🖨 Deal sheet (PDF) 📄 Offer letter ✓ Due diligence
Listing remarks
Wonderful home nestled in the middle of town. Brand new vinyl and carpet was just installed! This home includes a large living room and dining room, making this home perfect for entertaining! The kitchen is open to the dining room giving it a spacious and airy feel. The bedrooms are large and conveniently located near the main bath.
Key facts
- 2 garage spots
- Listed 40 days
Property features AI
Finance
- Other: Subdivision: Hurst
Exterior
- Parking: Attached 2-car garage
- Utilities: Public water; Public sewer
- Home design: Single-family residential; Single-story (above grade finished area listed)
- Construction: Brick veneer construction
- Exterior features: Wood fencing; Composition roof; Brick veneer exterior; Residential zoning
Interior
- Flooring: Concrete
- Bathrooms: 2 full bathrooms
- Heating & cooling: Central heating (Natural Gas); Central air conditioning
- Interior features: Concrete flooring; Central heating and cooling
Neighborhood map
What this means for you Summary
Snapshot
- This is a 3-bed/2.0-bath single-family listed at $170k.
Deal economics
- At list price, monthly cash flow is $102 ($1k/yr) — positive.
- The deal already cash-flows at list — no discount required.
- To meet the 1% rule (rent ≥ 1% of price), the offer needs to be $151k (10.9% below list).
- Recommended offer: $151k (10.9% below list) — sets the bar for 1% rule.
- Cap rate 7.0% vs local median 5.0% in Enid — top-decile yield for the area; either an underpriced asset or a hidden risk that comps aren't pricing in. Stress-test before assuming the spread holds.
Location & tenants
- Location reads 63/100 on livability (#212 in OK) — a middle-class / working-renter tenant base. Strengths: cost of living A+, housing A+; Watch: employment C-, crime F, amenities F.
- Enid (town): math 19% / reading 22% proficiency, ranked #168 of 270 in OK (top 62%) — low school quality limits family demand, transient renter base, plan for 1-2y turnover; 64% free/reduced lunch — lower-income household profile, screen leases tightly.
- Zoned schools: Hoover Es (math 57% / reading 42%, grade D, #42 of 845 statewide, top 5%, 293 students, 0% FRL); Dewitt Waller Ms (math 19% / reading 27%, grade F, #120 of 345 statewide, top 35%, 735 students, 0% FRL); Enid Hs (math 14% / reading 26%, grade F, #236 of 447 statewide, top 61%, 2,252 students, 0% FRL) — zoned schools average 0% FRL vs 64% district-wide (64 pts lower); this property's tenant base skews higher-income than the district average.
- Market conditions: Rents rising (+2.4%/yr); 175 active listings in the ZIP; 19 units permitted in Garfield County in 2024 (0 in 5+ unit buildings).
Forward outlook
- Local home prices are declining (-3.0%/yr); year-one equity from $1k of loan paydown is wiped out by about $5k of value loss. Plan a longer hold.
- Garfield County population projected at +27% by 2050 — long-run rental-demand tailwind backs the buy-and-hold thesis.
Negotiation context
- It's been on market 41 days — a 3% lower offer ($164k) is reasonable based on typical stale-listing flexibility.
- Current owner paid $106k; list at $170k implies a 59% gain — meaningful room to come down on a strong offer.
Risks & watch-outs
- Climate carrying-cost: extreme-heat days projected 7→19/yr by 2055 (HVAC capex compounding) — expect insurance premiums to compound above CPI over the hold.
Questions for the listing agent
- It's been on market 41 days. Have you received any prior offers? Is the seller open to a 11% concession, seller financing, or rate buy-down credit?
- Built in 1962 — when were the roof, HVAC, electrical panel, plumbing, and water heater last replaced?
- Is there a deadline driving the sale (1031 exchange, divorce, estate, relocation)? That informs how much negotiation room exists.
- Schools are D-rated, which usually means shorter tenancies and higher turnover. Who's the typical renter profile here, and what's been the actual vacancy rate?
- Crime grade is F in this area — have there been break-ins, vandalism, or insurance claims at this property in the last 3 years? What carrier currently insures it and at what premium?
- The area grade is low — what's the realistic commute time and amenity access for the typical tenant pool here? Any planned neighborhood developments (good or bad) we should know about?
- What's the average days-on-market for RENTAL listings here right now (not sales)? A rising rental-DOM trend means longer vacancies and softer asking-rent achievability than the comps imply.
- What's the recent tenant-quality profile in this submarket — average credit score on applications, eviction rate, late-payment / NSF rate, and stable-employment percentage? A property-management company in the area should have these aggregated.
- How much new for-sale + rental construction is in the pipeline within 1–3 miles? Heavy new supply typically softens prices + rents 12–24 months out; constrained supply supports both.
Investment metrics
- 1% rule
- 0.89% ✗
- Cap rate
- 7.01%
- Cash-on-cash
- 2.57%
- DSCR
- 1.11
- GRM
- 9.4
CMA / ARV
- ARV (on-the-fly)
- $194,803
- Comps found
- 12
Show comp detail 12 sales within ~0.75 mi
| Address | Dist | Beds/Ba | Sqft | Sold | Price | $/sf | Match |
|---|---|---|---|---|---|---|---|
| 2906 W Broadway Ave | 0.07mi | 3/2.0 | 1,701 (+4%) | 0mo | $192,000 | $113 | 90 |
| 110 S Coolidge St | 0.06mi | 3/2.5 | 1,524 (-7%) | 3mo | $206,000 | $135 | 81 |
| 2314 W Maine St | 0.42mi | 3/2.0 | 1,616 (-1%) | 4mo | $170,000 | $105 | 75 |
| 511 Oakdale Dr | 0.43mi | 3/2.0 | 1,583 (-3%) | 3mo | $210,000 | $133 | 72 |
| 813 Canary Ln | 0.64mi | 3/2.0 | 1,626 (-1%) | 2mo | $199,900 | $123 | 68 |
| 504 Oakdale Dr | 0.43mi | 3/2.0 | 1,487 (-9%) | 3mo | $220,000 | $148 | 62 |
| 708 Canary Ln | 0.58mi | 3/2.0 | 1,548 (-5%) | 2mo | $191,000 | $123 | 62 |
| 3209 W Oklahoma Ave | 0.31mi | 3/2.5 | 1,879 (+15%) | 0mo | $150,000 | $80 | 59 |
| 926 Sunnybrook Ln | 0.70mi | 3/2.0 | 1,712 (+5%) | 4mo | $118,000 | $69 | 56 |
| 3505 Elm Pl | 0.52mi | 3/2.0 | 1,446 (-12%) | 3mo | $172,000 | $119 | 54 |
| 210 S Johnson St | 0.73mi | 3/2.0 | 1,760 (+8%) | 0mo | $149,900 | $85 | 53 |
| 2202 W Maine Ave | 0.53mi | 3/1.0 | 1,464 (-11%) | 3mo | $125,000 | $85 | 52 |
Match score weights: distance 35% · size 25% · config 20% · recency 20%. Top-matched comps best support the ARV.
Projected returns pro-forma
-3.0% appreciation · 2.42% rent growth · sell at horizon
- IRR
- -12.9%
- Equity multiple
- 0.54×
- Total profit
- $-21,899
- Equity at exit
- $25,273
- IRR
- -4.7%
- Equity multiple
- 0.70×
- Total profit
- $-14,400
- Equity at exit
- $14,655
Cash invested: $47,460 (down + closing). Projections, not guarantees.
Landlord ↔ Tenant lean methodology
- Overall (STATE)
- 83 Strongly Landlord-Friendly
- State Oklahoma
- 83 Strongly Landlord-Friendly · R+20
- County
- — inherits STATE
- City
- — inherits STATE
ZIP-level market 73703
- Rents YoY
- 2.4%
- Active inventory
- 175
- Price-to-rent
- 9.4×
Monthly cashflow live
- Estimated rent
- $1,510 medium interval (Pro) →
- Mortgage (P&I)
- −$889
- Tax from tax record
- −$132 /mo · $1,585/yr
- Insurance
- −$71
- HOA
- −$0
- Vacancy / Maint / Mgmt
- −$317
- Net cashflow
- $102
Break-even live
Sensitivity live
| Price | -10% $198 | -5% $150 | +0% $102 | +5% $54 | +10% $6 |
|---|---|---|---|---|---|
| Rent | -10% $-18 | -5% $42 | +0% $102 | +5% $161 | +10% $221 |
| Rate | -1.0pp $187 | -0.5pp $145 | base $102 | +0.5pp $58 | +1.0pp $13 |
UW: 25.0% down · 7.5% · 30yr · 1.5% tax · 5.0% vac · 8.0% maint · 8.0% mgmt
Financing live
Cash to close
- Down payment
- $42,375
- Closing costs
- $5,085
- Reserves months
- —
- Total cash needed
- —
Loan-product check · same deal, 3 products live
Conventional
25% down · 7.5% · 30yr
- Down + closing
- —
- Monthly P&I
- —
- Monthly cashflow
- —
- DSCR
- —
- Eligible?
- —
Personal DTI + credit; lowest rate.
DSCR
20% down · 8.5% · 30yr
- Down + closing
- —
- Monthly P&I
- —
- Monthly cashflow
- —
- DSCR
- —
- Eligible?
- —
No personal income docs; deal must DSCR.
Hard money
10% down · 12.0% · 12mo
- Down + closing
- —
- Monthly P&I
- —
- Monthly cashflow
- —
- DSCR
- —
- Eligible?
- —
Short-term bridge; refi at stabilization.
Listing history 18 events
-
2026-06-22days on market $169,500 Active 41 DOM
-
2026-06-21days on market $169,500 Active 40 DOM
-
2026-06-19days on market $169,500 Active 38 DOM
-
2026-06-18days on market $169,500 Active 37 DOM
-
2026-06-17days on market $169,500 Active 36 DOM
-
2026-06-16days on market $169,500 Active 35 DOM
-
2026-06-15days on market $169,500 Active 34 DOM
-
2026-06-14days on market $169,500 Active 32 DOM
-
2026-06-12days on market $169,500 Active 31 DOM
-
2026-06-09days on market $169,500 Active 28 DOM
-
2026-06-08days on market $169,500 Active 27 DOM
-
2026-06-07days on market $169,500 Active 26 DOM
-
2026-06-02days on market $169,500 Active 21 DOM
-
2026-06-01days on market $169,500 Active 20 DOM
-
2026-05-31days on market $169,500 Active 19 DOM
-
2026-05-30days on market $169,500 Active 18 DOM
-
2026-05-12$169,500 Active
-
2014-01-13soldstatus $106,500
ⓘ Source: listings_history table (triggers on properties + properties_extension) + one-shot
backfill from property_details.listing_events for pre-trigger history.
Tax reassessment forecast OK · Resets to sale price
- Current annual tax
- $1,585 · $132/mo
- Projected year-2 tax
- $1,585 · $132/mo
- Expected delta
- $0/yr ($0/mo · -0.0%)
ⓘ Screening estimate from a state-policy table — verify with the county assessor before closing.
Climate risk First Street
- Flood 1/10 Low FEMA zone X (unshaded) · 0% chance over 30 yrs
- Wildfire 1/10 Low
- Heat 5/10 Major 7 d/yr ≥107°F today · 19 d/yr by 30 yrs out
- Wind 2/10 Low 2% chance of damaging wind over 30 yrs
- Air quality 2/10 Low 0 unhealthy d/yr today · 1 by 30 yrs out
Nearby sold comps map
Loading sold comps map…
Walkable amenities ~0.75 mi
Loading nearby amenities…
Taxation est. · year 1
- Rental income
- $18,124
- − Mortgage interest
- −$9,495
- − Property taxes
- −$1,585
- − Insurance
- −$848
- − Repairs & maintenance
- −$1,450
- − Management
- −$1,450
- − Depreciation
- −$4,931
- Taxable loss
- −$1,634
- Est. tax savings @ 24.0%
- +$392
- After-tax cash flow
- $1,611/yr
For passive investors: Depreciation is non-cash, so a rental often shows a tax loss while cash-flowing — sheltering income. Rental losses are passive: they offset passive income freely, and up to $25,000/yr can offset ordinary (W-2) income if you actively participate and your MAGI is under $100k (phasing out to $0 by $150k); unused losses carry forward. On sale, claimed depreciation is recaptured at up to 25%, and gains may owe capital-gains tax (a 1031 exchange can defer both). Figures are a year-1 estimate at your 24.0% rate — not tax advice; consult a CPA.
Schools (NCES district)
- District
- Enid
- NCES district ID
- 4010920
- Math proficiency
- 19% ▼ -11.00%
- Reading proficiency
- 22% ▼ -9.00%
- Median HH income
- $42,389
- Composite
- 17.59/100
- National rank
- #9040
- State rank
- #168 of 270 in OK
Livability — Enid
- Score
- 63/100
- State rank
- #212
- US rank
- #15472
Category grades
Schools grade is shown separately in the Schools card above.
Census & demographics
- Census place
- Enid, OK
- County
- Garfield County · 55,032 people
- City population
- 55,032
- Metro
- Enid, OK
- Population (ZIP)
- 30,556
- Household income
- $73,333
- Rent vs Own
- Severe rent burden
- 702.0
Population outlook (Garfield County) Hauer SSP2
- Today (2025)
- 69,026 people
- By 2030
- 72,171 · +4.6%
- By 2040
- 79,366 · +15.0%
- By 2050
- 87,847 · +27.3%
- By 2075
- 112,714 · +63.3%
- By 2100
- 135,682 · +96.6%
Race, ethnicity, and origin ACS 2023
- Neighborhood character
- Predominantly White (78%)
- Race & ethnicity
- White 78% Hispanic / Latino 10% Two or more races 9% Black 2% Asian 2% Native American 2%
- Hispanic origin (detail)
- Mexican 8%
- Common ancestry
- Iranian 2% Slovak 2% Serbian 1%
- Foreign-born
- 4% · Canada, China
- Languages at home
- 92% English-only · Spanish 5% Other Asian/Pacific 2% Chinese 1%
Political lean MEDSL · Garfield
- 2024 margin
- Solid R (+53.8) · D 22.2% · R 76.0% · Other 1.8%
- 2008→2024 swing
- -2.8pp toward R · 2008: -51.0pp · 2024: -53.8pp
- All cycles
- 2024: R+53.8 2020: R+53.7 2016: R+53.5 2012: R+52.5 2008: R+51.0
Not yet ingested
- Civics
- —
Market trends
- HPI YoY
- ▼ -111.61%
- Current HPI
- 187.8197
- Rent YoY
- ▲ 2.42%
- Metro
- Enid, OK
- State GDP YoY
- ▲ 1.55%
- F500 in state
- 6
Industry mix (Fortune 500 HQ in OK)
| Industry | F500 HQs | Revenue |
|---|---|---|
| Energy | 3 | $48B |
|
||
Price history
+59.2% since first listed2 events — show timeline
- 2026-05-12 Listed $169,500 NWOAR
- 2014-01-13 Sold (Public Records) $106,500 Public Records
Property tax history
+5.8%/yrLatest (2025): $1,585 · +4.3% YoY. Source: county tax records.
Cash-flow waterfall
monthlySold comps — $/sqft
last 12 mo · ≤1 miLoading sold comps…