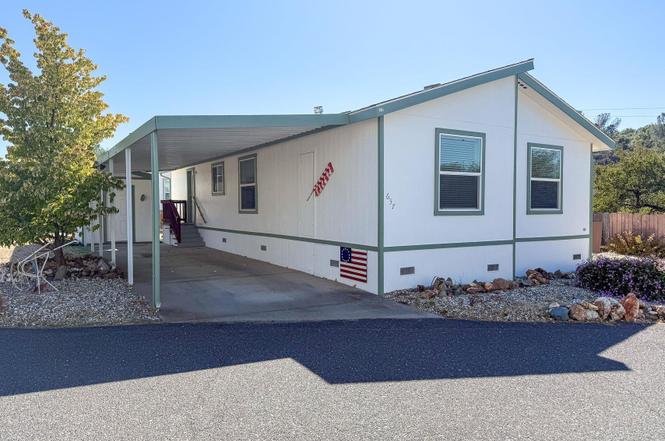
18717 Mill Villa Rd #637 · Jamestown, CA
Flood risk No data
- FEMA flood zone
- —
- Chance of flooding over 30 yrs
- —
- Est. flood insurance / yr
- —
Fire risk No data
- Est. fire insurance / yr
- —
Heat risk No data
- Hot days now (above threshold)
- —
- Hot days in 30 yrs
- —
Wind risk No data
- Chance of severe wind over 30 yrs
- —
Air-quality risk No data
- Unhealthy air days now
- —
- Unhealthy air days in 30 yrs
- —
Risk factors via First Street. Map © Google.
Why this score? — see what drove the C grade
The composite is a weighted blend of 9 inputs, each scored 0–100. Each bar is that input's sub-score; the figure is the points it added to the 100-point composite (weight × sub-score).
- Cash flow +30.0/30.0
- DSCR +10.0/10.0
- 1% rule +8.9/10.0
- Schools +3.3/10.0
- Livability +2.7/5.0
- Rent growth +2.5/5.0
- Condition / age +2.5/5.0
- ARV discount +0.0/15.0
- Appreciation +0.0/10.0
$114,000
🖨 Deal sheet 📄 Offer letter ✓ Due diligence
Listing remarks
Discover easy living in this well-maintained two-bedroom, two-bath manufactured home located in the desirable Mill Villa community in Jamestown. The open floor plan creates a comfortable flow between the living, dining, and kitchen areas, perfect for both everyday living and entertaining. The kitchen features a convenient breakfast bar, providing extra seating and a welcoming spot for casual meals. Large windows bring in natural light and highlight the pleasant views. Step outside to the covered deck, ideal for relaxing with a morning coffee or enjoying the peaceful surroundings year-round. Additional highlights include a covered carport, a storage shed, and low-maintenance grounds that gi
Key facts
- Covered deck
- Open floor plan
- Covered carport
Tags
Property features AI
Finance
- Other: Living area approximately 1,164 square feet
- HOA & community: Pets allowed upon approval; Clubhouse; Senior community
Exterior
- Parking: Carport
- Home design: Manufactured in park (mobile home); Double wide
- Construction: Wood siding
- Exterior features: Covered deck; Corner lot; Community pool
Interior
- Kitchen: Breakfast bar; Laminate counters; Dishwasher; Free-standing range; Refrigerator
- Bedrooms: 2 bedrooms
- Flooring: Vinyl; Carpet
- Bathrooms: 2 full bathrooms; Shower over tub; Tub in primary bathroom
- Heating & cooling: Forced air heating; Central air conditioning
- Interior features: Breakfast bar; Office; Window coverings; Triple-pane windows
- Laundry & utility: Washer; Dryer; Laundry cabinets
Neighborhood map
What this means for you Summary
Snapshot
- This is a 2-bed/2.0-bath manufactured listed at $114k.
Deal economics
- At list price, monthly cash flow is $563 ($7k/yr) — positive.
- The deal already cash-flows at list — no discount required.
- Meets the 1% rule at list price ($2k rent vs $114k).
- Recommended offer: $100k (12.0% below list) — sets the bar for market timing.
- Cap rate 12.2% vs local median 4.5% in Jamestown — top-decile yield for the area; either an underpriced asset or a hidden risk that comps aren't pricing in. Stress-test before assuming the spread holds.
Location & tenants
- Location reads 53/100 on livability (#980 in CA) — a working-class tenant base; expect higher turnover. Strengths: crime B; Watch: housing C-, cost of living D, schools F.
- Sonora Union High (town): math 21% / reading 59% proficiency, ranked #243 of 517 in CA (top 47%) — families likely to look elsewhere, expect single-tenant / working-renter base with shorter leases.
- Market conditions: 75 active listings in the ZIP; 60 units permitted in Tuolumne County in 2024 (0 in 5+ unit buildings).
Forward outlook
- Local home prices are declining (-3.0%/yr); year-one equity from $788 of loan paydown is wiped out by about $3k of value loss. Plan a longer hold.
- Tuolumne County population projected at -15% by 2050 — secular population decline; favor cash flow + early exit over multi-decade hold.
- At projected returns (-3.0% appreciation + 3.0% rent growth), your $32k cash investment doubles in ~6 years — after that, you're playing with house money.
Negotiation context
- It's been on market 263 days — a 12% lower offer ($100k) is reasonable based on typical stale-listing flexibility.
- 2 sale attempts; this cycle's ask has dropped $16k (12%) from the opening price — seller is motivated, your offer sets the floor, not the list.
Questions for the listing agent
- It's been on market 263 days. Have you received any prior offers? Is the seller open to a 12% concession, seller financing, or rate buy-down credit?
- Why hasn't it sold? Are there any deal-killer items the seller is aware of (foundation, flood, title, zoning, code violations)?
- Is there a deadline driving the sale (1031 exchange, divorce, estate, relocation)? That informs how much negotiation room exists.
- Schools are F-rated, which usually means shorter tenancies and higher turnover. Who's the typical renter profile here, and what's been the actual vacancy rate?
- What's the average days-on-market for RENTAL listings here right now (not sales)? A rising rental-DOM trend means longer vacancies and softer asking-rent achievability than the comps imply.
- What's the recent tenant-quality profile in this submarket — average credit score on applications, eviction rate, late-payment / NSF rate, and stable-employment percentage? A property-management company in the area should have these aggregated.
- How much new for-sale + rental construction is in the pipeline within 1–3 miles? Heavy new supply typically softens prices + rents 12–24 months out; constrained supply supports both.
Investment metrics
- 1% rule
- 1.39% ✓
- Cap rate
- 12.22%
- Cash-on-cash
- 21.16%
- DSCR
- 1.94
- GRM
- 6.0
CMA / ARV
- ARV (on-the-fly)
- $94,640
- Comps found
- 6
Show comp detail 6 sales within ~0.75 mi
| Address | Dist | Beds/Ba | Sqft | Sold | Price | $/sf | Match |
|---|---|---|---|---|---|---|---|
| 18717 Mill Villa #101 #101 | 0.00mi | 2/2.0 | 1,040 (0%) | 18mo | $144,000 | $138 | 85 |
| 18717 Mill Villa Rd #421 #421 | 0.00mi | 2/2.0 | 960 (-8%) | 9mo | $60,000 | $63 | 80 |
| 18717 Mill Villa Rd #156 | 0.00mi | 2/2.0 | 1,135 (+9%) | 6mo | $72,000 | $63 | 80 |
| 18717 Mill Villa Rd #250 | 0.00mi | 3/2.0 (+1) | 944 (-9%) | 3mo | $85,500 | $91 | 77 |
| 18717 Mill Villa Rd #402 #402 | 0.00mi | 3/2.0 (+1) | 960 (-8%) | 12mo | $89,000 | $93 | 72 |
| 18725 Hwy 108 #71 #71 | 0.40mi | 3/2.0 (+1) | 1,152 (+11%) | 22mo | $59,000 | $51 | 40 |
Match score weights: distance 35% · size 25% · config 20% · recency 20%. Top-matched comps best support the ARV.
Projected returns pro-forma
-3.0% appreciation · 3.0% rent growth · sell at horizon
- IRR
- 13.6%
- Equity multiple
- 1.54×
- Total profit
- $17,339
- Equity at exit
- $16,998
- IRR
- 22.4%
- Equity multiple
- 2.91×
- Total profit
- $61,103
- Equity at exit
- $9,857
Cash invested: $31,920 (down + closing). Projections, not guarantees.
Landlord ↔ Tenant lean methodology
- Overall (STATE)
- 18 Strongly Tenant-Friendly
- State California
- 18 Strongly Tenant-Friendly · D+13
- County
- — inherits STATE
- City
- — inherits STATE
ZIP-level market 95327
- Active inventory
- 75
- Price-to-rent
- 6.0×
Monthly cashflow live
- Estimated rent
- $1,579 medium interval (Pro) →
- Mortgage (P&I)
- −$598
- Tax from tax record
- −$39 /mo · $470/yr
- Insurance
- −$48
- HOA
- −$0
- Vacancy / Maint / Mgmt
- −$332
- Net cashflow
- $563
Break-even live
UW: 25.0% down · 7.5% · 30yr · 1.5% tax · 5.0% vac · 8.0% maint · 8.0% mgmt
Financing live
Cash to close
- Down payment
- $28,500
- Closing costs
- $3,420
- Reserves months
- —
- Total cash needed
- —
Loan-product check · same deal, 3 products live
Conventional
25% down · 7.5% · 30yr
- Down + closing
- —
- Monthly P&I
- —
- Monthly cashflow
- —
- DSCR
- —
- Eligible?
- —
Personal DTI + credit; lowest rate.
DSCR
20% down · 8.5% · 30yr
- Down + closing
- —
- Monthly P&I
- —
- Monthly cashflow
- —
- DSCR
- —
- Eligible?
- —
No personal income docs; deal must DSCR.
Hard money
10% down · 12.0% · 12mo
- Down + closing
- —
- Monthly P&I
- —
- Monthly cashflow
- —
- DSCR
- —
- Eligible?
- —
Short-term bridge; refi at stabilization.
Listing history 21 events
-
2026-06-18days on market $114,000 Active 263 DOM
-
2026-06-17days on market $114,000 Active 262 DOM
-
2026-06-16days on market $114,000 Active 261 DOM
-
2026-06-15days on market $114,000 Active 260 DOM
-
2026-06-14days on market $114,000 Active 258 DOM
-
2026-06-13days on market $114,000 Active 257 DOM
-
2026-06-10days on market $114,000 Active 255 DOM
-
2026-06-09days on market $114,000 Active 254 DOM
-
2026-06-08days on market $114,000 Active 253 DOM
-
2026-06-07days on market $114,000 Active 252 DOM
-
2026-06-05days on market $114,000 Active 249 DOM
-
2026-06-03days on market $114,000 Active 248 DOM
-
2026-06-02days on market $114,000 Active 247 DOM
-
2026-06-01days on market $114,000 Active 246 DOM
-
2026-05-31days on market $114,000 Active 245 DOM
-
2026-05-30days on market $114,000 Active 244 DOM
-
2026-05-12price $114,000
-
2026-02-27status Active
-
2026-02-25historical
-
2025-11-21price $119,000
-
2025-09-26$130,000 Active
ⓘ Source: listings_history table (triggers on properties + properties_extension) + one-shot
backfill from property_details.listing_events for pre-trigger history.
Tax reassessment forecast CA · Resets to sale price
- Current annual tax
- $470 · $39/mo
- Projected year-2 tax
- $866 · $72/mo
- Expected delta
- +$396/yr (+$33/mo · 84.3%)
ⓘ Screening estimate from a state-policy table — verify with the county assessor before closing.
Nearby sold comps map
Loading sold comps map…
Walkable amenities ~0.75 mi
Loading nearby amenities…
Taxation est. · year 1
- Rental income
- $18,948
- − Mortgage interest
- −$6,386
- − Property taxes
- −$470
- − Insurance
- −$570
- − Repairs & maintenance
- −$1,516
- − Management
- −$1,516
- − Depreciation
- −$3,316
- Taxable income
- $5,174
- Est. tax owed @ 24.0%
- −$1,242
- After-tax cash flow
- $5,513/yr
For passive investors: Depreciation is non-cash, so a rental often shows a tax loss while cash-flowing — sheltering income. Rental losses are passive: they offset passive income freely, and up to $25,000/yr can offset ordinary (W-2) income if you actively participate and your MAGI is under $100k (phasing out to $0 by $150k); unused losses carry forward. On sale, claimed depreciation is recaptured at up to 25%, and gains may owe capital-gains tax (a 1031 exchange can defer both). Figures are a year-1 estimate at your 24.0% rate — not tax advice; consult a CPA.
Schools (NCES district)
- District
- Sonora Union High
- NCES district ID
- 0637260
- Math proficiency
- 21% ▼ -12.00%
- Reading proficiency
- 59% ▼ -5.00%
- Median HH income
- $40,252
- Composite
- 33.41/100
- National rank
- #5470
- State rank
- #243 of 517 in CA
Livability — Jamestown
- Score
- 53/100
- State rank
- #980
- US rank
- #24642
Category grades
Schools grade is shown separately in the Schools card above.
Census & demographics
- Census place
- Jamestown, CA
- Population (ZIP)
- 8,799
Population outlook (Tuolumne County) Hauer SSP2
- Today (2025)
- 50,349 people
- By 2030
- 48,708 · -3.3%
- By 2040
- 45,284 · -10.1%
- By 2050
- 42,575 · -15.4%
- By 2075
- 36,827 · -26.9%
- By 2100
- 30,369 · -39.7%
Race, ethnicity, and origin ACS 2023
- Neighborhood character
- Majority White (63%)
- Race & ethnicity
- White 63% Hispanic / Latino 24% Two or more races 13% Black 7% Native American 3% Asian 1%
- Hispanic origin (detail)
- Mexican 15%
- Common ancestry
- Slovak 4% Serbian 3% Lithuanian 2%
- Foreign-born
- 5% · Canada
- Languages at home
- 87% English-only · Spanish 11% Other Asian/Pacific 1%
Political lean MEDSL · Tuolumne
- 2024 margin
- Strong R (+21.9) · D 37.9% · R 59.7% · Other 2.4%
- 2008→2024 swing
- -9.2pp toward R · 2008: -12.7pp · 2024: -21.9pp
- All cycles
- 2024: R+21.9 2020: R+18.8 2016: R+20.9 2012: R+15.9 2008: R+12.7
Not yet ingested
- Civics
- —
Market trends
- HPI YoY
- ▼ -129.96%
- Current HPI
- 100.2616
- Rent YoY
- —
- Metro
- —
- State GDP YoY
- ▲ 3.21%
- F500 in state
- 116
Industry mix (Fortune 500 HQ in CA)
| Industry | F500 HQs | Revenue |
|---|---|---|
| Technology | 27 | $1,492B |
|
||
| Financial Services | 3 | $174B |
|
||
| Retail | 3 | $44B |
|
||
| Insurance | 3 | $26B |
|
||
| Media / Entertainment | 2 | $115B |
|
||
| Pharmaceuticals / Biotech | 2 | $62B |
|
||
Price history
-12.3% since first listed5 events — show timeline
- 2026-05-12 Price Changed $114,000 bridgeMLS, Bay East AOR, or Contra Costa AOR
- 2026-02-27 Relisted — bridgeMLS, Bay East AOR, or Contra Costa AOR
- 2026-02-25 Listing Removed — bridgeMLS, Bay East AOR, or Contra Costa AOR
- 2025-11-21 Price Changed $119,000 bridgeMLS, Bay East AOR, or Contra Costa AOR
- 2025-09-26 Listed $130,000 bridgeMLS, Bay East AOR, or Contra Costa AOR
Property tax history
+0.0%/yrLatest (2025): $470 · -0.3% YoY. Source: county tax records.
Cash-flow waterfall
monthlySold comps — $/sqft
last 12 mo · ≤1 miLoading sold comps…