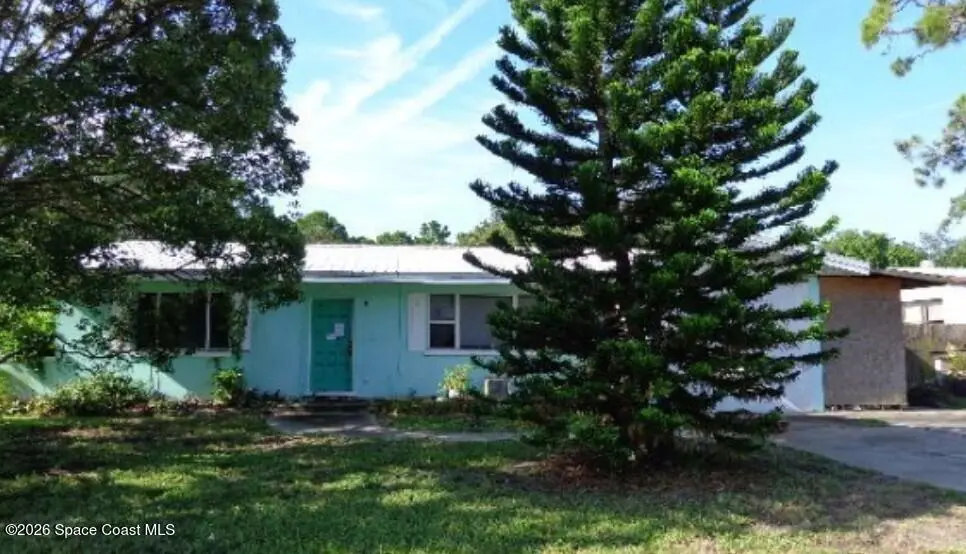
1003 Woodlawn Rd · Rockledge, FL
Flood risk 1/10 · Minimal
- FEMA flood zone
- X (unshaded)
- Chance of flooding over 30 yrs
- 0.0%
- Est. flood insurance / yr
- $507 – $1,088
Fire risk 3/10 · Minor
- Est. fire insurance / yr
- $947 – $1,759
Heat risk 10/10 · Severe
- Hot days now (above 106°F)
- 7 days/yr
- Hot days in 30 yrs
- 22 days/yr
Wind risk 10/10 · Severe
- Chance of severe wind over 30 yrs
- 99.0%
Air-quality risk 1/10 · Minimal
- Unhealthy air days now
- 0 days/yr
- Unhealthy air days in 30 yrs
- 0 days/yr
Risk factors via First Street. Map © Google.
Why this score? — see what drove the C- grade
The composite is a weighted blend of 9 inputs, each scored 0–100. Each bar is that input's sub-score; the figure is the points it added to the 100-point composite (weight × sub-score).
- Cash flow +20.6/30.0
- ARV discount +7.5/15.0
- DSCR +6.6/10.0
- Schools +4.7/10.0
- 1% rule +4.1/10.0
- Livability +4.0/5.0
- Rent growth +2.5/5.0
- Condition / age +2.5/5.0
- Appreciation +0.0/10.0
$229,000
🖨 Deal sheet 📄 Offer letter ✓ Due diligence
Listing remarks MLS
Metal Roof! Split plan 3 bedroom, 2 bath home w/ 1-car carport that has been converted but could easily go back. Living area, family rm, screened patio, & fenced yard too! AS-IS Purchase - No showings until trash out is completed - Call listing agent. Bank of America, N. A. employees & employees householdmembers & business partners of the Bank are prohibited from purchasing: this property, whether directly or indirectly. Special deed restrictions may apply.
Key facts
- Screened patio
- Metal roof
- Convenient location
Tags
Property features AI
Exterior
- Parking: Carport; One garage space and one carport space
- Utilities: Public sewer; Electricity available; Sewer connected; Water connected
- Home design: Single-family residence; North-facing
- Construction: Concrete and stucco construction; Metal roof; Building area approximately 1,966 (unit of measure provided in source)
- Exterior features: Porch, including a screened porch; Fenced yard; Lot approximately 0.24 acres; Other lot features
Interior
- Kitchen: Kitchen on the main level
- Bedrooms: Three bedrooms on the main level
- Bathrooms: Two full bathrooms
- Heating & cooling: Central heating; Wall/window cooling units
- Interior features: Five total rooms; Living room; Dining room
- Laundry & utility: Unfurnished unit (no built-in laundry information provided)
Neighborhood map
What this means for you Summary
Snapshot
- This is a 3-bed/2.0-bath single-family listed at $229k.
Deal economics
- At list price, monthly cash flow is $308 ($4k/yr) — positive.
- The deal already cash-flows at list — no discount required.
- To meet the 1% rule (rent ≥ 1% of price), the offer needs to be $209k (8.6% below list).
- Recommended offer: $209k (8.6% below list) — sets the bar for 1% rule.
Location & tenants
- Location reads 81/100 on livability (#81 in FL, #1,315 nationally) — a professional / high-income tenant draw. Strengths: housing A+, health & safety A, commute A-; Watch: amenities F.
- Brevard (suburban): math 53% / reading 57% proficiency, ranked #19 of 73 in FL (top 26%) — acceptable for families but not a draw, mixed tenant base, ~2y average lease.
- Zoned schools: Golfview Elementary Magnet School (math 32% / reading 36%, grade F, #1,744 of 2,144 statewide, top 82%, 441 students, 74% FRL); Ronald Mcnair Magnet Middle School (math 58% / reading 50%, grade B-, #196 of 571 statewide, top 36%, 364 students, 58% FRL); Rockledge Senior High School (math 27% / reading 49%, grade F, #328 of 667 statewide, top 50%, 1,558 students, 50% FRL) — zoned schools average 61% FRL vs 43% district-wide (18 pts higher); higher-poverty schools than district average — tighter screening recommended.
- Zoned-school proficiency averages 42% at this address vs 55% district-wide (-13 pts) — the specific schools serving this property underperform the Brevard average; the district grade overstates school quality for this exact location.
- Market conditions: Rents flat; 317 active listings in the ZIP; 17 comparable units currently listed for rent nearby; rentals at typical pace (median 19d on market — plan ~3-4 weeks tenant-placement turnaround); solid renter incomes; 4,602 units permitted in Brevard County in 2024 (702 in 5+ unit buildings).
Forward outlook
- Local home prices are declining (-3.0%/yr); year-one equity from $2k of loan paydown is wiped out by about $7k of value loss. Plan a longer hold.
- Brevard County population projected at +15% by 2050 — modest demand growth; plan on rents tracking national, not racing it.
Negotiation context
- It's been on market 19 days — a 2% lower offer ($226k) is reasonable based on typical stale-listing flexibility.
- 3 sale attempts since 13y ago with the ask held roughly flat each time — persistent listings suggest the price (not the market) is what's stuck; bring a comps-based counter.
- Current owner paid $53k; list at $229k implies a 334% gain — meaningful room to come down on a strong offer.
Risks & watch-outs
- Watch-outs: built in 1954 — expect roof / HVAC / electrical / plumbing capex.
- Climate carrying-cost: severe wind risk, 99% chance of damaging wind over 30y; extreme-heat days projected 7→22/yr by 2055 (HVAC capex compounding) — expect insurance premiums to compound above CPI over the hold.
Questions for the listing agent
- Built in 1954 — when were the roof, HVAC, electrical panel, plumbing, and water heater last replaced?
- Is there a deadline driving the sale (1031 exchange, divorce, estate, relocation)? That informs how much negotiation room exists.
- Schools are B-rated — typically a magnet for longer-tenancy family renters. What's the average tenant stay here, and is there a school-zone premium baked into asking?
- What's the average days-on-market for RENTAL listings here right now (not sales)? A rising rental-DOM trend means longer vacancies and softer asking-rent achievability than the comps imply.
- What's the recent tenant-quality profile in this submarket — average credit score on applications, eviction rate, late-payment / NSF rate, and stable-employment percentage? A property-management company in the area should have these aggregated.
- How much new for-sale + rental construction is in the pipeline within 1–3 miles? Heavy new supply typically softens prices + rents 12–24 months out; constrained supply supports both.
Investment metrics
- 1% rule
- 0.91% ✗
- Cap rate
- 7.91%
- Cash-on-cash
- 5.76%
- DSCR
- 1.26
- GRM
- 9.1
CMA / ARV
No comps found within radius.
Projected returns pro-forma
-3.0% appreciation · 0.12% rent growth · sell at horizon
- IRR
- -10.3%
- Equity multiple
- 0.63×
- Total profit
- $-23,509
- Equity at exit
- $34,145
- IRR
- -5.0%
- Equity multiple
- 0.71×
- Total profit
- $-18,523
- Equity at exit
- $19,800
Cash invested: $64,120 (down + closing). Projections, not guarantees.
Landlord ↔ Tenant lean methodology
- Overall (STATE)
- 87 Strongly Landlord-Friendly
- State Florida
- 87 Strongly Landlord-Friendly · R+3
- County
- — inherits STATE
- City
- — inherits STATE
ZIP-level market 32955
- Home prices YoY
- -20.7%
- Rents YoY
- 0.1%
- Active inventory
- 317
- Price-to-rent
- 9.1×
Monthly cashflow live
- Estimated rent
- $2,093 high interval (Pro) →
- Mortgage (P&I)
- −$1,201
- Tax from tax record
- −$49 /mo · $590/yr
- Insurance
- −$95
- HOA
- −$0
- Vacancy / Maint / Mgmt
- −$439
- Net cashflow
- $308
Break-even live
UW: 25.0% down · 7.5% · 30yr · 1.5% tax · 5.0% vac · 8.0% maint · 8.0% mgmt
Financing live
Cash to close
- Down payment
- $57,250
- Closing costs
- $6,870
- Reserves months
- —
- Total cash needed
- —
Loan-product check · same deal, 3 products live
Conventional
25% down · 7.5% · 30yr
- Down + closing
- —
- Monthly P&I
- —
- Monthly cashflow
- —
- DSCR
- —
- Eligible?
- —
Personal DTI + credit; lowest rate.
DSCR
20% down · 8.5% · 30yr
- Down + closing
- —
- Monthly P&I
- —
- Monthly cashflow
- —
- DSCR
- —
- Eligible?
- —
No personal income docs; deal must DSCR.
Hard money
10% down · 12.0% · 12mo
- Down + closing
- —
- Monthly P&I
- —
- Monthly cashflow
- —
- DSCR
- —
- Eligible?
- —
Short-term bridge; refi at stabilization.
Rent comps 17 comps
| Address | Beds | Baths | Sqft | Rent | $/sqft | DOM | Units | Dist |
|---|---|---|---|---|---|---|---|---|
| 1675 S Fiske Blvd #155 Rockledge, FL | 2.0 | 2.0 | 1170 | $1,750 | $1.50 | 13d | 1 | 0.39mi |
| 944 Kentucky Ave Rockledge, FL | 3.0 | 2.0 | 1236 | $1,945 | $1.57 | 19d | 1 | 0.40mi |
| 1147 Manatee Dr Rockledge, FL | 3.0 | 2.0 | 1810 | $2,095 | $1.16 | 19d | 1 | 0.44mi |
| 1105 Santa Rosa Dr Rockledge, FL | 3.0 | 2.0 | 1096 | $2,000 | $1.82 | 23d | 1 | 0.52mi |
| 1600 Woodland Dr Unit 1 Rockledge, FL | 3.0 | 2.0 | 1426 | $1,995 | $1.40 | 14d | 1 | 0.78mi |
| 516 Donley St Cocoa, FL | 2.0 | 2.0 | 1485 | $1,800 | $1.21 | 19d | 1 | 0.81mi |
| 613 Paw Paw St Apt A Cocoa, FL | 2.0 | 1.0 | 1104 | $1,175 | $1.06 | 23d | 1 | 0.91mi |
| 823 Angela Ave Unit A Rockledge, FL | 2.0 | 2.0 | 1117 | $1,750 | $1.57 | 14d | 1 | 0.93mi |
| 1607 Amalfi Dr Cocoa, FL | 3.0–4.0 | 2.0 | 1750 | $2,488 | $1.42 | 13d | 5 | 0.99mi |
| 295 Royal Tern CIR Rockledge, FL | 1.0–3.0 | 1.0–2.0 | 1020 | $2,467 | $2.42 | 14d | 33 | 1.08mi |
| 256 Barton Blvd Rockledge, FL | 3.0 | 1.0–2.0 | 1012 | $2,115 | $2.09 | 14d | 23 | 1.09mi |
| 1001 Cascade Cir Rockledge, FL | 2.0–3.0 | 2.0 | 1274 | $2,065 | $1.62 | 14d | 6 | 1.25mi |
| 1515 Peachtree St Cocoa, FL | 3.0 | 2.0 | 1056 | $1,475 | $1.40 | 23d | 1 | 1.35mi |
| 1880 Murrell Rd Unit Q63 Rockledge, FL | 2.0 | 1.5 | 1200 | $1,700 | $1.42 | 23d | 1 | 1.36mi |
| 305 Prospect Ave Cocoa, FL | 3.0 | 1.0 | 1180 | $1,595 | $1.35 | 23d | 1 | 1.44mi |
| 102 Riverside Dr #806 Cocoa, FL | 3.0 | 3.0 | 2019 | $3,500 | $1.73 | 23d | 1 | 1.45mi |
| 305 Edinburgh Dr Cocoa, FL | 3.0 | 1.5 | 1280 | $1,750 | $1.37 | 23d | 1 | 1.47mi |
Listing history 15 events
-
2026-06-18days on market $229,000 Active 19 DOM
-
2026-06-17days on market $229,000 Active 18 DOM
-
2026-06-16days on market $229,000 Active 17 DOM
-
2026-06-15days on market $229,000 Active 16 DOM
-
2026-06-14days on market $229,000 Active 14 DOM
-
2026-06-10days on market $229,000 Active 11 DOM
-
2026-06-08days on market $229,000 Active 9 DOM
-
2026-06-07days on market $229,000 Active 8 DOM
-
2026-06-05days on market $229,000 Active 5 DOM
-
2026-06-03days on market $229,000 Active 4 DOM
-
2026-06-02remarks 692-char remark
-
2026-06-02days on market $229,000 Active 3 DOM
-
2026-06-01days on market $229,000 Active 2 DOM
-
2026-05-31remarks 392-char remark
-
2026-05-31$229,000 Active 1 DOM
ⓘ Source: listings_history table (triggers on properties + properties_extension) + one-shot
backfill from property_details.listing_events for pre-trigger history.
Tax reassessment forecast FL · Resets to sale price
- Current annual tax
- $590 · $49/mo
- Projected year-2 tax
- $1,901 · $158/mo
- Expected delta
- +$1,311/yr (+$109/mo · 222.1%)
ⓘ Screening estimate from a state-policy table — verify with the county assessor before closing.
Climate risk First Street
- Flood 1/10 Low FEMA zone X (unshaded) · 0% chance over 30 yrs
- Wildfire 3/10 Moderate
- Heat 10/10 Extreme 7 d/yr ≥106°F today · 22 d/yr by 30 yrs out
- Wind 10/10 Extreme 99% chance of damaging wind over 30 yrs
- Air quality 1/10 Low 0 unhealthy d/yr today · 0 by 30 yrs out
Nearby sold comps map
Loading sold comps map…
Walkable amenities ~0.75 mi
Loading nearby amenities…
Taxation est. · year 1
- Rental income
- $25,114
- − Mortgage interest
- −$12,828
- − Property taxes
- −$590
- − Insurance
- −$1,145
- − Repairs & maintenance
- −$2,009
- − Management
- −$2,009
- − Depreciation
- −$6,662
- Taxable loss
- −$129
- Est. tax savings @ 24.0%
- +$31
- After-tax cash flow
- $3,725/yr
For passive investors: Depreciation is non-cash, so a rental often shows a tax loss while cash-flowing — sheltering income. Rental losses are passive: they offset passive income freely, and up to $25,000/yr can offset ordinary (W-2) income if you actively participate and your MAGI is under $100k (phasing out to $0 by $150k); unused losses carry forward. On sale, claimed depreciation is recaptured at up to 25%, and gains may owe capital-gains tax (a 1031 exchange can defer both). Figures are a year-1 estimate at your 24.0% rate — not tax advice; consult a CPA.
Schools (NCES district)
- District
- Brevard
- NCES district ID
- 1200150
- Math proficiency
- 53% ▼ -9.00%
- Reading proficiency
- 57% ▼ -4.00%
- Median HH income
- $49,426
- Composite
- 46.86/100
- National rank
- #2370
- State rank
- #19 of 73 in FL
Livability — Rockledge
- Score
- 81/100
- State rank
- #81
- US rank
- #1315
Category grades
Schools grade is shown separately in the Schools card above.
Census & demographics
- Census place
- Rockledge, FL
- County
- Brevard County · 602,871 people
- City population
- 41,008
- Metro
- Palm Bay-Melbourne-Titusville, FL
- Population (ZIP)
- 41,008
- Household income
- $86,457
- Rent vs Own
- Severe rent burden
- 1273.0
Population outlook (Brevard County) Hauer SSP2
- Today (2025)
- 623,254 people
- By 2030
- 648,420 · +4.0%
- By 2040
- 690,009 · +10.7%
- By 2050
- 715,669 · +14.8%
- By 2075
- 775,744 · +24.5%
- By 2100
- 776,687 · +24.6%
Race, ethnicity, and origin ACS 2023
- Neighborhood character
- Predominantly White (69%)
- Race & ethnicity
- White 69% Black 14% Hispanic / Latino 9% Two or more races 8% Asian 2%
- Hispanic origin (detail)
- Mexican 1% Puerto Rican 3%
- Common ancestry
- Slovak 3% Romanian 2% Serbian 2%
- Foreign-born
- 7% · Canada, Jamaica, Mexico
- Languages at home
- 91% English-only · Spanish 5% Other Indo-European 2%
Political lean MEDSL · Brevard
- 2024 margin
- Strong R (+20.8) · D 39.1% · R 59.9% · Other 1.0%
- 2008→2024 swing
- -10.4pp toward R · 2008: -10.4pp · 2024: -20.8pp
- All cycles
- 2024: R+20.8 2020: R+16.4 2016: R+19.8 2012: R+12.7 2008: R+10.4
Not yet ingested
- Civics
- —
Market trends
- HPI YoY
- ▼ -81.70%
- Current HPI
- 312.7435
- Rent YoY
- ▲ 0.12%
- Metro
- Palm Bay-Melbourne-Titusville, FL
- State GDP YoY
- ▲ 3.28%
- F500 in state
- 36
Industry mix (Fortune 500 HQ in FL)
| Industry | F500 HQs | Revenue |
|---|---|---|
| Industrial Technology | 2 | $29B |
|
||
| Insurance | 2 | $17B |
|
||
| Retail | 1 | $60B |
|
||
| Technology Distribution | 1 | $58B |
|
||
| Homebuilding | 1 | $35B |
|
||
| Technology Manufacturing | 1 | $35B |
|
||
Price history
+358.0% since first listed7 events — show timeline
- 2026-05-29 Listed $229,000 SCMLS
- 2013-09-26 Sold (MLS) $52,800 SCMLS
- 2013-07-19 Listed $579,000 SCMLS
- 2013-07-19 Listing Removed — SCMLS
- 2013-07-19 Listed $57,900 SCMLS
- 1995-06-20 Sold (Public Records) $56,300 Public Records
- 1983-11-01 Sold (Public Records) $50,000 Public Records
Property tax history
-0.8%/yrLatest (2025): $590 · +5.1% YoY. Source: county tax records.
Cash-flow waterfall
monthlySold comps — $/sqft
last 12 mo · ≤1 miLoading sold comps…