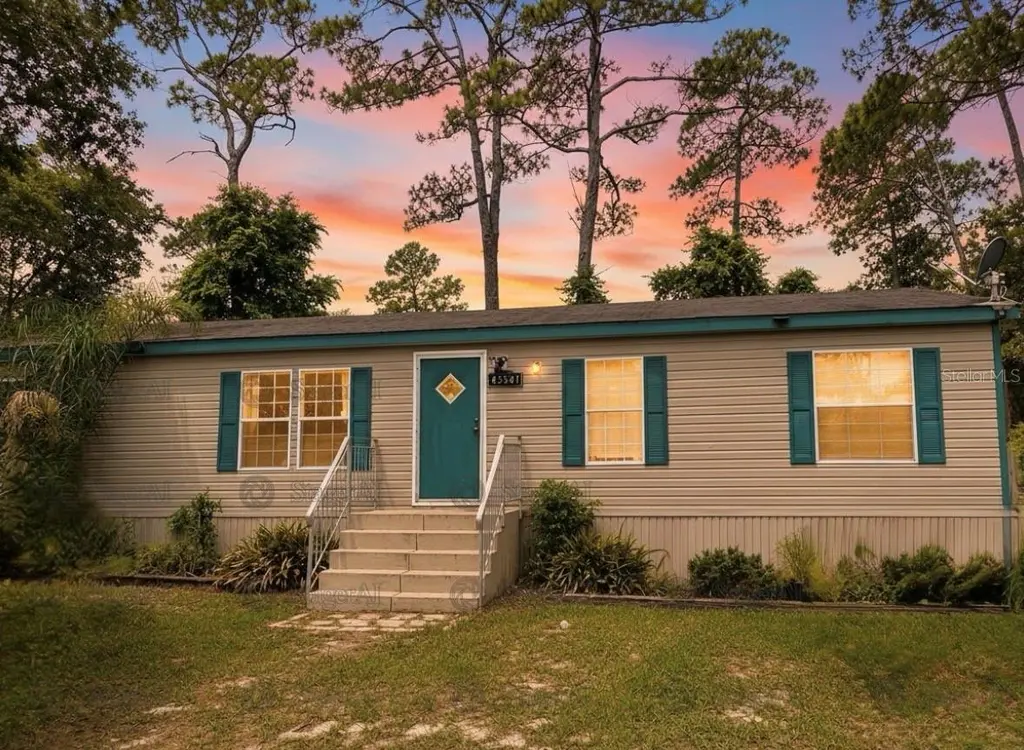
45541 Pennsylvania St · Lake Kathryn, FL
Flood risk 1/10 · Minimal
- FEMA flood zone
- X (shaded)
- Chance of flooding over 30 yrs
- 0.0%
- Est. flood insurance / yr
- $507 – $1,088
Fire risk 6/10 · Moderate
- Est. fire insurance / yr
- $947 – $1,759
Heat risk 8/10 · Major
- Hot days now (above 107°F)
- 7 days/yr
- Hot days in 30 yrs
- 20 days/yr
Wind risk 9/10 · Severe
- Chance of severe wind over 30 yrs
- 99.0%
Air-quality risk 2/10 · Minimal
- Unhealthy air days now
- 1 days/yr
- Unhealthy air days in 30 yrs
- 1 days/yr
Risk factors via First Street. Map © Google.
Why this score? — see what drove the D grade
The composite is a weighted blend of 9 inputs, each scored 0–100. Each bar is that input's sub-score; the figure is the points it added to the 100-point composite (weight × sub-score).
- Cash flow +10.4/30.0
- Appreciation +10.0/10.0
- Schools +4.2/10.0
- ARV discount +3.6/15.0
- DSCR +3.0/10.0
- Rent growth +2.5/5.0
- Condition / age +2.5/5.0
- 1% rule +2.4/10.0
- Livability +2.3/5.0
$189,900
🖨 Deal sheet 📄 Offer letter ✓ Due diligence
Listing remarks MLS
LIGHT BRIGHT AND INVITING. CLEAN, MOVE IN READY. NO DRAMA. THIS OVERSIZED 56 X 32 GENERAL MOTOR 32 IS IN FANTASTIC SHAPE AND HAS MANY GREAT FEATURES INCLUDING: 15 X 10 STUDY/DEN THAT COULD EASILY BE USED AS A 4TH BEDROOM, DOUBLE PANE STORM WINDOWS, WOOD LAMINATE FLOORING, VAULTED CEILINGS, PLANT SHELVES, INSIDE UTILITY, FREEZER, WALK IN PANTRY, NEW THERMOSTAT, NEW CARPETING, NEW SHOWER FEATURES AND SINKS, NEW PUMP HOUSE WITH POWER, NEW WATER SOFTENER, NEW CHAIN LINK DOUBLE GATED FENCING, NEW 6 FOOT DOUBLE GATED PRIVACY FENCING IN THE BACK, RING SECURITY SYSTEM AND MUCH MORE. THIS IS A GREAT PROPERTY AT A GREAT PRICE AND READY TO CALL HOME.
Key facts
- Large lot
- Ample room for rv
- Versatile bonus room
Tags
Property features AI
Finance
- Other: Homestead exempt; Zoned R-7; One well and one septic on property
Exterior
- Parking: Open parking; Parking pad; Other parking options
- Security: Smoke detectors
- Utilities: Well water; Septic tank; Electricity connected; Cable connected; Water connected
- Home design: Manufactured double-wide home; Single-story (one level); South-facing
- Construction: Vinyl siding; Other construction materials; Shingle roof; Crawlspace foundation; Built as a manufactured home
- Exterior features: Chain link fencing; Cross-fenced yard; Wood fencing; Paved road access; Lot roughly 0.23 acre (approx. 100 x 100)
Interior
- Kitchen: Built-in oven; Microwave; Range; Range hood; Refrigerator; Eat-in kitchen
- Bedrooms: 4 bedrooms
- Flooring: Wood flooring; Laminate flooring; Carpet
- Bathrooms: 2 full bathrooms
- Heating & cooling: Central heating; Central air conditioning
- Interior features: Cathedral ceilings; Vaulted ceilings; Open floorplan; Eat-in kitchen; Split bedroom layout; Walk-in closets; Window treatments (blinds, shades, double-pane windows)
- Laundry & utility: Indoor laundry room; Electric water heater; Inside utility
Neighborhood map
What this means for you Summary
Snapshot
- This is a 3-bed/2.0-bath manufactured listed at $190k.
Deal economics
- At list price, monthly cash flow is $-101 ($-1k/yr) — negative.
- To cash-flow at today's rent, offer at most $172k (9.4% below list).
- To meet the 1% rule (rent ≥ 1% of price), the offer needs to be $141k (26.0% below list).
- Recommended offer: $141k (26.0% below list) — sets the bar for 1% rule.
Location & tenants
- Location reads 46/100 on livability (#896 in FL) — a working-class tenant base; expect higher turnover. Strengths: crime A, cost of living B; Watch: schools F, amenities F, commute F.
- Lake (suburban): math 49% / reading 50% proficiency, ranked #37 of 73 in FL (top 51%) — families likely to look elsewhere, expect single-tenant / working-renter base with shorter leases.
- Market conditions: 81 active listings in the ZIP; 4,799 units permitted in Lake County in 2024 (814 in 5+ unit buildings).
Forward outlook
- In year one you build about $20k of equity ($1k loan paydown + $19k appreciation (10.0% local appreciation)).
- Lake County population projected at +37% by 2050 — long-run rental-demand tailwind backs the buy-and-hold thesis.
- By year 2, paydown + projected appreciation supports a ~$33k cash-out refi (75% LTV) — recoverable capital for the next deal without selling this one.
Negotiation context
- Only 2 days on market — expect competitive offers; lowballing is unlikely to land.
- 4 sale attempts since 11y ago with the ask held roughly flat each time — persistent listings suggest the price (not the market) is what's stuck; bring a comps-based counter.
- Current owner paid $162k; 17% above their basis — modest negotiation headroom, anchor on the comps not their cost.
Risks & watch-outs
- Climate carrying-cost: severe wind risk, 99% chance of damaging wind over 30y; major wildfire risk; extreme-heat days projected 7→20/yr by 2055 (HVAC capex compounding) — expect insurance premiums to compound above CPI over the hold.
Questions for the listing agent
- What do current leases actually rent for vs. the listed asking? Can we see a recent rent roll and the last 12 months of T-12 income?
- Is there a deadline driving the sale (1031 exchange, divorce, estate, relocation)? That informs how much negotiation room exists.
- Schools are F-rated, which usually means shorter tenancies and higher turnover. Who's the typical renter profile here, and what's been the actual vacancy rate?
- The area grade is low — what's the realistic commute time and amenity access for the typical tenant pool here? Any planned neighborhood developments (good or bad) we should know about?
- What's the average days-on-market for RENTAL listings here right now (not sales)? A rising rental-DOM trend means longer vacancies and softer asking-rent achievability than the comps imply.
- What's the recent tenant-quality profile in this submarket — average credit score on applications, eviction rate, late-payment / NSF rate, and stable-employment percentage? A property-management company in the area should have these aggregated.
- How much new for-sale + rental construction is in the pipeline within 1–3 miles? Heavy new supply typically softens prices + rents 12–24 months out; constrained supply supports both.
Investment metrics
- 1% rule
- 0.74% ✗
- Cap rate
- 5.65%
- Cash-on-cash
- -2.29%
- DSCR
- 0.90
- GRM
- 11.3
CMA / ARV
- ARV (on-the-fly)
- $174,720
- Comps found
- 1
Show comp detail 1 sale within ~0.75 mi
| Address | Dist | Beds/Ba | Sqft | Sold | Price | $/sf | Match |
|---|---|---|---|---|---|---|---|
| 27912 Lake Ave | 0.26mi | 3/2.0 | 1,380 (-12%) | 1mo | $155,000 | $112 | 68 |
Match score weights: distance 35% · size 25% · config 20% · recency 20%. Top-matched comps best support the ARV.
Projected returns pro-forma
10.0% appreciation · 3.0% rent growth · sell at horizon
- IRR
- 22.6%
- Equity multiple
- 2.82×
- Total profit
- $96,923
- Equity at exit
- $171,077
- IRR
- 20.3%
- Equity multiple
- 6.46×
- Total profit
- $290,422
- Equity at exit
- $368,934
Cash invested: $53,172 (down + closing). Projections, not guarantees.
Landlord ↔ Tenant lean methodology
- Overall (STATE)
- 87 Strongly Landlord-Friendly
- State Florida
- 87 Strongly Landlord-Friendly · R+3
- County
- — inherits STATE
- City
- — inherits STATE
ZIP-level market 32767
- Home prices YoY
- 3.0%
- Active inventory
- 81
- Price-to-rent
- 11.3×
Monthly cashflow live
- Estimated rent
- $1,406 medium interval (Pro) →
- Mortgage (P&I)
- −$996
- Tax from tax record
- −$137 /mo · $1,643/yr
- Insurance
- −$79
- HOA
- −$0
- Vacancy / Maint / Mgmt
- −$295
- Net cashflow
- $-101
Break-even live
UW: 25.0% down · 7.5% · 30yr · 1.5% tax · 5.0% vac · 8.0% maint · 8.0% mgmt
Financing live
Cash to close
- Down payment
- $47,475
- Closing costs
- $5,697
- Reserves months
- —
- Total cash needed
- —
Loan-product check · same deal, 3 products live
Conventional
25% down · 7.5% · 30yr
- Down + closing
- —
- Monthly P&I
- —
- Monthly cashflow
- —
- DSCR
- —
- Eligible?
- —
Personal DTI + credit; lowest rate.
DSCR
20% down · 8.5% · 30yr
- Down + closing
- —
- Monthly P&I
- —
- Monthly cashflow
- —
- DSCR
- —
- Eligible?
- —
No personal income docs; deal must DSCR.
Hard money
10% down · 12.0% · 12mo
- Down + closing
- —
- Monthly P&I
- —
- Monthly cashflow
- —
- DSCR
- —
- Eligible?
- —
Short-term bridge; refi at stabilization.
Listing history 3 events
-
2026-06-09days on market $189,900 Active 2 DOM
-
2026-06-08remarks 699-char remark
-
2026-06-08$189,900 Active 1 DOM
ⓘ Source: listings_history table (triggers on properties + properties_extension) + one-shot
backfill from property_details.listing_events for pre-trigger history.
Tax reassessment forecast FL · Resets to sale price
- Current annual tax
- $1,643 · $137/mo
- Projected year-2 tax
- $1,643 · $137/mo
- Expected delta
- $0/yr ($0/mo · -0.0%)
ⓘ Screening estimate from a state-policy table — verify with the county assessor before closing.
Climate risk First Street
- Flood 1/10 Low FEMA zone X (shaded) · 0% chance over 30 yrs
- Wildfire 6/10 Major
- Heat 8/10 Severe 7 d/yr ≥107°F today · 20 d/yr by 30 yrs out
- Wind 9/10 Extreme 99% chance of damaging wind over 30 yrs
- Air quality 2/10 Low 1 unhealthy d/yr today · 1 by 30 yrs out
Nearby sold comps map
Loading sold comps map…
Walkable amenities ~0.75 mi
Loading nearby amenities…
Taxation est. · year 1
- Rental income
- $16,868
- − Mortgage interest
- −$10,637
- − Property taxes
- −$1,643
- − Insurance
- −$950
- − Repairs & maintenance
- −$1,349
- − Management
- −$1,349
- − Depreciation
- −$5,524
- Taxable loss
- −$4,585
- Est. tax savings @ 24.0%
- +$1,101
- After-tax cash flow
- $-117/yr
For passive investors: Depreciation is non-cash, so a rental often shows a tax loss while cash-flowing — sheltering income. Rental losses are passive: they offset passive income freely, and up to $25,000/yr can offset ordinary (W-2) income if you actively participate and your MAGI is under $100k (phasing out to $0 by $150k); unused losses carry forward. On sale, claimed depreciation is recaptured at up to 25%, and gains may owe capital-gains tax (a 1031 exchange can defer both). Figures are a year-1 estimate at your 24.0% rate — not tax advice; consult a CPA.
Schools (NCES district)
- District
- Lake
- NCES district ID
- 1201050
- Math proficiency
- 49% ▼ -7.00%
- Reading proficiency
- 50% ▼ -4.00%
- Median HH income
- $46,632
- Composite
- 42.05/100
- National rank
- #3327
- State rank
- #37 of 73 in FL
Livability — Lake Kathryn
- Score
- 46/100
- State rank
- #896
- US rank
- #26433
Category grades
Schools grade is shown separately in the Schools card above.
Census & demographics
- Census place
- Lake Kathryn, FL
- Population (ZIP)
- 2,839
Population outlook (Lake County) Hauer SSP2
- Today (2025)
- 386,640 people
- By 2030
- 417,107 · +7.9%
- By 2040
- 476,676 · +23.3%
- By 2050
- 531,296 · +37.4%
- By 2075
- 648,303 · +67.7%
- By 2100
- 698,530 · +80.7%
Race, ethnicity, and origin ACS 2023
- Neighborhood character
- Predominantly White (96%)
- Race & ethnicity
- White 96% Hispanic / Latino 2% Two or more races 1%
- Common ancestry
- Italian 3% Russian 3% Lithuanian 1%
- Foreign-born
- 1%
- Languages at home
- 98% English-only · Spanish 2%
Political lean MEDSL · Lake
- 2024 margin
- Strong R (+24.7) · D 37.3% · R 62.0%
- 2008→2024 swing
- -11.2pp toward R · 2008: -13.5pp · 2024: -24.7pp
- All cycles
- 2024: R+24.7 2020: R+20.0 2016: R+23.1 2012: R+17.1 2008: R+13.5
Not yet ingested
- Civics
- —
Market trends
- HPI YoY
- ▲ 11.00%
- Current HPI
- 372.7
- Rent YoY
- —
- Metro
- —
- State GDP YoY
- ▲ 3.28%
- F500 in state
- 36
Industry mix (Fortune 500 HQ in FL)
| Industry | F500 HQs | Revenue |
|---|---|---|
| Industrial Technology | 2 | $29B |
|
||
| Insurance | 2 | $17B |
|
||
| Retail | 1 | $60B |
|
||
| Technology Distribution | 1 | $58B |
|
||
| Homebuilding | 1 | $35B |
|
||
| Technology Manufacturing | 1 | $35B |
|
||
Price history
+131.9% since first listed10 events — show timeline
- 2026-06-07 Price Changed $189,900 Stellar MLS as Distributed by MLS Grid
- 2026-06-07 Listed $185,000 Stellar MLS as Distributed by MLS Grid
- 2022-11-21 Sold (Public Records) $162,000 Public Records
- 2022-11-15 Sold (MLS) $160,000 Stellar MLS as Distributed by MLS Grid
- 2022-10-02 Pending — Stellar MLS as Distributed by MLS Grid
- 2022-09-22 Listed $159,900 Stellar MLS as Distributed by MLS Grid
- 2017-03-11 Listing Removed — Stellar MLS as Distributed by MLS Grid
- 2016-01-28 Listed $79,900 Stellar MLS as Distributed by MLS Grid
- 2015-12-30 Listing Removed — Stellar MLS as Distributed by MLS Grid
- 2015-07-11 Listed $81,900 Stellar MLS as Distributed by MLS Grid
Property tax history
+11.6%/yrLatest (2025): $1,643 · +3.1% YoY. Source: county tax records.
Cash-flow waterfall
monthlySold comps — $/sqft
last 12 mo · ≤1 miLoading sold comps…