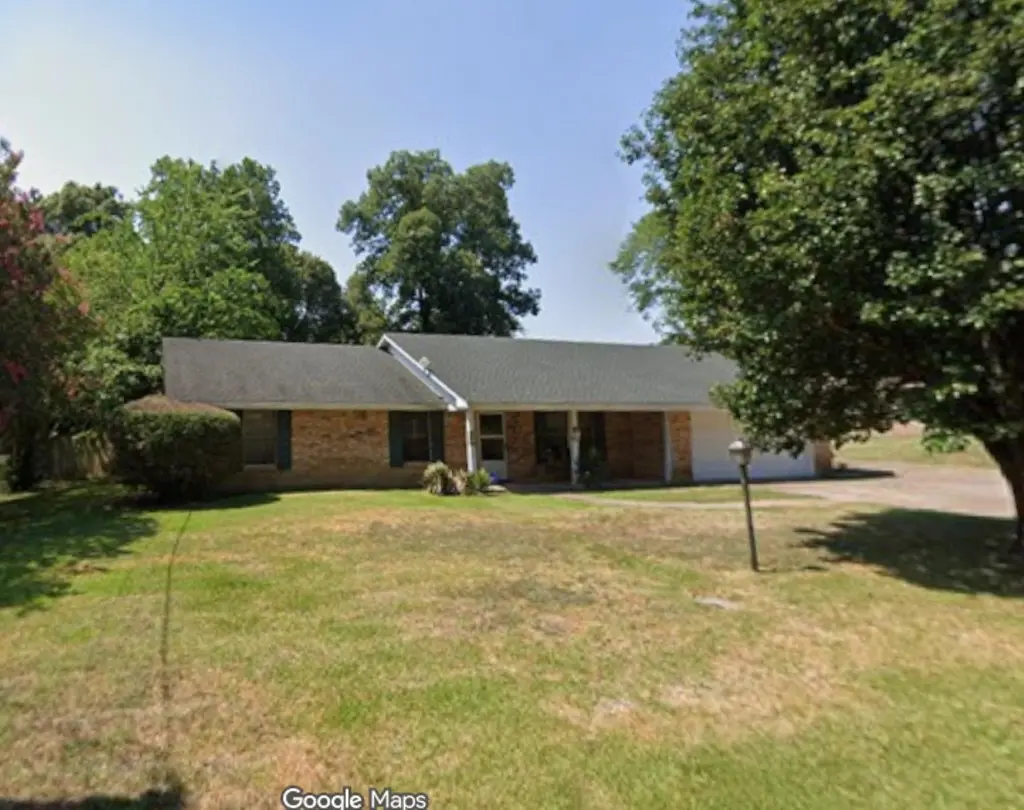
2113 Hendricks St · Gladewater, TX
Flood risk 1/10 · Minimal
- FEMA flood zone
- X (unshaded)
- Chance of flooding over 30 yrs
- 0.0%
- Est. flood insurance / yr
- $507 – $1,088
Fire risk 5/10 · Moderate
- Est. fire insurance / yr
- $1,222 – $2,270
Heat risk 7/10 · Major
- Hot days now (above 110°F)
- 7 days/yr
- Hot days in 30 yrs
- 26 days/yr
Wind risk 6/10 · Moderate
- Chance of severe wind over 30 yrs
- 52.0%
Air-quality risk 2/10 · Minimal
- Unhealthy air days now
- 1 days/yr
- Unhealthy air days in 30 yrs
- 2 days/yr
Risk factors via First Street. Map © Google.
Why this score? — see what drove the D+ grade
The composite is a weighted blend of 9 inputs, each scored 0–100. Each bar is that input's sub-score; the figure is the points it added to the 100-point composite (weight × sub-score).
- Cash flow +15.5/30.0
- ARV discount +8.7/15.0
- 1% rule +5.3/10.0
- DSCR +4.8/10.0
- Livability +3.2/5.0
- Schools +2.7/10.0
- Rent growth +2.5/5.0
- Condition / age +2.5/5.0
- Appreciation +0.0/10.0
$190,000
🖨 Deal sheet (PDF) 📄 Offer letter ✓ Due diligence
Listing remarks MLS
Great home lying in wait for new ownership. Lots of potential for a starter home with updates to this three-bedroom, two-bath home. Two living areas add appeal with a doorway to an open patio in the wood-fenced backyard. Lots of room for children to roam and also accommodate pets. Seller will leave both living areas with existing furniture, except for the recliner. Will also leave glass-front curio cabinet glass top kitchen table.
Key facts
- Open patio
- Two living areas
- Wood-fenced backyard
Tags
Neighborhood map
What this means for you Summary
Snapshot
- This is a 3-bed/2.0-bath single-family listed at $190k.
Deal economics
- At list price, monthly cash flow is $75 ($905/yr) — positive.
- The deal already cash-flows at list — no discount required.
- Meets the 1% rule at list price ($2k rent vs $190k).
- Recommended offer: $179k (6.0% below list) — sets the bar for market timing.
- Cap rate 6.8% vs local median 5.2% in Gladewater — meaningfully above typical; check what's discounted (condition, days-on-market, listing class) to confirm the premium yield is real.
Location & tenants
- Location reads 64/100 on livability (#805 in TX) — a middle-class / working-renter tenant base. Strengths: cost of living A+, housing A; Watch: crime C-, amenities F, commute F.
- Gladewater ISD (suburban): math 29% / reading 34% proficiency, ranked #594 of 826 in TX (top 72%) — families likely to look elsewhere, expect single-tenant / working-renter base with shorter leases; 63% free/reduced lunch — lower-income household profile, screen leases tightly.
- Zoned schools: Gladewater Pri (367 students, 90% FRL); Gladewater Middle (math 34% / reading 37%, grade F, #827 of 1,662 statewide, top 51%, 400 students, 78% FRL); Gladewater H S (math 27% / reading 42%, grade F, #963 of 1,632 statewide, top 61%, 459 students, 73% FRL) — zoned schools average 80% FRL vs 63% district-wide (18 pts higher); higher-poverty schools than district average — tighter screening recommended.
- Market conditions: 179 active listings in the ZIP; 2 comparable units currently listed for rent nearby; 34 units permitted in Upshur County in 2024 (0 in 5+ unit buildings).
Forward outlook
- Local home prices are declining (-3.0%/yr); year-one equity from $1k of loan paydown is wiped out by about $6k of value loss. Plan a longer hold.
- Upshur County population projected at +9% by 2050 — modest demand growth; plan on rents tracking national, not racing it.
Negotiation context
- It's been on market 62 days — a 6% lower offer ($179k) is reasonable based on typical stale-listing flexibility.
- 3 sale attempts since 10y ago with the ask held roughly flat each time — persistent listings suggest the price (not the market) is what's stuck; bring a comps-based counter.
Risks & watch-outs
- Climate carrying-cost: major wind risk, 52% chance of damaging wind over 30y; moderate wildfire risk; extreme-heat days projected 7→26/yr by 2055 (HVAC capex compounding) — expect insurance premiums to compound above CPI over the hold.
Questions for the listing agent
- It's been on market 62 days. Have you received any prior offers? Is the seller open to a 6% concession, seller financing, or rate buy-down credit?
- Built in 1969 — when were the roof, HVAC, electrical panel, plumbing, and water heater last replaced?
- Why hasn't it sold? Are there any deal-killer items the seller is aware of (foundation, flood, title, zoning, code violations)?
- Is there a deadline driving the sale (1031 exchange, divorce, estate, relocation)? That informs how much negotiation room exists.
- Schools are D-rated, which usually means shorter tenancies and higher turnover. Who's the typical renter profile here, and what's been the actual vacancy rate?
- The area grade is low — what's the realistic commute time and amenity access for the typical tenant pool here? Any planned neighborhood developments (good or bad) we should know about?
- What's the average days-on-market for RENTAL listings here right now (not sales)? A rising rental-DOM trend means longer vacancies and softer asking-rent achievability than the comps imply.
- What's the recent tenant-quality profile in this submarket — average credit score on applications, eviction rate, late-payment / NSF rate, and stable-employment percentage? A property-management company in the area should have these aggregated.
- How much new for-sale + rental construction is in the pipeline within 1–3 miles? Heavy new supply typically softens prices + rents 12–24 months out; constrained supply supports both.
Investment metrics
- 1% rule
- 1.03% ✓
- Cap rate
- 6.77%
- Cash-on-cash
- 1.70%
- DSCR
- 1.08
- GRM
- 8.1
CMA / ARV
- ARV (median comp)
- $195,294
- List price
- $190,000
- Delta
- -2.71%
- Verdict
- FAIR
- Comps
- 11 within 1.0 mi
Show comp detail 3 sales within ~0.75 mi
| Address | Dist | Beds/Ba | Sqft | Sold | Price | $/sf | Match |
|---|---|---|---|---|---|---|---|
| 1013 Chevy Chase St | 0.18mi | 3/2.0 | 1,572 (-1%) | 22mo | $215,000 | $137 | 72 |
| 2210 Oakridge Dr | 0.33mi | 3/2.0 | 1,816 (+14%) | 15mo | $219,900 | $121 | 49 |
| 2807 Hendricks St | 0.53mi | 4/2.0 (+1) | 1,427 (-10%) | 9mo | $198,900 | $139 | 46 |
Match score weights: distance 35% · size 25% · config 20% · recency 20%. Top-matched comps best support the ARV.
Projected returns pro-forma
-3.0% appreciation · 3.0% rent growth · sell at horizon
- IRR
- -13.5%
- Equity multiple
- 0.51×
- Total profit
- $-25,862
- Equity at exit
- $28,330
- IRR
- -4.5%
- Equity multiple
- 0.70×
- Total profit
- $-15,835
- Equity at exit
- $16,428
Cash invested: $53,200 (down + closing). Projections, not guarantees.
Landlord ↔ Tenant lean methodology
- Overall (STATE)
- 87 Strongly Landlord-Friendly
- State Texas
- 87 Strongly Landlord-Friendly · R+5
- County
- — inherits STATE
- City
- — inherits STATE
ZIP-level market 75647
- Home prices YoY
- -8.2%
- Active inventory
- 179
- Price-to-rent
- 8.1×
Monthly cashflow live
- Estimated rent
- $1,950 medium interval (Pro) →
- Mortgage (P&I)
- −$996
- Tax from tax record
- −$390 /mo · $4,674/yr
- Insurance
- −$79
- HOA
- −$0
- Vacancy / Maint / Mgmt
- −$410
- Net cashflow
- $75
Break-even live
Sensitivity live
| Price | -10% $183 | -5% $129 | +0% $75 | +5% $22 | +10% $-32 |
|---|---|---|---|---|---|
| Rent | -10% $-79 | -5% $-2 | +0% $75 | +5% $152 | +10% $229 |
| Rate | -1.0pp $171 | -0.5pp $124 | base $75 | +0.5pp $26 | +1.0pp $-24 |
UW: 25.0% down · 7.5% · 30yr · 1.5% tax · 5.0% vac · 8.0% maint · 8.0% mgmt
Financing live
Cash to close
- Down payment
- $47,500
- Closing costs
- $5,700
- Reserves months
- —
- Total cash needed
- —
Loan-product check · same deal, 3 products live
Conventional
25% down · 7.5% · 30yr
- Down + closing
- —
- Monthly P&I
- —
- Monthly cashflow
- —
- DSCR
- —
- Eligible?
- —
Personal DTI + credit; lowest rate.
DSCR
20% down · 8.5% · 30yr
- Down + closing
- —
- Monthly P&I
- —
- Monthly cashflow
- —
- DSCR
- —
- Eligible?
- —
No personal income docs; deal must DSCR.
Hard money
10% down · 12.0% · 12mo
- Down + closing
- —
- Monthly P&I
- —
- Monthly cashflow
- —
- DSCR
- —
- Eligible?
- —
Short-term bridge; refi at stabilization.
Rent comps 2 comps
| Address | Beds | Baths | Sqft | Rent | $/sqft | DOM | Units | Dist |
|---|---|---|---|---|---|---|---|---|
| 502 Jeanette Ave Gladewater, TX | 3.0 | 2.0 | 1385 | $1,950 | $1.41 | 15d | 1 | 1.05mi |
| 109 Lyle St Gladewater, TX | 3.0 | 2.0 | 1385 | $1,950 | $1.41 | 15d | 1 | 1.15mi |
Listing history 11 events
-
2026-05-11price $190,000 434-char remark
Show marketing remark (434 chars)
Great home lying in wait for new ownership. Lots of potential for a starter home with updates to this three-bedroom, two-bath home. Two living areas add appeal with a doorway to an open patio in the wood-fenced backyard. Lots of room for children to roam and also accommodate pets. Seller will leave both living areas with existing furniture, except for the recliner. Will also leave glass-front curio cabinet glass top kitchen table.
-
2026-03-25$198,000 Active 434-char remark
Show marketing remark (434 chars)
Great home lying in wait for new ownership. Lots of potential for a starter home with updates to this three-bedroom, two-bath home. Two living areas add appeal with a doorway to an open patio in the wood-fenced backyard. Lots of room for children to roam and also accommodate pets. Seller will leave both living areas with existing furniture, except for the recliner. Will also leave glass-front curio cabinet glass top kitchen table.
-
2026-03-01price $198,000
-
2026-02-17price $210,000
-
2026-02-17price $185,000
-
2026-01-05price $235,000
-
2025-11-11$249,900 Active
-
2018-04-05soldstatus
-
2016-10-13soldstatus
-
2016-10-11soldstatus
-
2016-07-11$99,900
ⓘ Source: listings_history table (triggers on properties + properties_extension) + one-shot
backfill from property_details.listing_events for pre-trigger history.
Tax reassessment forecast TX · Resets to sale price
- Current annual tax
- $4,674 · $390/mo
- Projected year-2 tax
- $4,674 · $390/mo
- Expected delta
- $0/yr ($0/mo · 0.0%)
ⓘ Screening estimate from a state-policy table — verify with the county assessor before closing.
Climate risk First Street
- Flood 1/10 Low FEMA zone X (unshaded) · 0% chance over 30 yrs
- Wildfire 5/10 Major
- Heat 7/10 Severe 7 d/yr ≥110°F today · 26 d/yr by 30 yrs out
- Wind 6/10 Major 52% chance of damaging wind over 30 yrs
- Air quality 2/10 Low 1 unhealthy d/yr today · 2 by 30 yrs out
Nearby sold comps map
Loading sold comps map…
Walkable amenities ~0.75 mi
Loading nearby amenities…
Taxation est. · year 1
- Rental income
- $23,400
- − Mortgage interest
- −$10,643
- − Property taxes
- −$4,674
- − Insurance
- −$950
- − Repairs & maintenance
- −$1,872
- − Management
- −$1,872
- − Depreciation
- −$5,527
- Taxable loss
- −$2,139
- Est. tax savings @ 24.0%
- +$513
- After-tax cash flow
- $1,418/yr
For passive investors: Depreciation is non-cash, so a rental often shows a tax loss while cash-flowing — sheltering income. Rental losses are passive: they offset passive income freely, and up to $25,000/yr can offset ordinary (W-2) income if you actively participate and your MAGI is under $100k (phasing out to $0 by $150k); unused losses carry forward. On sale, claimed depreciation is recaptured at up to 25%, and gains may owe capital-gains tax (a 1031 exchange can defer both). Figures are a year-1 estimate at your 24.0% rate — not tax advice; consult a CPA.
Schools (NCES district)
- District
- Gladewater ISD
- NCES district ID
- 4820760
- Math proficiency
- 29% ▼ -12.00%
- Reading proficiency
- 34% ▼ -1.00%
- Median HH income
- $41,485
- Composite
- 26.62/100
- National rank
- #7177
- State rank
- #594 of 826 in TX
Livability — Gladewater
- Score
- 64/100
- State rank
- #805
- US rank
- #14670
Category grades
Schools grade is shown separately in the Schools card above.
Census & demographics
- Census place
- Gladewater, TX
- Population (ZIP)
- 13,457
Population outlook (Upshur County) Hauer SSP2
- Today (2025)
- 42,771 people
- By 2030
- 43,788 · +2.4%
- By 2040
- 45,574 · +6.6%
- By 2050
- 46,683 · +9.1%
- By 2075
- 49,137 · +14.9%
- By 2100
- 47,457 · +11.0%
Race, ethnicity, and origin ACS 2023
- Neighborhood character
- Predominantly White (73%)
- Race & ethnicity
- White 73% Black 12% Hispanic / Latino 9% Two or more races 8%
- Hispanic origin (detail)
- Mexican 8%
- Common ancestry
- Serbian 3% Slovak 2% Italian 2%
- Foreign-born
- 3% · Canada
- Languages at home
- 96% English-only · Spanish 4%
Political lean MEDSL · Upshur
- 2024 margin
- Solid R (+71.0) · D 14.2% · R 85.2%
- 2008→2024 swing
- -22.0pp toward R · 2008: -49.0pp · 2024: -71.0pp
- All cycles
- 2024: R+71.0 2020: R+68.5 2016: R+68.0 2012: R+59.8 2008: R+49.0
Not yet ingested
- Civics
- —
Market trends
- HPI YoY
- ▼ -27.12%
- Current HPI
- 303.1316
- Rent YoY
- —
- Metro
- —
- State GDP YoY
- ▲ 3.95%
- F500 in state
- 110
Industry mix (Fortune 500 HQ in TX)
| Industry | F500 HQs | Revenue |
|---|---|---|
| Energy | 16 | $1,198B |
|
||
| Technology | 5 | $198B |
|
||
| Engineering / Construction | 4 | $72B |
|
||
| Energy Services | 3 | $60B |
|
||
| Utilities | 3 | $41B |
|
||
| Healthcare | 2 | $330B |
|
||
Price history
+90.2% since first listed11 events — show timeline
- 2026-05-11 Price Changed $190,000 LAAR
- 2026-03-25 Listed $198,000 LAAR
- 2026-03-01 Price Changed $198,000 LAAR
- 2026-02-17 Price Changed $210,000 LAAR
- 2026-02-17 Price Changed $185,000 LAAR
- 2026-01-05 Price Changed $235,000 LAAR
- 2025-11-11 Listed $249,900 LAAR
- 2018-04-05 Sold (Public Records) — Public Records
- 2016-10-13 Sold (Public Records) — Public Records
- 2016-10-11 Sold (MLS) — LAAR
- 2016-07-11 Listed $99,900 LAAR
Property tax history
+4.8%/yrLatest (2025): $4,674 · -0.2% YoY. Source: county tax records.
Cash-flow waterfall
monthlySold comps — $/sqft
last 12 mo · ≤1 miLoading sold comps…