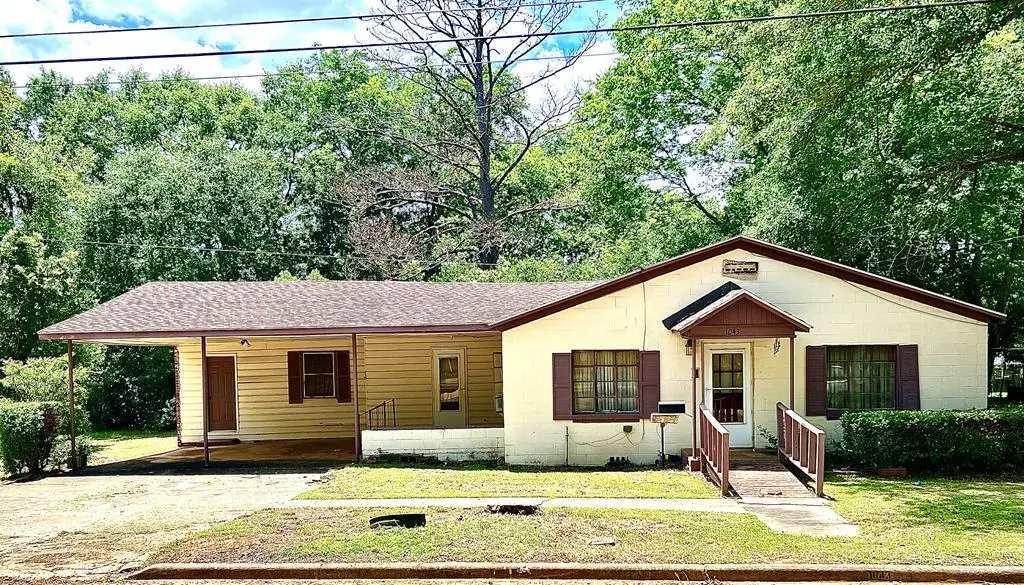
1043 NE Flint St · Dawson, GA
Flood risk 1/10 · Minimal
- FEMA flood zone
- X (unshaded)
- Chance of flooding over 30 yrs
- 0.0%
- Est. flood insurance / yr
- $473 – $860
Fire risk 3/10 · Minor
- Est. fire insurance / yr
- $963 – $1,789
Heat risk 7/10 · Major
- Hot days now (above 108°F)
- 7 days/yr
- Hot days in 30 yrs
- 19 days/yr
Wind risk 8/10 · Major
- Chance of severe wind over 30 yrs
- 80.0%
Air-quality risk 2/10 · Minimal
- Unhealthy air days now
- 1 days/yr
- Unhealthy air days in 30 yrs
- 2 days/yr
Risk factors via First Street. Map © Google.
Why this score? — see what drove the B grade
The composite is a weighted blend of 9 inputs, each scored 0–100. Each bar is that input's sub-score; the figure is the points it added to the 100-point composite (weight × sub-score).
- Cash flow +30.0/30.0
- 1% rule +10.0/10.0
- DSCR +10.0/10.0
- ARV discount +7.5/15.0
- Appreciation +5.8/10.0
- Livability +2.8/5.0
- Rent growth +2.5/5.0
- Condition / age +2.5/5.0
- Schools +0.8/10.0
$68,500
🖨 Deal sheet 📄 Offer letter ✓ Due diligence
Listing remarks
INVESTOR OPPORTUNITY!!!! This 3-bedroom, 2-bathroom home offers excellent potential for renovation and value-add improvements. Situated on a spacious lot with plenty of room for landscaping, gardening, or outdoor living, this property is located in a quiet, peaceful neighborhood. This home is ideal for investors, flippers, or buyers looking to customize a property to their vision.
Key facts
- Spacious lot
- 1 acre lot
- Listed 10 days
Tags
Property features AI
Exterior
- Utilities: Public water; Public sewer
- Home design: Single-family residence; Residential property
- Construction: Brick construction
- Exterior features: Approximately 1 acre lot
Interior
- Bathrooms: 2 full bathrooms
- Heating & cooling: Central cooling with ceiling fans
- Interior features: Ceiling fans
Neighborhood map
What this means for you Summary
Snapshot
- This is a 3-bed/2.0-bath single-family listed at $68k.
Deal economics
- At list price, monthly cash flow is $691 ($8k/yr) — positive.
- The deal already cash-flows at list — no discount required.
- Meets the 1% rule at list price ($1k rent vs $68k).
Location & tenants
- Location reads 55/100 on livability (#508 in GA) — a working-class tenant base; expect higher turnover. Strengths: cost of living A+, housing A-; Watch: crime D+, schools F, amenities F.
- Terrell County (rural): math 7% / reading 13% proficiency, ranked #167 of 174 in GA (top 96%) — low school quality limits family demand, transient renter base, plan for 1-2y turnover; 79% free/reduced lunch — lower-income household profile, screen leases tightly.
- Market conditions: 35 active listings in the ZIP; 2 comparable units currently listed for rent nearby; 2 units permitted in Terrell County in 2024 (0 in 5+ unit buildings).
Forward outlook
- In year one you build about $2k of equity ($474 loan paydown + $1k appreciation (1.6% local appreciation)).
- Terrell County population projected at -33% by 2050 — secular population decline; favor cash flow + early exit over multi-decade hold.
- At projected returns (1.6% appreciation + 3.0% rent growth), your $19k cash investment doubles in ~2 years — after that, you're playing with house money.
Negotiation context
- Only 11 days on market — expect competitive offers; lowballing is unlikely to land.
Risks & watch-outs
- Watch-outs: built in 1950 — expect roof / HVAC / electrical / plumbing capex.
- Climate carrying-cost: severe wind risk, 80% chance of damaging wind over 30y; extreme-heat days projected 7→19/yr by 2055 (HVAC capex compounding) — expect insurance premiums to compound above CPI over the hold.
Questions for the listing agent
- Built in 1950 — when were the roof, HVAC, electrical panel, plumbing, and water heater last replaced?
- Is there a deadline driving the sale (1031 exchange, divorce, estate, relocation)? That informs how much negotiation room exists.
- Schools are F-rated, which usually means shorter tenancies and higher turnover. Who's the typical renter profile here, and what's been the actual vacancy rate?
- Crime grade is D in this area — have there been break-ins, vandalism, or insurance claims at this property in the last 3 years? What carrier currently insures it and at what premium?
- What's the average days-on-market for RENTAL listings here right now (not sales)? A rising rental-DOM trend means longer vacancies and softer asking-rent achievability than the comps imply.
- What's the recent tenant-quality profile in this submarket — average credit score on applications, eviction rate, late-payment / NSF rate, and stable-employment percentage? A property-management company in the area should have these aggregated.
- How much new for-sale + rental construction is in the pipeline within 1–3 miles? Heavy new supply typically softens prices + rents 12–24 months out; constrained supply supports both.
Investment metrics
- 1% rule
- 2.09% ✓
- Cap rate
- 18.40%
- Cash-on-cash
- 43.23%
- DSCR
- 2.92
- GRM
- 4.0
CMA / ARV
- ARV (on-the-fly)
- $14,280
- Comps found
- 1
Show comp detail 1 sale within ~0.75 mi
| Address | Dist | Beds/Ba | Sqft | Sold | Price | $/sf | Match |
|---|---|---|---|---|---|---|---|
| 149 Porter Aly | 0.43mi | 2/2.0 (-1) | 1,360 (-5%) | 15mo | $14,000 | $10 | 55 |
Match score weights: distance 35% · size 25% · config 20% · recency 20%. Top-matched comps best support the ARV.
Projected returns pro-forma
1.56% appreciation · 3.0% rent growth · sell at horizon
- IRR
- 46.6%
- Equity multiple
- 3.46×
- Total profit
- $47,203
- Equity at exit
- $25,419
- IRR
- 47.8%
- Equity multiple
- 6.89×
- Total profit
- $113,051
- Equity at exit
- $35,413
Cash invested: $19,180 (down + closing). Projections, not guarantees.
Landlord ↔ Tenant lean methodology
- Overall (STATE)
- 90 Strongly Landlord-Friendly
- State Georgia
- 90 Strongly Landlord-Friendly · R+3
- County
- — inherits STATE
- City
- — inherits STATE
ZIP-level market 39842
- Home prices YoY
- 0.8%
- Active inventory
- 35
- Price-to-rent
- 4.0×
Monthly cashflow live
- Estimated rent
- $1,432 medium interval (Pro) →
- Mortgage (P&I)
- −$359
- Tax from tax record
- −$52 /mo · $626/yr
- Insurance
- −$29
- HOA
- −$0
- Vacancy / Maint / Mgmt
- −$301
- Net cashflow
- $691
Break-even live
UW: 25.0% down · 7.5% · 30yr · 1.5% tax · 5.0% vac · 8.0% maint · 8.0% mgmt
Financing live
Cash to close
- Down payment
- $17,125
- Closing costs
- $2,055
- Reserves months
- —
- Total cash needed
- —
Loan-product check · same deal, 3 products live
Conventional
25% down · 7.5% · 30yr
- Down + closing
- —
- Monthly P&I
- —
- Monthly cashflow
- —
- DSCR
- —
- Eligible?
- —
Personal DTI + credit; lowest rate.
DSCR
20% down · 8.5% · 30yr
- Down + closing
- —
- Monthly P&I
- —
- Monthly cashflow
- —
- DSCR
- —
- Eligible?
- —
No personal income docs; deal must DSCR.
Hard money
10% down · 12.0% · 12mo
- Down + closing
- —
- Monthly P&I
- —
- Monthly cashflow
- —
- DSCR
- —
- Eligible?
- —
Short-term bridge; refi at stabilization.
Rent comps 2 comps
| Address | Beds | Baths | Sqft | Rent | $/sqft | DOM | Units | Dist |
|---|---|---|---|---|---|---|---|---|
| 1239 Askew Dr NE Dawson, GA | 3.0 | 2.0 | 1204 | $1,500 | $1.25 | 21d | 1 | 0.48mi |
| 1404 Georgia Ave SE Dawson, GA | 3.0 | 2.0 | 1310 | $1,235 | $0.94 | 43d | 1 | 1.50mi |
Listing history 10 events
-
2026-06-19days on market $68,500 Active 11 DOM
-
2026-06-18days on market $68,500 Active 10 DOM
-
2026-06-17days on market $68,500 Active 9 DOM
-
2026-06-16days on market $68,500 Active 8 DOM
-
2026-06-15days on market $68,500 Active 7 DOM
-
2026-06-14days on market $68,500 Active 5 DOM
-
2026-06-13days on market $68,500 Active 4 DOM
-
2026-06-10days on market $68,500 Active 2 DOM
-
2026-06-09remarks 383-char remark
-
2026-06-09$68,500 Active 1 DOM
ⓘ Source: listings_history table (triggers on properties + properties_extension) + one-shot
backfill from property_details.listing_events for pre-trigger history.
Tax reassessment forecast GA · Resets to sale price
- Current annual tax
- $626 · $52/mo
- Projected year-2 tax
- $630 · $53/mo
- Expected delta
- +$4/yr ($0/mo · 0.6%)
ⓘ Screening estimate from a state-policy table — verify with the county assessor before closing.
Climate risk First Street
- Flood 1/10 Low FEMA zone X (unshaded) · 0% chance over 30 yrs
- Wildfire 3/10 Moderate
- Heat 7/10 Severe 7 d/yr ≥108°F today · 19 d/yr by 30 yrs out
- Wind 8/10 Severe 80% chance of damaging wind over 30 yrs
- Air quality 2/10 Low 1 unhealthy d/yr today · 2 by 30 yrs out
Nearby sold comps map
Loading sold comps map…
Walkable amenities ~0.75 mi
Loading nearby amenities…
Taxation est. · year 1
- Rental income
- $17,179
- − Mortgage interest
- −$3,837
- − Property taxes
- −$626
- − Insurance
- −$342
- − Repairs & maintenance
- −$1,374
- − Management
- −$1,374
- − Depreciation
- −$1,993
- Taxable income
- $7,632
- Est. tax owed @ 24.0%
- −$1,832
- After-tax cash flow
- $6,460/yr
For passive investors: Depreciation is non-cash, so a rental often shows a tax loss while cash-flowing — sheltering income. Rental losses are passive: they offset passive income freely, and up to $25,000/yr can offset ordinary (W-2) income if you actively participate and your MAGI is under $100k (phasing out to $0 by $150k); unused losses carry forward. On sale, claimed depreciation is recaptured at up to 25%, and gains may owe capital-gains tax (a 1031 exchange can defer both). Figures are a year-1 estimate at your 24.0% rate — not tax advice; consult a CPA.
Schools (NCES district)
- District
- Terrell County
- NCES district ID
- 1304860
- Math proficiency
- 7% ▼ -14.00%
- Reading proficiency
- 13% ▼ -9.00%
- Median HH income
- $31,887
- Composite
- 7.87/100
- National rank
- #9928
- State rank
- #167 of 174 in GA
Livability — Dawson
- Score
- 55/100
- State rank
- #508
- US rank
- #23135
Category grades
Schools grade is shown separately in the Schools card above.
Census & demographics
- Census place
- Dawson, GA
- Population (ZIP)
- 7,780
Population outlook (Terrell County) Hauer SSP2
- Today (2025)
- 8,041 people
- By 2030
- 7,444 · -7.4%
- By 2040
- 6,339 · -21.2%
- By 2050
- 5,415 · -32.7%
- By 2075
- 4,220 · -47.5%
- By 2100
- 3,750 · -53.4%
Race, ethnicity, and origin ACS 2023
- Neighborhood character
- Majority Black (64%)
- Race & ethnicity
- Black 64% White 33% Hispanic / Latino 2%
- Common ancestry
- Serbian 1% Lithuanian 1% Italian 1%
- Foreign-born
- 1% · Canada
- Languages at home
- 97% English-only · Spanish 3%
Political lean MEDSL · Terrell
- 2024 margin
- Toss-up / Even · D 51.9% · R 47.8%
- 2008→2024 swing
- -9.7pp toward R · 2008: 13.8pp · 2024: 4.1pp
- All cycles
- 2024: D+4.1 2020: D+8.4 2016: D+9.4 2012: D+16.1 2008: D+13.8
Not yet ingested
- Civics
- —
Market trends
- HPI YoY
- ▲ 1.56%
- Current HPI
- 190.252
- Rent YoY
- —
- Metro
- —
- State GDP YoY
- ▲ 2.66%
- F500 in state
- 28
Industry mix (Fortune 500 HQ in GA)
| Industry | F500 HQs | Revenue |
|---|---|---|
| Paper / Packaging | 2 | $29B |
|
||
| Retail | 1 | $160B |
|
||
| Transportation / Logistics | 1 | $91B |
|
||
| Airlines | 1 | $62B |
|
||
| Consumer Goods | 1 | $47B |
|
||
| Utilities | 1 | $25B |
|
||
Price history
1 event — show timeline
- 2026-06-08 Listed $68,500 CBOR
Property tax history
+1.3%/yrLatest (2025): $626 · -0.1% YoY. Source: county tax records.
Cash-flow waterfall
monthlySold comps — $/sqft
last 12 mo · ≤1 miLoading sold comps…