138 Mimosa Dr · Edmund, SC
Flood risk 1/10 · Minimal
- FEMA flood zone
- X (unshaded)
- Chance of flooding over 30 yrs
- 0.0%
- Est. flood insurance / yr
- $507 – $1,088
Fire risk 6/10 · Moderate
- Est. fire insurance / yr
- $783 – $1,453
Heat risk 6/10 · Moderate
- Hot days now (above 107°F)
- 7 days/yr
- Hot days in 30 yrs
- 16 days/yr
Wind risk 6/10 · Moderate
- Chance of severe wind over 30 yrs
- 68.0%
Air-quality risk 3/10 · Minor
- Unhealthy air days now
- 2 days/yr
- Unhealthy air days in 30 yrs
- 2 days/yr
Risk factors via First Street. Map © Google.
Why this score? — see what drove the D+ grade
The composite is a weighted blend of 9 inputs, each scored 0–100. Each bar is that input's sub-score; the figure is the points it added to the 100-point composite (weight × sub-score).
- Cash flow +20.6/30.0
- ARV discount +7.5/15.0
- DSCR +6.5/10.0
- 1% rule +5.4/10.0
- Rent growth +2.5/5.0
- Livability +2.5/5.0
- Condition / age +2.2/5.0
- Schools +1.6/10.0
- Appreciation +0.9/10.0
$134,900
🖨 Deal sheet 📄 Offer letter ✓ Due diligence
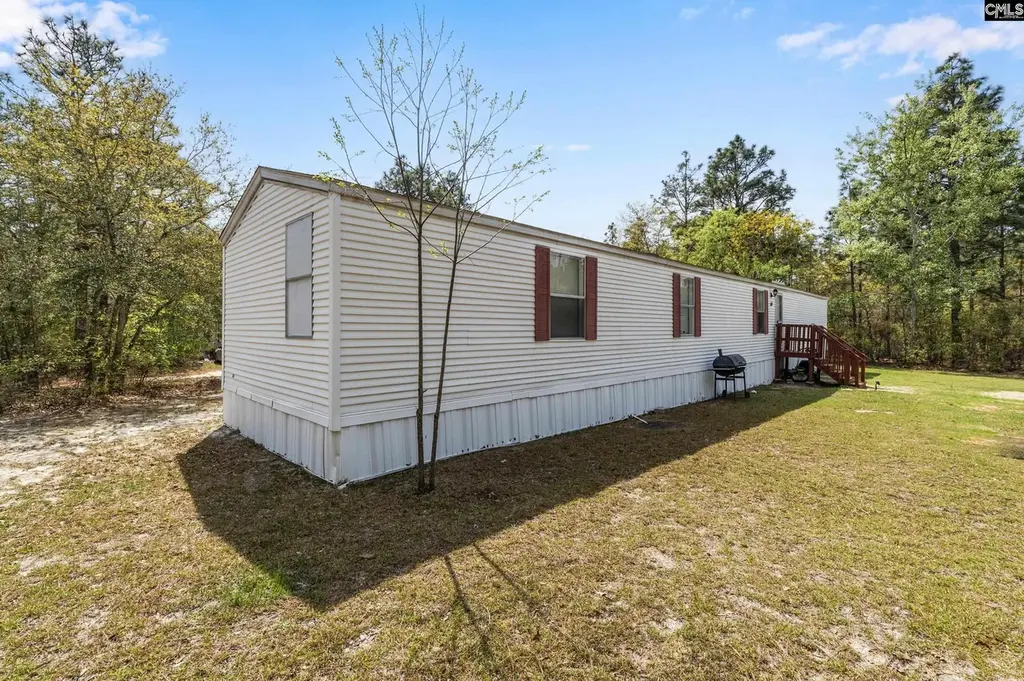
Listing remarks
Are you looking for a place to call home or a rental investment? This home features 3 bedrooms and 2 full baths located on 1.49 acres with open floor plan. Home offers spacious master bedroom with new LVP flooring and large kitchen. Seller has just installed new underpinning, front storm door and back porch. Call for appointment. Disclaimer: CMLS has not reviewed and, therefore, does not endorse vendors who may appear in listings.
Key facts
- 1.49 acre lot
- Built 1999
- Listed 75 days
Property features AI
Finance
- Other: 1.49-acre parcel; Dirt road access
Exterior
- Utilities: Public water; Septic sewer
- Home design: Single-story residence; Main-level primary living areas
- Construction: Crawlspace foundation
- Exterior features: Vinyl exterior
Interior
- Kitchen: Free-standing range; Dishwasher
- Bedrooms: Master bedroom on main level with private bath and walk-in closet; Second bedroom on main level with shared bath and private closet; Third bedroom on main level with private bath and private closet
- Bathrooms: Two full bathrooms
- Heating & cooling: Central cooling; Electric heating
- Interior features: Ceiling fan in living room; Heated laundry space; Dishwasher; Free-standing range
- Laundry & utility: Laundry in heated space
Neighborhood map
What this means for you Summary
Snapshot
- This is a 3-bed/2.0-bath manufactured listed at $135k. Condition is rated fair.
Deal economics
- At list price, monthly cash flow is $179 ($2k/yr) — positive.
- The deal already cash-flows at list — no discount required.
- Meets the 1% rule at list price ($1k rent vs $135k).
- Recommended offer: $127k (6.0% below list) — sets the bar for market timing.
Location & tenants
- Location reads: area grade D — affects rentability + tenant quality, not the cash-flow math above.
- Lexington 04 (rural): math 14% / reading 25% proficiency, ranked #70 of 80 in SC (top 88%) — low school quality limits family demand, transient renter base, plan for 1-2y turnover; 69% free/reduced lunch — lower-income household profile, screen leases tightly.
- Zoned schools: Sandhills Primary (506 students, 100% FRL); Swansea High (math 10% / reading 72%, grade F, #177 of 196 statewide, top 91%, 683 students, 100% FRL) — zoned schools average 100% FRL vs 69% district-wide (31 pts higher); higher-poverty schools than district average — tighter screening recommended.
- Zoned-school proficiency averages 41% at this address vs 20% district-wide (+22 pts) — the actual schools serving this property are materially stronger than the Lexington 04 average implies; a family-tenant draw the district grade alone would hide.
- Market conditions: 137 active listings in the ZIP; 1,712 units permitted in Lexington County in 2024 (0 in 5+ unit buildings).
Forward outlook
- Local home prices are declining (-3.0%/yr); year-one equity from $933 of loan paydown is wiped out by about $4k of value loss. Plan a longer hold.
- Lexington County population projected at +26% by 2050 — long-run rental-demand tailwind backs the buy-and-hold thesis.
Negotiation context
- It's been on market 75 days — a 6% lower offer ($127k) is reasonable based on typical stale-listing flexibility.
Risks & watch-outs
- Climate carrying-cost: major wind risk, 68% chance of damaging wind over 30y; major wildfire risk; extreme-heat days projected 7→16/yr by 2055 (HVAC capex compounding) — expect insurance premiums to compound above CPI over the hold.
Questions for the listing agent
- It's been on market 75 days. Have you received any prior offers? Is the seller open to a 6% concession, seller financing, or rate buy-down credit?
- Have any recent inspections been done? Can we get a copy of the seller's disclosures and any deferred-maintenance estimates?
- Why hasn't it sold? Are there any deal-killer items the seller is aware of (foundation, flood, title, zoning, code violations)?
- Is there a deadline driving the sale (1031 exchange, divorce, estate, relocation)? That informs how much negotiation room exists.
- The area grade is low — what's the realistic commute time and amenity access for the typical tenant pool here? Any planned neighborhood developments (good or bad) we should know about?
- What's the average days-on-market for RENTAL listings here right now (not sales)? A rising rental-DOM trend means longer vacancies and softer asking-rent achievability than the comps imply.
- What's the recent tenant-quality profile in this submarket — average credit score on applications, eviction rate, late-payment / NSF rate, and stable-employment percentage? A property-management company in the area should have these aggregated.
- How much new for-sale + rental construction is in the pipeline within 1–3 miles? Heavy new supply typically softens prices + rents 12–24 months out; constrained supply supports both.
Investment metrics
- 1% rule
- 1.04% ✓
- Cap rate
- 7.89%
- Cash-on-cash
- 5.69%
- DSCR
- 1.25
- GRM
- 8.0
CMA / ARV
No comps found within radius.
Projected returns pro-forma
-3.0% appreciation · 3.0% rent growth · sell at horizon
- IRR
- -7.5%
- Equity multiple
- 0.72×
- Total profit
- $-10,435
- Equity at exit
- $20,114
- IRR
- 2.1%
- Equity multiple
- 1.15×
- Total profit
- $5,682
- Equity at exit
- $11,664
Cash invested: $37,772 (down + closing). Projections, not guarantees.
Landlord ↔ Tenant lean methodology
- Overall (STATE)
- 90 Strongly Landlord-Friendly
- State South Carolina
- 90 Strongly Landlord-Friendly · R+6
- County
- — inherits STATE
- City
- — inherits STATE
ZIP-level market 29053
- Home prices YoY
- -2.9%
- Active inventory
- 137
- Price-to-rent
- 8.0×
Monthly cashflow live
- Estimated rent
- $1,407 medium interval (Pro) →
- Mortgage (P&I)
- −$707
- Tax est. 1.5%
- −$169 /mo · $2,024/yr
- Insurance
- −$56
- HOA
- −$0
- Vacancy / Maint / Mgmt
- −$295
- Net cashflow
- $179
Break-even live
UW: 25.0% down · 7.5% · 30yr · 1.5% tax · 5.0% vac · 8.0% maint · 8.0% mgmt
Financing live
Cash to close
- Down payment
- $33,725
- Closing costs
- $4,047
- Reserves months
- —
- Total cash needed
- —
Loan-product check · same deal, 3 products live
Conventional
25% down · 7.5% · 30yr
- Down + closing
- —
- Monthly P&I
- —
- Monthly cashflow
- —
- DSCR
- —
- Eligible?
- —
Personal DTI + credit; lowest rate.
DSCR
20% down · 8.5% · 30yr
- Down + closing
- —
- Monthly P&I
- —
- Monthly cashflow
- —
- DSCR
- —
- Eligible?
- —
No personal income docs; deal must DSCR.
Hard money
10% down · 12.0% · 12mo
- Down + closing
- —
- Monthly P&I
- —
- Monthly cashflow
- —
- DSCR
- —
- Eligible?
- —
Short-term bridge; refi at stabilization.
Listing history 18 events
-
2026-06-18days on market $134,900 Active 75 DOM
-
2026-06-17days on market $134,900 Active 74 DOM
-
2026-06-16days on market $134,900 Active 73 DOM
-
2026-06-15days on market $134,900 Active 72 DOM
-
2026-06-14days on market $134,900 Active 70 DOM
-
2026-06-13days on market $134,900 Active 69 DOM
-
2026-06-10days on market $134,900 Active 67 DOM
-
2026-06-09days on market $134,900 Active 66 DOM
-
2026-06-09remarks 435-char remark
-
2026-06-08days on market $134,900 Active 65 DOM
-
2026-06-07days on market $134,900 Active 64 DOM
-
2026-06-05days on market $134,900 Active 61 DOM
-
2026-06-03days on market $134,900 Active 60 DOM
-
2026-06-03days on market $134,900 Active 59 DOM
-
2026-06-01days on market $134,900 Active 58 DOM
-
2026-05-31days on market $134,900 Active 57 DOM
-
2026-05-08price $134,900
-
2026-04-04$137,500 Active
ⓘ Source: listings_history table (triggers on properties + properties_extension) + one-shot
backfill from property_details.listing_events for pre-trigger history.
Climate risk First Street
- Flood 1/10 Low FEMA zone X (unshaded) · 0% chance over 30 yrs
- Wildfire 6/10 Major
- Heat 6/10 Major 7 d/yr ≥107°F today · 16 d/yr by 30 yrs out
- Wind 6/10 Major 68% chance of damaging wind over 30 yrs
- Air quality 3/10 Moderate 2 unhealthy d/yr today · 2 by 30 yrs out
Nearby sold comps map
Loading sold comps map…
Walkable amenities ~0.75 mi
Loading nearby amenities…
Taxation est. · year 1
- Rental income
- $16,881
- − Mortgage interest
- −$7,556
- − Property taxes
- −$2,024
- − Insurance
- −$674
- − Repairs & maintenance
- −$1,350
- − Management
- −$1,350
- − Depreciation
- −$3,924
- Taxable income
- $1
- Est. tax owed @ 24.0%
- −$0
- After-tax cash flow
- $2,148/yr
For passive investors: Depreciation is non-cash, so a rental often shows a tax loss while cash-flowing — sheltering income. Rental losses are passive: they offset passive income freely, and up to $25,000/yr can offset ordinary (W-2) income if you actively participate and your MAGI is under $100k (phasing out to $0 by $150k); unused losses carry forward. On sale, claimed depreciation is recaptured at up to 25%, and gains may owe capital-gains tax (a 1031 exchange can defer both). Figures are a year-1 estimate at your 24.0% rate — not tax advice; consult a CPA.
Condition & rehab AI · 13 photos
This mobile home has a fair condition with cosmetic updates needed to enhance its curb appeal and interior aesthetics, making it a good rental investment.
Repairs flagged
- Minor Paint — Chipped paint on interior walls.
- Minor Flooring — Hardwood floors may need refinishing for a fresh look.
Value-add opportunities
- Both Painting and updating fixtures in bathrooms — Enhances curb appeal and interior aesthetics.
- Both Floor refinishing — Improves the home's appearance and value.
- Both Painting interior walls — Enhances the home's appearance and value.
- Both Updating kitchen appliances — Modernizes the space and improves functionality.
Renovation cost estimate screening
| Repair item | Severity | Est. cost |
|---|---|---|
| Paint · Chipped paint on interior walls. | Minor | $500–3,000 |
| Flooring · Hardwood floors may need refinishing for a fresh look. | Minor | $500–3,000 |
| Total estimated repair cost · 2 items | $1,000–6,000 |
Value-add ROI direction
- Both Painting and updating fixtures in bathrooms — Enhances curb appeal and interior aesthetics. ↑
- Both Floor refinishing — Improves the home's appearance and value. ↑
- Both Painting interior walls — Enhances the home's appearance and value. ↑
- Both Updating kitchen appliances — Modernizes the space and improves functionality. ↑
ⓘ Cost ranges are severity-bucket heuristics (US national rule-of-thumb). Get contractor quotes + a written scope before underwriting a rehab budget.
Schools (NCES district)
- District
- Lexington 04
- NCES district ID
- 4502790
- Math proficiency
- 14% ▼ -2.00%
- Reading proficiency
- 25% ▼ -1.00%
- Median HH income
- $38,722
- Composite
- 16.38/100
- National rank
- #9198
- State rank
- #70 of 80 in SC
Livability — Edmund
No livability data for this city. (Only ~50 U.S. cities are tracked.)
Census & demographics
- Population (ZIP)
- 20,818
Population outlook (Lexington County) Hauer SSP2
- Today (2025)
- 322,999 people
- By 2030
- 342,356 · +6.0%
- By 2040
- 377,715 · +16.9%
- By 2050
- 406,984 · +26.0%
- By 2075
- 465,447 · +44.1%
- By 2100
- 485,674 · +50.4%
Race, ethnicity, and origin ACS 2023
- Neighborhood character
- Diverse neighborhood (Simpson 0.63)
- Race & ethnicity
- White 53% Black 21% Hispanic / Latino 21% Two or more races 11%
- Hispanic origin (detail)
- Mexican 14% Puerto Rican 3%
- Common ancestry
- Slovak 2% Serbian 2% Lithuanian 1%
- Foreign-born
- 9% · Canada, Dominican Republic
- Languages at home
- 81% English-only · Spanish 18%
Political lean MEDSL · Lexington
- 2024 margin
- Solid R (+33.5) · D 32.5% · R 66.0% · Other 1.4%
- 2008→2024 swing
- +4.6pp toward D · 2008: -38.0pp · 2024: -33.5pp
- All cycles
- 2024: R+33.5 2020: R+30.1 2016: R+36.7 2012: R+37.8 2008: R+38.0
Not yet ingested
- Civics
- —
Market trends
- HPI YoY
- ▼ -8.19%
- Current HPI
- 272.1711
- Rent YoY
- —
- Metro
- —
- State GDP YoY
- ▲ 4.51%
- F500 in state
- 2
Industry mix (Fortune 500 HQ in SC)
| Industry | F500 HQs | Revenue |
|---|---|---|
| Packaging | 1 | $7B |
|
||
Price history
-1.9% since first listed2 events — show timeline
- 2026-05-08 Price Changed $134,900 Consolidated MLS
- 2026-04-04 Listed $137,500 Consolidated MLS
Cash-flow waterfall
monthlySold comps — $/sqft
last 12 mo · ≤1 miLoading sold comps…