221 Phillips Ln · Junction City, KY
Flood risk No data
- FEMA flood zone
- —
- Chance of flooding over 30 yrs
- —
- Est. flood insurance / yr
- —
Fire risk No data
- Est. fire insurance / yr
- —
Heat risk No data
- Hot days now (above threshold)
- —
- Hot days in 30 yrs
- —
Wind risk No data
- Chance of severe wind over 30 yrs
- —
Air-quality risk No data
- Unhealthy air days now
- —
- Unhealthy air days in 30 yrs
- —
Risk factors via First Street. Map © Google.
Why this score? — see what drove the B grade
The composite is a weighted blend of 9 inputs, each scored 0–100. Each bar is that input's sub-score; the figure is the points it added to the 100-point composite (weight × sub-score).
- Cash flow +25.7/30.0
- Appreciation +10.0/10.0
- DSCR +8.5/10.0
- ARV discount +7.5/15.0
- 1% rule +6.8/10.0
- Schools +4.5/10.0
- Livability +3.1/5.0
- Rent growth +2.5/5.0
- Condition / age +2.5/5.0
$129,900
🖨 Deal sheet 📄 Offer letter ✓ Due diligence
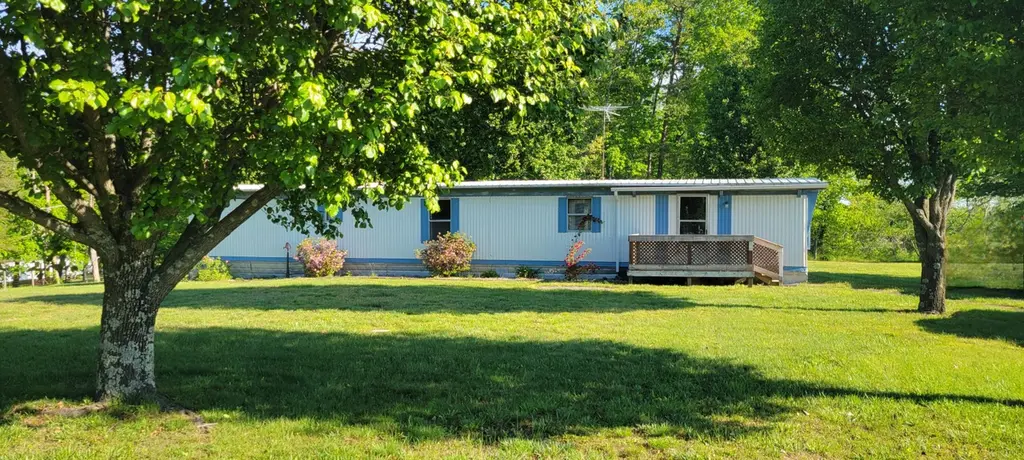
Listing remarks
Affordable country living on a full acre! This property features a fenced lot, two storage buildings, and a home tucked away on a quiet dead-end road. Inside, you'll find updated vinyl plank flooring in the kitchen and bathroom. With a little vison, this could be the perfect starter, rental, or investment opportunity.
Key facts
- Storage buildings
- Quiet dead-end road
- Fenced lot
Tags
Property features AI
Finance
- Other: Lot size 1.0 acre (per public records); Parcel number 037-000-129
Exterior
- Parking: Driveway
- Utilities: Public water; Septic tank; Electricity connected; Natural gas connected
- Home design: Manufactured house; Rural subdivision
- Construction: Aluminum siding; Metal roof; Pillar/Post/Pier foundation; Built area approximately 924
- Exterior features: Shed(s); Fenced (other)
Interior
- Kitchen: Includes refrigerator and range
- Bedrooms: 2 total rooms
- Flooring: Carpet; Vinyl
- Bathrooms: 1 full bathroom
- Heating & cooling: Heat pump and natural gas heating; Central air; Heat pump cooling
- Interior features: Refrigerator; Range; Electric dryer hookup; Washer hookup
- Laundry & utility: Washer hookup; Electric dryer hookup
Neighborhood map
What this means for you Summary
Snapshot
- This is a 2-bed/1.0-bath other listed at $130k.
Deal economics
- At list price, monthly cash flow is $310 ($4k/yr) — positive.
- The deal already cash-flows at list — no discount required.
- Meets the 1% rule at list price ($2k rent vs $130k).
- Recommended offer: $126k (3.0% below list) — sets the bar for market timing.
- Cap rate 9.2% vs local median 2.2% in Junction City — top-decile yield for the area; either an underpriced asset or a hidden risk that comps aren't pricing in. Stress-test before assuming the spread holds.
Location & tenants
- Location reads 62/100 on livability (#344 in KY) — a middle-class / working-renter tenant base. Strengths: crime A+, cost of living A+, housing A+; Watch: health & safety D+, amenities F, commute F.
- Boyle County (town): math 49% / reading 57% proficiency, ranked #7 of 165 in KY (top 4%) — acceptable for families but not a draw, mixed tenant base, ~2y average lease.
- Zoned schools: Junction City Elementary School (math 37% / reading 47%, grade F, #178 of 676 statewide, top 29%, 420 students, 63% FRL); Boyle County Middle School (math 52% / reading 58%, grade B-, #9 of 217 statewide, top 5%, 679 students, 50% FRL); Boyle County High School (math 42% / reading 57%, grade D, #13 of 254 statewide, top 5%, 884 students, 45% FRL) — zoned schools average 53% FRL vs 38% district-wide (15 pts higher); higher-poverty schools than district average — tighter screening recommended.
- Market conditions: 15 active listings in the ZIP; 85 units permitted in Boyle County in 2024 (0 in 5+ unit buildings).
Forward outlook
- In year one you build about $14k of equity ($898 loan paydown + $13k appreciation (10.0% local appreciation)).
- Boyle County population projected at +13% by 2050 — modest demand growth; plan on rents tracking national, not racing it.
- At projected returns (10.0% appreciation + 3.0% rent growth), your $36k cash investment doubles in ~2 years — after that, you're playing with house money.
- By year 3, paydown + projected appreciation supports a ~$35k cash-out refi (75% LTV) — recoverable capital for the next deal without selling this one.
Negotiation context
- It's been on market 49 days — a 3% lower offer ($126k) is reasonable based on typical stale-listing flexibility.
- Current owner paid $10k; list at $130k implies a 1199% gain — meaningful room to come down on a strong offer.
Questions for the listing agent
- It's been on market 49 days. Have you received any prior offers? Is the seller open to a 3% concession, seller financing, or rate buy-down credit?
- Is there a deadline driving the sale (1031 exchange, divorce, estate, relocation)? That informs how much negotiation room exists.
- Schools are B-rated — typically a magnet for longer-tenancy family renters. What's the average tenant stay here, and is there a school-zone premium baked into asking?
- What's the average days-on-market for RENTAL listings here right now (not sales)? A rising rental-DOM trend means longer vacancies and softer asking-rent achievability than the comps imply.
- What's the recent tenant-quality profile in this submarket — average credit score on applications, eviction rate, late-payment / NSF rate, and stable-employment percentage? A property-management company in the area should have these aggregated.
- How much new for-sale + rental construction is in the pipeline within 1–3 miles? Heavy new supply typically softens prices + rents 12–24 months out; constrained supply supports both.
Investment metrics
- 1% rule
- 1.18% ✓
- Cap rate
- 9.15%
- Cash-on-cash
- 10.21%
- DSCR
- 1.45
- GRM
- 7.1
CMA / ARV
No comps found within radius.
Projected returns pro-forma
10.0% appreciation · 3.0% rent growth · sell at horizon
- IRR
- 31.8%
- Equity multiple
- 3.49×
- Total profit
- $90,488
- Equity at exit
- $117,024
- IRR
- 27.4%
- Equity multiple
- 7.90×
- Total profit
- $251,011
- Equity at exit
- $252,367
Cash invested: $36,372 (down + closing). Projections, not guarantees.
Landlord ↔ Tenant lean methodology
- Overall (STATE)
- 83 Strongly Landlord-Friendly
- State Kentucky
- 83 Strongly Landlord-Friendly · R+16
- County
- — inherits STATE
- City
- — inherits STATE
ZIP-level market 40440
- Home prices YoY
- 15.9%
- Active inventory
- 15
- Price-to-rent
- 7.1×
Monthly cashflow live
- Estimated rent
- $1,528 medium interval (Pro) →
- Mortgage (P&I)
- −$681
- Tax est. 1.5%
- −$162 /mo · $1,948/yr
- Insurance
- −$54
- HOA
- −$0
- Vacancy / Maint / Mgmt
- −$321
- Net cashflow
- $310
Break-even live
UW: 25.0% down · 7.5% · 30yr · 1.5% tax · 5.0% vac · 8.0% maint · 8.0% mgmt
Financing live
Cash to close
- Down payment
- $32,475
- Closing costs
- $3,897
- Reserves months
- —
- Total cash needed
- —
Loan-product check · same deal, 3 products live
Conventional
25% down · 7.5% · 30yr
- Down + closing
- —
- Monthly P&I
- —
- Monthly cashflow
- —
- DSCR
- —
- Eligible?
- —
Personal DTI + credit; lowest rate.
DSCR
20% down · 8.5% · 30yr
- Down + closing
- —
- Monthly P&I
- —
- Monthly cashflow
- —
- DSCR
- —
- Eligible?
- —
No personal income docs; deal must DSCR.
Hard money
10% down · 12.0% · 12mo
- Down + closing
- —
- Monthly P&I
- —
- Monthly cashflow
- —
- DSCR
- —
- Eligible?
- —
Short-term bridge; refi at stabilization.
Listing history 18 events
-
2026-06-19days on market $129,900 Active 49 DOM
-
2026-06-18days on market $129,900 Active 48 DOM
-
2026-06-17days on market $129,900 Active 47 DOM
-
2026-06-16days on market $129,900 Active 46 DOM
-
2026-06-15days on market $129,900 Active 45 DOM
-
2026-06-14days on market $129,900 Active 43 DOM
-
2026-06-12days on market $129,900 Active 42 DOM
-
2026-06-09days on market $129,900 Active 39 DOM
-
2026-06-08days on market $129,900 Active 38 DOM
-
2026-06-07days on market $129,900 Active 37 DOM
-
2026-06-07days on market $129,900 Active 36 DOM
-
2026-06-03days on market $129,900 Active 33 DOM
-
2026-06-02days on market $129,900 Active 32 DOM
-
2026-06-01days on market $129,900 Active 31 DOM
-
2026-05-31days on market $129,900 Active 30 DOM
-
2026-05-30days on market $129,900 Active 29 DOM
-
2026-04-30$139,900 Active
-
1991-08-01soldstatus $10,000
ⓘ Source: listings_history table (triggers on properties + properties_extension) + one-shot
backfill from property_details.listing_events for pre-trigger history.
Nearby sold comps map
Loading sold comps map…
Walkable amenities ~0.75 mi
Loading nearby amenities…
Taxation est. · year 1
- Rental income
- $18,339
- − Mortgage interest
- −$7,276
- − Property taxes
- −$1,948
- − Insurance
- −$650
- − Repairs & maintenance
- −$1,467
- − Management
- −$1,467
- − Depreciation
- −$3,779
- Taxable income
- $1,751
- Est. tax owed @ 24.0%
- −$420
- After-tax cash flow
- $3,295/yr
For passive investors: Depreciation is non-cash, so a rental often shows a tax loss while cash-flowing — sheltering income. Rental losses are passive: they offset passive income freely, and up to $25,000/yr can offset ordinary (W-2) income if you actively participate and your MAGI is under $100k (phasing out to $0 by $150k); unused losses carry forward. On sale, claimed depreciation is recaptured at up to 25%, and gains may owe capital-gains tax (a 1031 exchange can defer both). Figures are a year-1 estimate at your 24.0% rate — not tax advice; consult a CPA.
Schools (NCES district)
- District
- Boyle County
- NCES district ID
- 2100630
- Math proficiency
- 49% ▼ -18.00%
- Reading proficiency
- 57% ▼ -18.00%
- Median HH income
- $48,352
- Composite
- 45.09/100
- National rank
- #2692
- State rank
- #7 of 165 in KY
Livability — Junction City
- Score
- 62/100
- State rank
- #344
- US rank
- #16311
Category grades
Schools grade is shown separately in the Schools card above.
Census & demographics
- Population (ZIP)
- 2,301
Population outlook (Boyle County) Hauer SSP2
- Today (2025)
- 31,908 people
- By 2030
- 32,875 · +3.0%
- By 2040
- 34,549 · +8.3%
- By 2050
- 36,095 · +13.1%
- By 2075
- 39,800 · +24.7%
- By 2100
- 40,157 · +25.9%
Race, ethnicity, and origin ACS 2023
- Neighborhood character
- Predominantly White (91%)
- Race & ethnicity
- White 91% Hispanic / Latino 6% Two or more races 6% Asian 1%
- Hispanic origin (detail)
- Mexican 6%
- Common ancestry
- Iranian 3% Lithuanian 2% Italian 2%
- Foreign-born
- 6% · Canada
- Languages at home
- 92% English-only · Spanish 5% Other Asian/Pacific 2% Arabic 1%
Political lean MEDSL · Boyle
- 2024 margin
- Strong R (+29.0) · D 34.7% · R 63.7% · Other 1.5%
- 2008→2024 swing
- -5.8pp toward R · 2008: -23.2pp · 2024: -29.0pp
- All cycles
- 2024: R+29.0 2020: R+24.7 2016: R+29.1 2012: R+26.1 2008: R+23.2
Not yet ingested
- Civics
- —
Market trends
- HPI YoY
- ▲ 44.65%
- Current HPI
- 324.7562
- Rent YoY
- —
- Metro
- —
- State GDP YoY
- ▲ 1.81%
- F500 in state
- 4
Industry mix (Fortune 500 HQ in KY)
| Industry | F500 HQs | Revenue |
|---|---|---|
| Healthcare | 1 | $118B |
|
||
| Food / Beverage | 1 | $7B |
|
||
Price history
+1299.0% since first listed2 events — show timeline
- 2026-04-30 Listed $139,900 ImagineMLS
- 1991-08-01 Sold (Public Records) $10,000 Public Records
Cash-flow waterfall
monthlySold comps — $/sqft
last 12 mo · ≤1 miLoading sold comps…