4925 E Desert Cove Ave #359 · Phoenix, AZ
Flood risk 1/10 · Minimal
- FEMA flood zone
- X (shaded)
- Chance of flooding over 30 yrs
- 0.0%
- Est. flood insurance / yr
- $507 – $1,088
Fire risk 3/10 · Minor
- Est. fire insurance / yr
- $610 – $1,132
Heat risk 8/10 · Major
- Hot days now (above 111°F)
- 7 days/yr
- Hot days in 30 yrs
- 19 days/yr
Wind risk 1/10 · Minimal
- Chance of severe wind over 30 yrs
- —
Air-quality risk 3/10 · Minor
- Unhealthy air days now
- 2 days/yr
- Unhealthy air days in 30 yrs
- 3 days/yr
Risk factors via First Street. Map © Google.
Why this score? — see what drove the D grade
The composite is a weighted blend of 9 inputs, each scored 0–100. Each bar is that input's sub-score; the figure is the points it added to the 100-point composite (weight × sub-score).
- ARV discount +12.0/15.0
- Cash flow +8.9/30.0
- Schools +4.8/10.0
- Livability +3.8/5.0
- Rent growth +3.4/5.0
- 1% rule +3.0/10.0
- DSCR +2.5/10.0
- Condition / age +2.5/5.0
- Appreciation +0.0/10.0
$299,975
🖨 Deal sheet 📄 Offer letter ✓ Due diligence
Listing remarks MLS
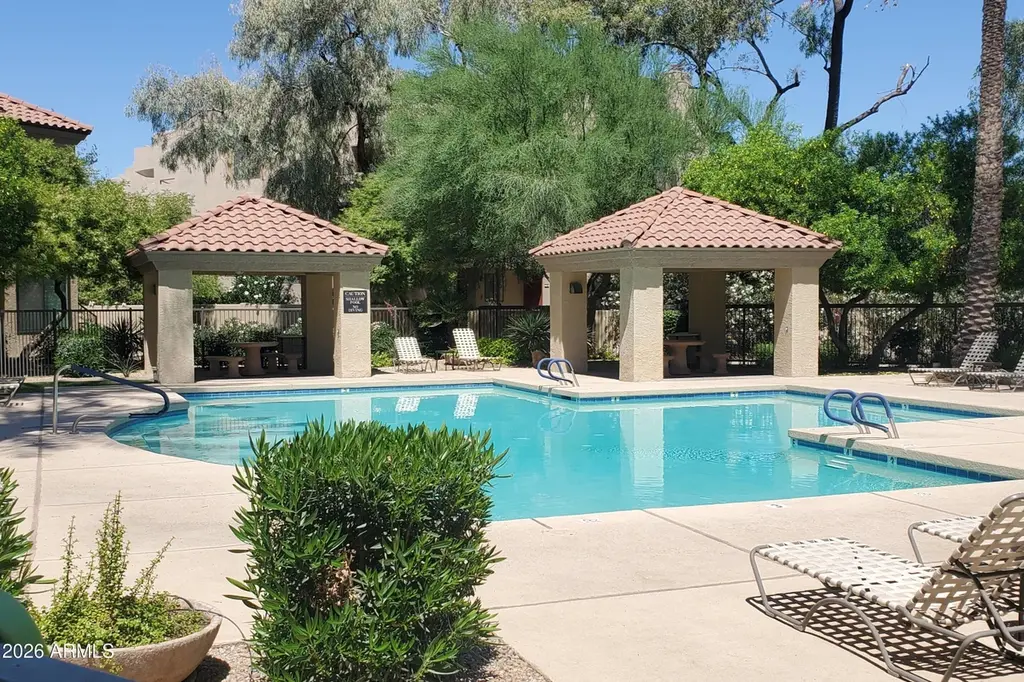
Best Price and Excellent Location in Scottsdale near the Upscale Redeveloping P.V. Mall area with Premier Shopping, Dinning & Amenities GALORE! To name a few; Flower Child, Life Time Fitness, Whole Foods, Trader Joe's, Fry's, The Vig, Costco and more. This 2BR/2BA in Gated Tuscany Villas Condo Resort Community offers a clubhouse, heated pool & spa, workout facility & borders Stone Creek Golf Course with paths for jogging, biking & walking. This bright end-unit features an open floorplan, balcony access off living area with Mountain views! Washer/dryer, fridge included & is available fully furnished, even Turn-key if desired. Covered Parking Space convenient to Entry/Stairs. Gently lived in as a second home 2- 3 months/year. New HVAC! Come view this great unit for yourself before it is gone
Key facts
- $350 HOA
- Parking
- Community pool
Neighborhood map
What this means for you Summary
Snapshot
- This is a 2-bed/2.0-bath condo listed at $300k.
Deal economics
- At list price, monthly cash flow is $-241 ($-3k/yr) — negative.
- To cash-flow at today's rent, offer at most $257k (14.2% below list).
- To meet the 1% rule (rent ≥ 1% of price), the offer needs to be $240k (19.9% below list).
- Recommended offer: $240k (19.9% below list) — sets the bar for 1% rule.
- Cap rate 5.3% vs local median 3.3% in Phoenix — top-decile yield for the area; either an underpriced asset or a hidden risk that comps aren't pricing in. Stress-test before assuming the spread holds.
Location & tenants
- Location reads 75/100 on livability (#16 in AZ, #3,924 nationally) — a middle-class / working-renter tenant base. Strengths: amenities A+, commute A+, housing A+; Watch: health & safety C-, crime F.
- Scottsdale Unified District (4240) (urban): math 53% / reading 55% proficiency, ranked #30 of 249 in AZ (top 12%) — acceptable for families but not a draw, mixed tenant base, ~2y average lease.
- Market conditions: Rents rising (+3.4%/yr); 392 active listings in the ZIP; 40 comparable units currently listed for rent nearby; rentals at typical pace (median 22d on market — plan ~3-4 weeks tenant-placement turnaround); high-income renter base; 36,011 units permitted in Maricopa County in 2024 (12,801 in 5+ unit buildings).
Forward outlook
- Local home prices are declining (-3.0%/yr); year-one equity from $2k of loan paydown is wiped out by about $9k of value loss. Plan a longer hold.
- Maricopa County population projected at +38% by 2050 — long-run rental-demand tailwind backs the buy-and-hold thesis.
Negotiation context
- It's been on market 61 days — a 6% lower offer ($282k) is reasonable based on typical stale-listing flexibility.
- 5 sale attempts since 15y ago with the ask held roughly flat each time — persistent listings suggest the price (not the market) is what's stuck; bring a comps-based counter.
- Current owner paid $139k; list at $300k implies a 116% gain — meaningful room to come down on a strong offer.
Risks & watch-outs
- Climate carrying-cost: extreme-heat days projected 7→19/yr by 2055 (HVAC capex compounding) — expect insurance premiums to compound above CPI over the hold.
Questions for the listing agent
- What do current leases actually rent for vs. the listed asking? Can we see a recent rent roll and the last 12 months of T-12 income?
- It's been on market 61 days. Have you received any prior offers? Is the seller open to a 20% concession, seller financing, or rate buy-down credit?
- What does the HOA fee cover, when was the last increase, and are there any pending special assessments or reserve-fund shortfalls?
- Any open or pending special assessments — roof, HVAC, plumbing, elevator, façade? What's the per-unit balance and payoff schedule, and is the seller paying it off at close or rolling it to the buyer?
- Why hasn't it sold? Are there any deal-killer items the seller is aware of (foundation, flood, title, zoning, code violations)?
- Is there a deadline driving the sale (1031 exchange, divorce, estate, relocation)? That informs how much negotiation room exists.
- Crime grade is F in this area — have there been break-ins, vandalism, or insurance claims at this property in the last 3 years? What carrier currently insures it and at what premium?
- The area grade is low — what's the realistic commute time and amenity access for the typical tenant pool here? Any planned neighborhood developments (good or bad) we should know about?
- What's the average days-on-market for RENTAL listings here right now (not sales)? A rising rental-DOM trend means longer vacancies and softer asking-rent achievability than the comps imply.
- What's the recent tenant-quality profile in this submarket — average credit score on applications, eviction rate, late-payment / NSF rate, and stable-employment percentage? A property-management company in the area should have these aggregated.
- How much new apartment / multifamily construction is in the pipeline within 1–3 miles? Heavy new supply (>2% of stock underway) typically softens rents 12–24 months out; light construction supports rent growth.
Investment metrics
- 1% rule
- 0.80% ✗
- Cap rate
- 5.33%
- Cash-on-cash
- -3.45%
- DSCR
- 0.85
- GRM
- 10.4
CMA / ARV
- ARV (median comp)
- $333,376
- List price
- $299,975
- Delta
- -10.02%
- Verdict
- UNDERPRICED
- Comps
- 20 within 1.0 mi
Projected returns pro-forma
-3.0% appreciation · 3.42% rent growth · sell at horizon
- IRR
- -21.6%
- Equity multiple
- 0.25×
- Total profit
- $-62,881
- Equity at exit
- $44,727
- IRR
- -14.2%
- Equity multiple
- 0.17×
- Total profit
- $-70,011
- Equity at exit
- $25,936
Cash invested: $83,993 (down + closing). Projections, not guarantees.
Landlord ↔ Tenant lean methodology
- Overall (STATE)
- 87 Strongly Landlord-Friendly
- State Arizona
- 87 Strongly Landlord-Friendly · R+3
- County
- — inherits STATE
- City
- — inherits STATE
ZIP-level market 85254
- Rents YoY
- 3.4%
- Active inventory
- 392
- Price-to-rent
- 10.4×
Monthly cashflow live
- Estimated rent
- $2,404 high interval (Pro) →
- Mortgage (P&I)
- −$1,573
- Tax from tax record
- −$92 /mo · $1,107/yr
- Insurance
- −$125
- HOA
- −$350
- Vacancy / Maint / Mgmt
- −$505
- Net cashflow
- $-241
Break-even live
UW: 25.0% down · 7.5% · 30yr · 1.5% tax · 5.0% vac · 8.0% maint · 8.0% mgmt
Financing live
Cash to close
- Down payment
- $74,994
- Closing costs
- $8,999
- Reserves months
- —
- Total cash needed
- —
Loan-product check · same deal, 3 products live
Conventional
25% down · 7.5% · 30yr
- Down + closing
- —
- Monthly P&I
- —
- Monthly cashflow
- —
- DSCR
- —
- Eligible?
- —
Personal DTI + credit; lowest rate.
DSCR
20% down · 8.5% · 30yr
- Down + closing
- —
- Monthly P&I
- —
- Monthly cashflow
- —
- DSCR
- —
- Eligible?
- —
No personal income docs; deal must DSCR.
Hard money
10% down · 12.0% · 12mo
- Down + closing
- —
- Monthly P&I
- —
- Monthly cashflow
- —
- DSCR
- —
- Eligible?
- —
Short-term bridge; refi at stabilization.
Rent comps 40 comps
| Address | Beds | Baths | Sqft | Rent | $/sqft | DOM | Units | Dist |
|---|---|---|---|---|---|---|---|---|
| 4925 E Desert Cove Ave Scottsdale, AZ | 1.0–2.0 | 1.0–2.0 | 911 | $2,250 | $2.47 | 24d | 4 | 0.01mi |
| 4925 E Desert Cove Ave Scottsdale, AZ | 1.0–3.0 | 1.0–2.0 | 973 | $1,925 | $1.98 | 43d | 5 | 0.01mi |
| 4925 E Desert Cove Ave Scottsdale, AZ | 1.0–2.0 | 1.0–2.0 | 903 | $2,250 | $2.49 | 7d | 2 | 0.01mi |
| 5122 E Shea Blvd Scottsdale, AZ | 1.0–2.0 | 1.0–2.5 | 946 | $2,900 | $3.06 | 18d | 3 | 0.13mi |
| 5122 E Shea Blvd Scottsdale, AZ | 1.0–2.0 | 1.0–2.0 | 912 | $3,100 | $3.40 | 43d | 3 | 0.13mi |
| 4850 E Desert Cove Ave Scottsdale, AZ | 1.0–2.0 | 1.0–2.0 | 1078 | $2,100 | $1.95 | 43d | 4 | 0.16mi |
| 4850 E Desert Cove Ave Scottsdale, AZ | 1.0–2.0 | 1.0–2.0 | 889 | $2,200 | $2.47 | 2d | 3 | 0.16mi |
| 5249 E Shea Blvd #103 Scottsdale, AZ | 2.0 | 2.0 | 1147 | $1,625 | $1.42 | 24d | 1 | 0.42mi |
| 10401 N 52nd St Paradise Valley, AZ | 2.0 | 2.0 | 1076 | $1,924 | $1.79 | 3d | 2 | 0.42mi |
| 5249 E Shea Blvd Scottsdale, AZ | 2.0 | 2.0 | 1147 | $1,625 | $1.42 | 21d | 1 | 0.47mi |
| 5335 E Shea Blvd Scottsdale, AZ | 1.0–3.0 | 1.0–2.0 | 1018 | $4,125 | $4.05 | 24d | 5 | 0.62mi |
| 5335 E Shea Blvd Scottsdale, AZ | 1.0–3.0 | 1.0–2.0 | 1000 | $2,388 | $2.39 | 43d | 5 | 0.62mi |
| 11640 N Tatum Blvd Phoenix, AZ | 2.0 | 2.0 | 1225 | $2,800 | $2.29 | 43d | 4 | 0.64mi |
| 11640 N Tatum Blvd Phoenix, AZ | 1.0–2.0 | 1.0–2.0 | 1050 | $2,300 | $2.19 | 18d | 5 | 0.64mi |
| 11640 N Tatum Blvd Phoenix, AZ | 1.0–2.0 | 1.0–2.0 | 1174 | $2,300 | $1.96 | 14d | 4 | 0.64mi |
| 4465 E Paradise Village Pkwy S #1188 Phoenix, AZ | 1.0 | 1.0 | 812 | $1,695 | $2.09 | 24d | 1 | 0.85mi |
| 4455 E Paradise Village Pkwy S Phoenix, AZ | 2.0 | 2.0–3.5 | 1194 | $2,125 | $1.78 | 44d | 2 | 0.89mi |
| 4455 E Paradise Village Pkwy S Phoenix, AZ | 2.0 | 2.0 | 1212 | $2,038 | $1.68 | 18d | 2 | 0.89mi |
| 4502 E Paradise Village Pkwy S Phoenix, AZ | 1.0–2.0 | 1.0–2.0 | 837 | $1,726 | $2.06 | 1d | 13 | 0.96mi |
| 4444 E Paradise Vlg Pkwy S Unit 241 Phoenix, AZ | 2.0 | 2.0 | 1000 | $1,445 | $1.45 | 11d | 1 | 0.96mi |
| 12211 N Paradise Village Pkwy S Phoenix, AZ | 1.0–2.0 | 1.0–2.0 | 740 | $1,574 | $2.13 | 2d | 8 | 1.09mi |
| 12212 N Paradise Village Pkwy S Unit 1545756P Phoenix, AZ | 1.0 | 1.0 | 990 | $1,613 | $1.63 | 14d | 1 | 1.10mi |
| 12212 N Paradise Village Pkwy S Phoenix, AZ | 1.0–2.0 | 1.0–2.0 | 1053 | $3,800 | $3.61 | 18d | 3 | 1.10mi |
| 12212 N Paradise Village Pkwy S Phoenix, AZ | 1.0–2.0 | 1.0–2.0 | 1053 | $3,800 | $3.61 | 43d | 4 | 1.10mi |
| 12212 N Paradise Village Pkwy W Unit 412C Phoenix, AZ | 1.0 | 1.0 | 850 | $2,650 | $3.12 | 43d | 1 | 1.13mi |
| 4106 E Sunnyside Dr Phoenix, AZ | 2.0 | 2.0 | 1370 | $2,695 | $1.97 | 24d | 1 | 1.14mi |
| 11023 N Saint Andrews Way Scottsdale, AZ | 1.0 | 1.0 | 800 | $1,750 | $2.19 | 43d | 1 | 1.17mi |
| 12400 N Tatum Blvd Phoenix, AZ | 1.0–3.0 | 1.0–3.0 | 1283 | $3,860 | $3.01 | 2d | 30 | 1.21mi |
| 4303 E Cactus Rd Phoenix, AZ | 1.0–2.0 | 1.0 | 1025 | $3,500 | $3.41 | 21d | 4 | 1.25mi |
| 4303 E Cactus Rd Phoenix, AZ | 1.0 | 1.0 | 850 | $2,425 | $2.85 | 4d | 5 | 1.25mi |
| 4303 E Cactus Rd #116 Phoenix, AZ | 1.0 | 1.0 | 850 | $3,500 | $4.12 | 43d | 1 | 1.26mi |
| 4303 E Cactus Rd Unit 1546212P Phoenix, AZ | 1.0 | 1.0 | 979 | $1,717 | $1.75 | 15d | 1 | 1.26mi |
| 12222 N Paradise Village Pkwy S Phoenix, AZ | 1.0 | 1.0 | 867 | $2,700 | $3.11 | 24d | 3 | 1.27mi |
| 12222 N Paradise Village Pkwy S #402 Phoenix, AZ | 1.0 | 1.0 | 850 | $3,900 | $4.59 | 43d | 1 | 1.27mi |
| 4014 E Cortez St Phoenix, AZ | 2.0 | 2.0 | 1302 | $2,200 | $1.69 | 21d | 1 | 1.33mi |
| 4150 E Cactus Rd #216 Phoenix, AZ | 2.0 | 2.0 | 942 | $2,500 | $2.65 | 24d | 1 | 1.40mi |
| 4704 E Paradise Village Pkwy N Phoenix, AZ | 1.0–2.0 | 1.0–2.0 | 910 | $2,500 | $2.75 | 2d | 4 | 1.44mi |
| 4704 E Paradise Village Pkwy N Phoenix, AZ | 1.0–2.0 | 1.0–2.0 | 909 | $2,500 | $2.75 | 15d | 3 | 1.44mi |
| 4704 E Paradise Village Pkwy N Phoenix, AZ | 1.0–2.0 | 1.0–2.0 | 909 | $2,500 | $2.75 | 16d | 4 | 1.44mi |
| 4202 E Cactus Rd Phoenix, AZ | 2.0 | 2.0 | 1001 | $1,829 | $1.83 | 3d | 1 | 1.47mi |
HOA detail condo
- Monthly dues
- $350 · $4,200/yr
- Likely covers
- poolsecurity
- Assessments
- None detected in remarks — confirm with the listing agent.
Listing history 25 events
-
2026-06-18days on market $299,975 Active 61 DOM
-
2026-06-17days on market $299,975 Active 60 DOM
-
2026-06-16days on market $299,975 Active 59 DOM
-
2026-06-15days on market $299,975 Active 58 DOM
-
2026-06-13days on market $299,975 Active 56 DOM
-
2026-06-13days on market $299,975 Active 55 DOM
-
2026-06-09days on market $299,975 Active 52 DOM
-
2026-06-08days on market $299,975 Active 51 DOM
-
2026-06-07days on market $299,975 Active 50 DOM
-
2026-06-04days on market $299,975 Active 47 DOM
-
2026-06-03days on market $299,975 Active 46 DOM
-
2026-06-02days on market $299,975 Active 45 DOM
-
2026-06-01days on market $299,975 Active 44 DOM
-
2026-05-31days on market $299,975 Active 43 DOM
-
2026-04-18$299,975 Active 820-char remark
Show marketing remark (820 chars)
Best Price and Excellent Location in Scottsdale near the Upscale Redeveloping P.V. Mall area with Premier Shopping, Dinning & Amenities GALORE! To name a few; Flower Child, Life Time Fitness, Whole Foods, Trader Joe's, Fry's, The Vig, Costco and more. This 2BR/2BA in Gated Tuscany Villas Condo Resort Community offers a clubhouse, heated pool & spa, workout facility & borders Stone Creek Golf Course with paths for jogging, biking & walking. This bright end-unit features an open floorplan, balcony access off living area with Mountain views! Washer/dryer, fridge included & is available fully furnished, even Turn-key if desired. Covered Parking Space convenient to Entry/Stairs. Gently lived in as a second home 2- 3 months/year. New HVAC! Come view this great unit for yourself before it is gone
-
2011-12-07historical
-
2011-12-05$87,900 Active
-
2011-11-15historical
-
2011-11-11historical Under Contract Accepting Backups
-
2011-09-16status Active
-
2011-09-15historical Under Contract Accepting Backups
-
2011-09-11status Active
-
2011-04-19historical Under Contract Accepting Backups
-
2011-04-14$95,000 Active
-
2005-09-15soldstatus $138,815
ⓘ Source: listings_history table (triggers on properties + properties_extension) + one-shot
backfill from property_details.listing_events for pre-trigger history.
Tax reassessment forecast AZ · Resets to sale price
- Current annual tax
- $1,107 · $92/mo
- Projected year-2 tax
- $1,980 · $165/mo
- Expected delta
- +$873/yr (+$73/mo · 78.9%)
ⓘ Screening estimate from a state-policy table — verify with the county assessor before closing.
Climate risk First Street
- Flood 1/10 Low FEMA zone X (shaded) · 0% chance over 30 yrs
- Wildfire 3/10 Moderate
- Heat 8/10 Severe 7 d/yr ≥111°F today · 19 d/yr by 30 yrs out
- Wind 1/10 Low
- Air quality 3/10 Moderate 2 unhealthy d/yr today · 3 by 30 yrs out
Nearby sold comps map
Loading sold comps map…
Walkable amenities ~0.75 mi
Loading nearby amenities…
Taxation est. · year 1
- Rental income
- $28,846
- − Mortgage interest
- −$16,803
- − Property taxes
- −$1,107
- − Insurance
- −$1,500
- − Repairs & maintenance
- −$2,308
- − Management
- −$2,308
- − HOA
- −$4,200
- − Depreciation
- −$8,727
- Taxable loss
- −$8,106
- Est. tax savings @ 24.0%
- +$1,945
- After-tax cash flow
- $-950/yr
For passive investors: Depreciation is non-cash, so a rental often shows a tax loss while cash-flowing — sheltering income. Rental losses are passive: they offset passive income freely, and up to $25,000/yr can offset ordinary (W-2) income if you actively participate and your MAGI is under $100k (phasing out to $0 by $150k); unused losses carry forward. On sale, claimed depreciation is recaptured at up to 25%, and gains may owe capital-gains tax (a 1031 exchange can defer both). Figures are a year-1 estimate at your 24.0% rate — not tax advice; consult a CPA.
Schools (NCES district)
- District
- Scottsdale Unified District (4240)
- NCES district ID
- 0407570
- Math proficiency
- 53% ▼ -10.00%
- Reading proficiency
- 55% ▼ -8.00%
- Median HH income
- $70,139
- Composite
- 48.02/100
- National rank
- #2196
- State rank
- #30 of 249 in AZ
Livability — Phoenix
- Score
- 75/100
- State rank
- #16
- US rank
- #3924
Category grades
Schools grade is shown separately in the Schools card above.
Census & demographics
- Census place
- Phoenix, AZ
- County
- Maricopa County · 4,537,380 people
- City population
- 1,500,198
- Metro
- Phoenix-Mesa-Chandler, AZ
- Population (ZIP)
- 45,558
- Household income
- $123,203
- Rent vs Own
- Severe rent burden
- 1263.0
Population outlook (Maricopa County) Hauer SSP2
- Today (2025)
- 4,979,203 people
- By 2030
- 5,378,229 · +8.0%
- By 2040
- 6,156,598 · +23.6%
- By 2050
- 6,872,376 · +38.0%
- By 2075
- 8,401,270 · +68.7%
- By 2100
- 9,247,439 · +85.7%
Race, ethnicity, and origin ACS 2023
- Neighborhood character
- Predominantly White (76%)
- Race & ethnicity
- White 76% Asian 9% Hispanic / Latino 9% Two or more races 8%
- Hispanic origin (detail)
- Mexican 5%
- Common ancestry
- Romanian 4% Italian 4% Slovak 3%
- Foreign-born
- 14% · Canada, Vietnam, China
- Languages at home
- 85% English-only · Other Indo-European 6% Spanish 3% Other Asian/Pacific 3%
Political lean MEDSL · Maricopa
- 2024 margin
- Toss-up / Even · D 47.7% · R 51.2% · Other 1.1%
- 2008→2024 swing
- +7.1pp toward D · 2008: -10.6pp · 2024: -3.5pp
- All cycles
- 2024: R+3.5 2020: D+2.2 2016: R+3.5 2012: R+12.0 2008: R+10.6
Not yet ingested
- Civics
- —
Market trends
- HPI YoY
- ▼ -544.56%
- Current HPI
- 398.7261
- Rent YoY
- ▲ 3.42%
- Metro
- Phoenix-Mesa-Chandler, AZ
- State GDP YoY
- ▲ 4.54%
- F500 in state
- 20
Industry mix (Fortune 500 HQ in AZ)
| Industry | F500 HQs | Revenue |
|---|---|---|
| Technology | 2 | $13B |
|
||
| Mining / Metals | 1 | $23B |
|
||
| Environmental Services | 1 | $16B |
|
||
| Metals / Steel | 1 | $14B |
|
||
| Technology Distribution | 1 | $9B |
|
||
| Homebuilding | 1 | $8B |
|
||
Price history
+116.1% since first listed11 events — show timeline
- 2026-04-18 Listed $299,975 ARMLS
- 2011-12-07 Listing Removed — ARMLS
- 2011-12-05 Listed $87,900 ARMLS
- 2011-11-15 Listing Removed — ARMLS
- 2011-11-11 Contingent — ARMLS
- 2011-09-16 Relisted — ARMLS
- 2011-09-15 Contingent — ARMLS
- 2011-09-11 Relisted — ARMLS
- 2011-04-19 Contingent — ARMLS
- 2011-04-14 Listed $95,000 ARMLS
- 2005-09-15 Sold (Public Records) $138,815 Public Records
Property tax history
-0.4%/yrLatest (2025): $1,107 · +4.7% YoY. Source: county tax records.
Cash-flow waterfall
monthlySold comps — $/sqft
last 12 mo · ≤1 miLoading sold comps…