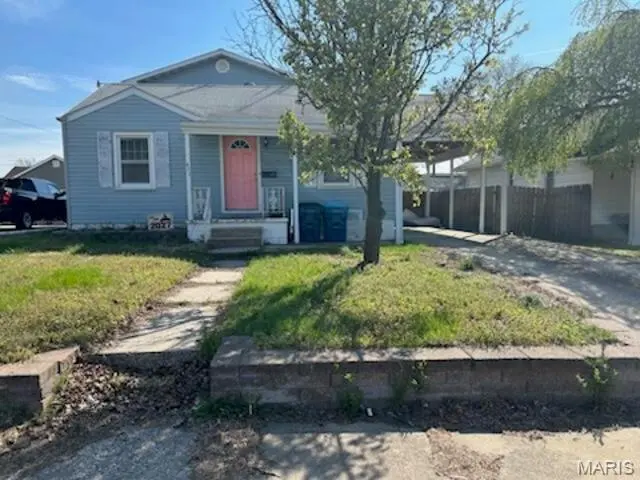
451 Hamilton Ave · Wood River, IL
Flood risk 1/10 · Minimal
- FEMA flood zone
- X
- Chance of flooding over 30 yrs
- 0.0%
- Est. flood insurance / yr
- $507 – $1,088
Fire risk 1/10 · Minimal
- Est. fire insurance / yr
- $804 – $1,492
Heat risk 6/10 · Moderate
- Hot days now (above 107°F)
- 7 days/yr
- Hot days in 30 yrs
- 20 days/yr
Wind risk 2/10 · Minimal
- Chance of severe wind over 30 yrs
- 1.0%
Air-quality risk 3/10 · Minor
- Unhealthy air days now
- 2 days/yr
- Unhealthy air days in 30 yrs
- 4 days/yr
Risk factors via First Street. Map © Google.
Why this score? — see what drove the B+ grade
The composite is a weighted blend of 9 inputs, each scored 0–100. Each bar is that input's sub-score; the figure is the points it added to the 100-point composite (weight × sub-score).
- Cash flow +30.0/30.0
- ARV discount +15.0/15.0
- 1% rule +10.0/10.0
- DSCR +10.0/10.0
- Livability +3.8/5.0
- Rent growth +2.5/5.0
- Condition / age +2.5/5.0
- Schools +1.6/10.0
- Appreciation +0.0/10.0
$79,900
🖨 Deal sheet 📄 Offer letter ✓ Due diligence
Listing remarks MLS
Many updates, addition in back was in 2002 and new kitchen in 2012, 4 bedrooms, family room, 2 outbuildings, fenced back yard, attached carport. Walking distance to schools, shopping and aquatic center. Agent related to seller.
Key facts
- Carpet flooring
- Vinyl siding
- Tile flooring
Tags
Property features AI
Finance
- Other: Property condition: Fixer
Exterior
- Parking: Has carport (1 space)
- Utilities: Electricity connected; Sewer connected; Water connected; Electric: Other
- Home design: Single family residence; Residential house; Two levels; Entry level: Main
- Construction: Frame construction with vinyl siding; Asphalt shingle roof; Other foundation details; Built/Year info provided by owner
- Exterior features: Other exterior features; Lot features: Other
Interior
- Kitchen: Dishwasher; Range; Refrigerator
- Bedrooms: 4 bedrooms total (3 bedrooms on the main level, 1 bedroom on the upper level)
- Flooring: Carpet; Tile
- Bathrooms: 1 full bathroom
- Heating & cooling: Forced air heating (natural gas); Central air conditioning
- Interior features: Other interior features
Neighborhood map
What this means for you Summary
Snapshot
- This is a 3-bed/1.0-bath single-family listed at $80k.
Deal economics
- At list price, monthly cash flow is $540 ($6k/yr) — positive.
- The deal already cash-flows at list — no discount required.
- Meets the 1% rule at list price ($2k rent vs $80k).
- Recommended offer: $75k (6.0% below list) — sets the bar for market timing.
- Cap rate 14.4% vs local median 5.9% in Wood River — top-decile yield for the area; either an underpriced asset or a hidden risk that comps aren't pricing in. Stress-test before assuming the spread holds.
Location & tenants
- Location reads 75/100 on livability (#214 in IL, #4,027 nationally) — a middle-class / working-renter tenant base. Strengths: cost of living A+, housing A+, health & safety B; Watch: amenities C-, commute D+, employment D+.
- East Alton-Wood River Chsd 14 (suburban): math 10% / reading 20% proficiency, ranked #793 of 919 in IL (top 86%) — low school quality limits family demand, transient renter base, plan for 1-2y turnover.
- Zoned schools: East Alton-Wood River High Sch (math 8% / reading 12%, grade F, #567 of 693 statewide, top 83%, 537 students, 0% FRL).
- Market conditions: 33 active listings in the ZIP; 3 comparable units currently listed for rent nearby; rentals leasing fast (median 2d on market — plan ~1-2 weeks tenant-placement turnaround); 336 units permitted in Madison County in 2024 (0 in 5+ unit buildings).
Forward outlook
- Local home prices are declining (-3.0%/yr); year-one equity from $552 of loan paydown is wiped out by about $2k of value loss. Plan a longer hold.
- Madison County population projected at -18% by 2050 — secular population decline; favor cash flow + early exit over multi-decade hold.
- At projected returns (-3.0% appreciation + 3.0% rent growth), your $22k cash investment doubles in ~5 years — after that, you're playing with house money.
Negotiation context
- It's been on market 68 days — a 6% lower offer ($75k) is reasonable based on typical stale-listing flexibility.
- 2 sale attempts since 12y ago; this cycle's ask has dropped $10k (11%) from the opening price — seller is motivated, your offer sets the floor, not the list.
Risks & watch-outs
- Watch-outs: property tax is 3.7% of price; built in 1930 — expect roof / HVAC / electrical / plumbing capex.
- Climate carrying-cost: extreme-heat days projected 7→20/yr by 2055 (HVAC capex compounding) — expect insurance premiums to compound above CPI over the hold.
Questions for the listing agent
- It's been on market 68 days. Have you received any prior offers? Is the seller open to a 6% concession, seller financing, or rate buy-down credit?
- Built in 1930 — when were the roof, HVAC, electrical panel, plumbing, and water heater last replaced?
- Property tax is high relative to price — has the assessment been appealed recently, and will the sale trigger a re-assessment?
- Why hasn't it sold? Are there any deal-killer items the seller is aware of (foundation, flood, title, zoning, code violations)?
- Is there a deadline driving the sale (1031 exchange, divorce, estate, relocation)? That informs how much negotiation room exists.
- Schools are F-rated, which usually means shorter tenancies and higher turnover. Who's the typical renter profile here, and what's been the actual vacancy rate?
- What's the average days-on-market for RENTAL listings here right now (not sales)? A rising rental-DOM trend means longer vacancies and softer asking-rent achievability than the comps imply.
- What's the recent tenant-quality profile in this submarket — average credit score on applications, eviction rate, late-payment / NSF rate, and stable-employment percentage? A property-management company in the area should have these aggregated.
- How much new for-sale + rental construction is in the pipeline within 1–3 miles? Heavy new supply typically softens prices + rents 12–24 months out; constrained supply supports both.
Investment metrics
- 1% rule
- 1.96% ✓
- Cap rate
- 14.40%
- Cash-on-cash
- 28.95%
- DSCR
- 2.29
- GRM
- 4.3
CMA / ARV
- ARV (on-the-fly)
- $134,576
- Comps found
- 12
Show comp detail 12 sales within ~0.75 mi
| Address | Dist | Beds/Ba | Sqft | Sold | Price | $/sf | Match |
|---|---|---|---|---|---|---|---|
| 537 Tipton Ave | 0.31mi | 3/1.0 | 1,300 (+0%) | 7mo | $147,500 | $113 | 79 |
| 41 W Penning Ave | 0.30mi | 3/2.0 | 1,289 (-0%) | 5mo | $159,999 | $124 | 77 |
| 447 N 3rd St | 0.17mi | 3/1.0 | 1,443 (+12%) | 2mo | $89,900 | $62 | 71 |
| 641 Leslie Ave | 0.25mi | 2/1.5 (-1) | 1,348 (+4%) | 6mo | $165,000 | $122 | 69 |
| 469 Tipton Ave | 0.30mi | 3/1.0 | 1,142 (-12%) | 3mo | $130,000 | $114 | 64 |
| 734 Berry Rd | 0.63mi | 2/1.0 (-1) | 1,300 (+0%) | 6mo | $80,000 | $62 | 60 |
| 549 Mchugh St | 0.61mi | 3/1.5 | 1,372 (+6%) | 2mo | $154,000 | $112 | 58 |
| 712 Condit St | 0.42mi | 3/1.0 | 1,120 (-13%) | 0mo | $99,900 | $89 | 57 |
| 409 N 6th St | 0.44mi | 2/1.0 (-1) | 1,103 (-15%) | 1mo | $115,000 | $104 | 49 |
| 38 N Main St | 0.68mi | 3/1.0 | 1,160 (-10%) | 3mo | $77,500 | $67 | 49 |
| 830 N Wood River Ave | 0.56mi | 2/1.0 (-1) | 1,120 (-13%) | 7mo | $45,000 | $40 | 40 |
| 367 Elble Ave | 0.73mi | 2/1.0 (-1) | 1,120 (-13%) | 1mo | $100,000 | $89 | 38 |
Match score weights: distance 35% · size 25% · config 20% · recency 20%. Top-matched comps best support the ARV.
Projected returns pro-forma
-3.0% appreciation · 3.0% rent growth · sell at horizon
- IRR
- 23.4%
- Equity multiple
- 1.96×
- Total profit
- $21,536
- Equity at exit
- $11,913
- IRR
- 31.4%
- Equity multiple
- 3.84×
- Total profit
- $63,465
- Equity at exit
- $6,908
Cash invested: $22,372 (down + closing). Projections, not guarantees.
Landlord ↔ Tenant lean methodology
- Overall (STATE)
- 43 Moderately Tenant-Leaning
- State Illinois
- 43 Moderately Tenant-Leaning · D+7
- County
- — inherits STATE
- City
- — inherits STATE
ZIP-level market 62095
- Home prices YoY
- -22.9%
- Active inventory
- 33
- Price-to-rent
- 4.3×
Monthly cashflow live
- Estimated rent
- $1,564 medium interval (Pro) →
- Mortgage (P&I)
- −$419
- Tax from tax record
- −$243 /mo · $2,920/yr
- Insurance
- −$33
- HOA
- −$0
- Vacancy / Maint / Mgmt
- −$328
- Net cashflow
- $540
Break-even live
UW: 25.0% down · 7.5% · 30yr · 1.5% tax · 5.0% vac · 8.0% maint · 8.0% mgmt
Financing live
Cash to close
- Down payment
- $19,975
- Closing costs
- $2,397
- Reserves months
- —
- Total cash needed
- —
Loan-product check · same deal, 3 products live
Conventional
25% down · 7.5% · 30yr
- Down + closing
- —
- Monthly P&I
- —
- Monthly cashflow
- —
- DSCR
- —
- Eligible?
- —
Personal DTI + credit; lowest rate.
DSCR
20% down · 8.5% · 30yr
- Down + closing
- —
- Monthly P&I
- —
- Monthly cashflow
- —
- DSCR
- —
- Eligible?
- —
No personal income docs; deal must DSCR.
Hard money
10% down · 12.0% · 12mo
- Down + closing
- —
- Monthly P&I
- —
- Monthly cashflow
- —
- DSCR
- —
- Eligible?
- —
Short-term bridge; refi at stabilization.
Rent comps 3 comps
| Address | Beds | Baths | Sqft | Rent | $/sqft | DOM | Units | Dist |
|---|---|---|---|---|---|---|---|---|
| 135 E Acton Ave Wood River, IL | 4.0 | 2.0 | 1560 | $1,750 | $1.12 | 43d | 1 | 0.21mi |
| 1400 Brushey Grove Ave Wood River, IL | 4.0 | 1.5 | 1050 | $1,600 | $1.52 | 1d | 1 | 1.15mi |
| 176 S Pence St East Alton, IL | 2.0 | 1.0 | 1000 | $1,100 | $1.10 | 1d | 1 | 1.26mi |
Listing history 18 events
-
2026-06-18days on market $79,900 Active 68 DOM
-
2026-06-17days on market $79,900 Active 67 DOM
-
2026-06-16days on market $79,900 Active 66 DOM
-
2026-06-15days on market $79,900 Active 65 DOM
-
2026-06-13days on market $79,900 Active 63 DOM
-
2026-06-13days on market $79,900 Active 62 DOM
-
2026-06-09days on market $79,900 Active 59 DOM
-
2026-06-08days on market $79,900 Active 58 DOM
-
2026-06-07days on market $79,900 Active 57 DOM
-
2026-06-03days on market $79,900 Active 53 DOM
-
2026-06-02days on market $79,900 Active 52 DOM
-
2026-06-01days on market $79,900 Active 51 DOM
-
2026-05-31days on market $79,900 Active 50 DOM
-
2026-04-29price $79,900
-
2026-04-22price $84,900
-
2026-04-11$89,900 Active
-
2014-05-28soldstatus 227-char remark
Show marketing remark (227 chars)
Many updates, addition in back was in 2002 and new kitchen in 2012, 4 bedrooms, family room, 2 outbuildings, fenced back yard, attached carport. Walking distance to schools, shopping and aquatic center. Agent related to seller.
-
2014-03-13$91,000 227-char remark
Show marketing remark (227 chars)
Many updates, addition in back was in 2002 and new kitchen in 2012, 4 bedrooms, family room, 2 outbuildings, fenced back yard, attached carport. Walking distance to schools, shopping and aquatic center. Agent related to seller.
ⓘ Source: listings_history table (triggers on properties + properties_extension) + one-shot
backfill from property_details.listing_events for pre-trigger history.
Tax reassessment forecast IL · Partial reset (capped growth)
- Current annual tax
- $2,920 · $243/mo
- Projected year-2 tax
- $2,920 · $243/mo
- Expected delta
- $0/yr ($0/mo · 0.0%)
ⓘ Screening estimate from a state-policy table — verify with the county assessor before closing.
Climate risk First Street
- Flood 1/10 Low FEMA zone X · 0% chance over 30 yrs
- Wildfire 1/10 Low
- Heat 6/10 Major 7 d/yr ≥107°F today · 20 d/yr by 30 yrs out
- Wind 2/10 Low 100% chance of damaging wind over 30 yrs
- Air quality 3/10 Moderate 2 unhealthy d/yr today · 4 by 30 yrs out
Nearby sold comps map
Loading sold comps map…
Walkable amenities ~0.75 mi
Loading nearby amenities…
Taxation est. · year 1
- Rental income
- $18,763
- − Mortgage interest
- −$4,476
- − Property taxes
- −$2,920
- − Insurance
- −$400
- − Repairs & maintenance
- −$1,501
- − Management
- −$1,501
- − Depreciation
- −$2,324
- Taxable income
- $5,642
- Est. tax owed @ 24.0%
- −$1,354
- After-tax cash flow
- $5,122/yr
For passive investors: Depreciation is non-cash, so a rental often shows a tax loss while cash-flowing — sheltering income. Rental losses are passive: they offset passive income freely, and up to $25,000/yr can offset ordinary (W-2) income if you actively participate and your MAGI is under $100k (phasing out to $0 by $150k); unused losses carry forward. On sale, claimed depreciation is recaptured at up to 25%, and gains may owe capital-gains tax (a 1031 exchange can defer both). Figures are a year-1 estimate at your 24.0% rate — not tax advice; consult a CPA.
Schools (NCES district)
- District
- East Alton-Wood River Chsd 14
- NCES district ID
- 1712990
- Math proficiency
- 10% ▬ 0.00%
- Reading proficiency
- 20% ▬ 0.00%
- Median HH income
- $35,977
- Composite
- 15.86/100
- National rank
- #14315
- State rank
- #793 of 919 in IL
Livability — Wood River
- Score
- 75/100
- State rank
- #214
- US rank
- #4027
Category grades
Schools grade is shown separately in the Schools card above.
Census & demographics
- Census place
- Wood River, IL
- County
- Madison County · 189,064 people
- City population
- 10,726
- Metro
- St. Louis, MO-IL
- Population (ZIP)
- 10,726
- Household income
- $65,013
- Rent vs Own
- Severe rent burden
- 383.0
Population outlook (Madison County) Hauer SSP2
- Today (2025)
- 258,371 people
- By 2030
- 251,523 · -2.7%
- By 2040
- 233,640 · -9.6%
- By 2050
- 213,042 · -17.5%
- By 2075
- 165,255 · -36.0%
- By 2100
- 123,953 · -52.0%
Race, ethnicity, and origin ACS 2023
- Neighborhood character
- Predominantly White (87%)
- Race & ethnicity
- White 87% Black 6% Two or more races 6% Hispanic / Latino 3%
- Common ancestry
- Lithuanian 2% Romanian 2% Iranian 1%
- Foreign-born
- 2% · Canada
- Languages at home
- 97% English-only · Spanish 2%
Political lean MEDSL · Madison
- 2024 margin
- R (+13.3) · D 42.5% · R 55.8% · Other 1.8%
- 2008→2024 swing
- -22.5pp toward R · 2008: 9.2pp · 2024: -13.3pp
- All cycles
- 2024: R+13.3 2020: R+13.2 2016: R+15.6 2012: R+1.4 2008: D+9.2
Not yet ingested
- Civics
- —
Market trends
- HPI YoY
- ▼ -64.69%
- Current HPI
- 217.1264
- Rent YoY
- —
- Metro
- St. Louis, MO-IL
- State GDP YoY
- ▲ 1.59%
- F500 in state
- 60
Industry mix (Fortune 500 HQ in IL)
| Industry | F500 HQs | Revenue |
|---|---|---|
| Insurance | 4 | $201B |
|
||
| Consumer Goods | 4 | $87B |
|
||
| Industrial Machinery | 3 | $64B |
|
||
| Healthcare | 2 | $55B |
|
||
| Retail / Pharmacy | 1 | $148B |
|
||
| Agriculture / Food | 1 | $86B |
|
||
Price history
-12.2% since first listed5 events — show timeline
- 2026-04-29 Price Changed $79,900 MARIS as Distributed by MLS Grid
- 2026-04-22 Price Changed $84,900 MARIS as Distributed by MLS Grid
- 2026-04-11 Listed $89,900 MARIS as Distributed by MLS Grid
- 2014-05-28 Sold (MLS) — MARIS as Distributed by MLS Grid
- 2014-03-13 Listed $91,000 MARIS as Distributed by MLS Grid
Property tax history
+2.6%/yrLatest (2024): $2,920 · +6.9% YoY. Source: county tax records.
Cash-flow waterfall
monthlySold comps — $/sqft
last 12 mo · ≤1 miLoading sold comps…