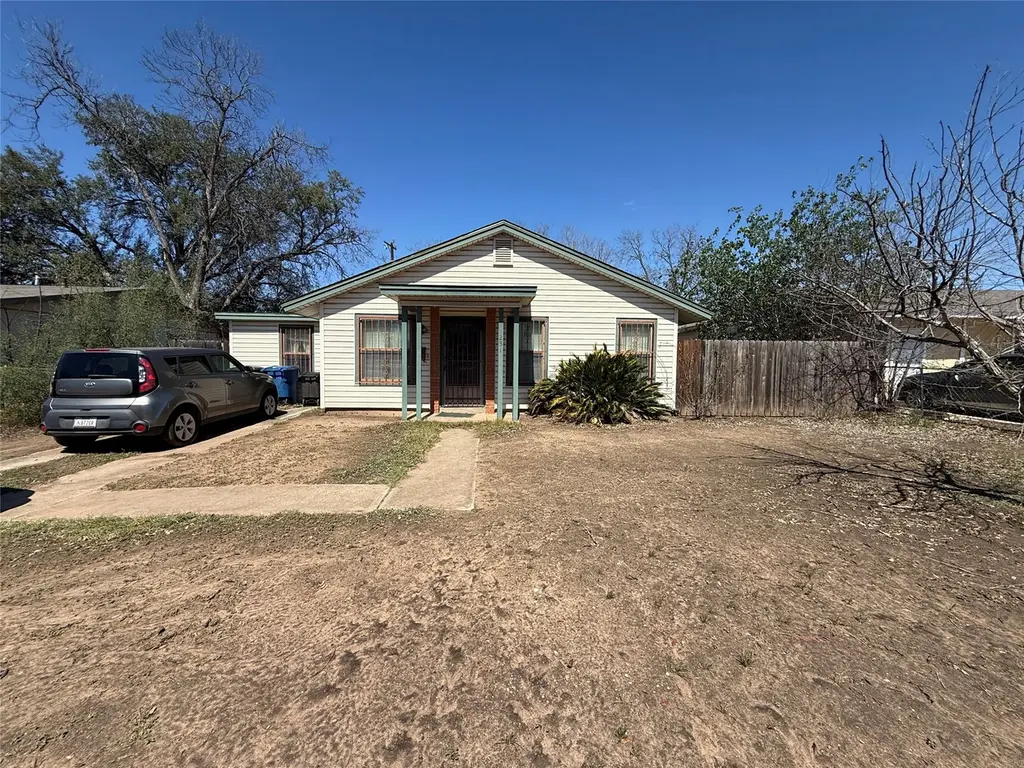
231 Harcourt Ave · San Antonio, TX
Flood risk 1/10 · Minimal
- FEMA flood zone
- X (unshaded)
- Chance of flooding over 30 yrs
- 0.0%
- Est. flood insurance / yr
- $507 – $1,088
Fire risk 4/10 · Minor
- Est. fire insurance / yr
- $1,222 – $2,270
Heat risk 8/10 · Major
- Hot days now (above 109°F)
- 7 days/yr
- Hot days in 30 yrs
- 22 days/yr
Wind risk 8/10 · Major
- Chance of severe wind over 30 yrs
- 80.0%
Air-quality risk 2/10 · Minimal
- Unhealthy air days now
- 0 days/yr
- Unhealthy air days in 30 yrs
- 2 days/yr
Risk factors via First Street. Map © Google.
Why this score? — see what drove the C- grade
The composite is a weighted blend of 9 inputs, each scored 0–100. Each bar is that input's sub-score; the figure is the points it added to the 100-point composite (weight × sub-score).
- Cash flow +17.4/30.0
- ARV discount +15.0/15.0
- 1% rule +5.9/10.0
- DSCR +5.4/10.0
- Livability +4.0/5.0
- Condition / age +2.5/5.0
- Rent growth +1.7/5.0
- Schools +1.4/10.0
- Appreciation +0.0/10.0
$135,000
🖨 Deal sheet 📄 Offer letter ✓ Due diligence
Listing remarks MLS
Welcome to this 3-bedroom, 1-bath home full of potential and ready for your personal touch! This property offers a great opportunity for investors, flippers, or buyers looking to customize their dream home. Featuring a functional layout, spacious living area, and solid structure, it’s the perfect canvas for updates and improvements. Situated on a generous lot with ample outdoor space, there’s plenty of room to enhance curb appeal or expand. Conveniently located near major highways, shopping, dining, and schools, this home combines location with opportunity. Whether you’re looking to renovate and resell or create long-term rental income, this property is priced to sell and packed with potential. Don’t miss your chance to bring your vision to life!
Key facts
- 6,899 sq ft lot
- 2 parking spots
- Built 1957
Neighborhood map
What this means for you Summary
Snapshot
- This is a 3-bed/1.0-bath single-family listed at $135k.
Deal economics
- At list price, monthly cash flow is $102 ($1k/yr) — positive.
- The deal already cash-flows at list — no discount required.
- Meets the 1% rule at list price ($1k rent vs $135k).
- Recommended offer: $127k (6.0% below list) — sets the bar for market timing.
- Cap rate 7.2% vs local median 3.8% in San Antonio — top-decile yield for the area; either an underpriced asset or a hidden risk that comps aren't pricing in. Stress-test before assuming the spread holds.
Location & tenants
- Location reads 80/100 on livability (#31 in TX, #1,616 nationally) — a professional / high-income tenant draw. Strengths: amenities A+, commute A+, cost of living A+; Watch: schools C-, crime F.
- San Antonio ISD (urban): math 12% / reading 22% proficiency, ranked #805 of 826 in TX (top 98%) — low school quality limits family demand, transient renter base, plan for 1-2y turnover; 80% free/reduced lunch — lower-income household profile, screen leases tightly.
- Market conditions: Rents falling (-3.4%/yr); 325 active listings in the ZIP; 37 comparable units currently listed for rent nearby; rentals at typical pace (median 22d on market — plan ~3-4 weeks tenant-placement turnaround); 8,308 units permitted in Bexar County in 2024 (2,506 in 5+ unit buildings).
- This rent runs 34% of the median local income ($52k/yr) — at the standard rent-burdened threshold; future hikes will face affordability resistance.
Forward outlook
- Local home prices are declining (-3.0%/yr); year-one equity from $933 of loan paydown is wiped out by about $4k of value loss. Plan a longer hold.
- Bexar County population projected at +50% by 2050 — long-run rental-demand tailwind backs the buy-and-hold thesis.
Negotiation context
- It's been on market 65 days — a 6% lower offer ($127k) is reasonable based on typical stale-listing flexibility.
Risks & watch-outs
- Watch-outs: property tax is 2.6% of price; built in 1957 — expect roof / HVAC / electrical / plumbing capex.
- Climate carrying-cost: severe wind risk, 80% chance of damaging wind over 30y; extreme-heat days projected 7→22/yr by 2055 (HVAC capex compounding) — expect insurance premiums to compound above CPI over the hold.
Questions for the listing agent
- It's been on market 65 days. Have you received any prior offers? Is the seller open to a 6% concession, seller financing, or rate buy-down credit?
- Built in 1957 — when were the roof, HVAC, electrical panel, plumbing, and water heater last replaced?
- Property tax is high relative to price — has the assessment been appealed recently, and will the sale trigger a re-assessment?
- Why hasn't it sold? Are there any deal-killer items the seller is aware of (foundation, flood, title, zoning, code violations)?
- Is there a deadline driving the sale (1031 exchange, divorce, estate, relocation)? That informs how much negotiation room exists.
- Crime grade is F in this area — have there been break-ins, vandalism, or insurance claims at this property in the last 3 years? What carrier currently insures it and at what premium?
- What's the average days-on-market for RENTAL listings here right now (not sales)? A rising rental-DOM trend means longer vacancies and softer asking-rent achievability than the comps imply.
- What's the recent tenant-quality profile in this submarket — average credit score on applications, eviction rate, late-payment / NSF rate, and stable-employment percentage? A property-management company in the area should have these aggregated.
- How much new for-sale + rental construction is in the pipeline within 1–3 miles? Heavy new supply typically softens prices + rents 12–24 months out; constrained supply supports both.
Investment metrics
- 1% rule
- 1.09% ✓
- Cap rate
- 7.20%
- Cash-on-cash
- 3.23%
- DSCR
- 1.14
- GRM
- 7.6
CMA / ARV
- ARV (median comp)
- $182,179
- List price
- $135,000
- Delta
- -25.90%
- Verdict
- UNDERPRICED
- Comps
- 20 within 1.0 mi
Show comp detail 12 sales within ~0.75 mi
| Address | Dist | Beds/Ba | Sqft | Sold | Price | $/sf | Match |
|---|---|---|---|---|---|---|---|
| 307 Hatcher | 0.24mi | 3/1.5 | 1,160 (-6%) | 1mo | $189,000 | $163 | 76 |
| 119 Harcourt | 0.24mi | 3/1.0 | 1,130 (-8%) | 3mo | $104,400 | $92 | 73 |
| 270 Gayle Ave | 0.35mi | 4/1.0 (+1) | 1,308 (+6%) | 3mo | $55,000 | $42 | 66 |
| 203 Galway | 0.46mi | 3/2.0 | 1,260 (+3%) | 6mo | $155,000 | $123 | 65 |
| 342 Killarney | 0.59mi | 2/1.0 (-1) | 1,221 (-1%) | 5mo | $185,000 | $152 | 63 |
| 3323 Lasses | 0.49mi | 3/1.0 | 1,356 (+10%) | 0mo | $184,900 | $136 | 60 |
| 239 E Palfrey St | 0.41mi | 4/3.0 (+1) | 1,200 (-2%) | 7mo | $124,900 | $104 | 58 |
| 3323 Lasses | 0.49mi | 3/1.0 | 1,356 (+10%) | 3mo | $184,900 | $136 | 58 |
| 310 Hatcher | 0.24mi | 3/2.0 | 1,064 (-13%) | 6mo | $179,900 | $169 | 58 |
| 322 Anton | 0.20mi | 2/1.0 (-1) | 1,404 (+14%) | 8mo | $149,500 | $106 | 55 |
| 407 Pickwell | 0.52mi | 3/2.0 | 1,044 (-15%) | 2mo | $119,000 | $114 | 45 |
| 3906 Adair Blf | 0.66mi | 3/2.0 | 1,366 (+11%) | 2mo | $233,500 | $171 | 45 |
Match score weights: distance 35% · size 25% · config 20% · recency 20%. Top-matched comps best support the ARV.
Projected returns pro-forma
-3.0% appreciation · 0.0% rent growth · sell at horizon
- IRR
- -15.0%
- Equity multiple
- 0.48×
- Total profit
- $-19,608
- Equity at exit
- $20,129
- IRR
- -13.4%
- Equity multiple
- 0.34×
- Total profit
- $-24,997
- Equity at exit
- $11,672
Cash invested: $37,800 (down + closing). Projections, not guarantees.
Landlord ↔ Tenant lean methodology
- Overall (STATE)
- 87 Strongly Landlord-Friendly
- State Texas
- 87 Strongly Landlord-Friendly · R+5
- County
- — inherits STATE
- City
- — inherits STATE
ZIP-level market 78223
- Home prices YoY
- -16.4%
- Rents YoY
- -3.4%
- Active inventory
- 325
- Price-to-rent
- 7.6×
Monthly cashflow live
- Estimated rent
- $1,473 high interval (Pro) →
- Mortgage (P&I)
- −$708
- Tax from tax record
- −$298 /mo · $3,573/yr
- Insurance
- −$56
- HOA
- −$0
- Vacancy / Maint / Mgmt
- −$309
- Net cashflow
- $102
Break-even live
UW: 25.0% down · 7.5% · 30yr · 1.5% tax · 5.0% vac · 8.0% maint · 8.0% mgmt
Financing live
Cash to close
- Down payment
- $33,750
- Closing costs
- $4,050
- Reserves months
- —
- Total cash needed
- —
Loan-product check · same deal, 3 products live
Conventional
25% down · 7.5% · 30yr
- Down + closing
- —
- Monthly P&I
- —
- Monthly cashflow
- —
- DSCR
- —
- Eligible?
- —
Personal DTI + credit; lowest rate.
DSCR
20% down · 8.5% · 30yr
- Down + closing
- —
- Monthly P&I
- —
- Monthly cashflow
- —
- DSCR
- —
- Eligible?
- —
No personal income docs; deal must DSCR.
Hard money
10% down · 12.0% · 12mo
- Down + closing
- —
- Monthly P&I
- —
- Monthly cashflow
- —
- DSCR
- —
- Eligible?
- —
Short-term bridge; refi at stabilization.
Rent comps 37 comps
| Address | Beds | Baths | Sqft | Rent | $/sqft | DOM | Units | Dist |
|---|---|---|---|---|---|---|---|---|
| 271 Kate Schenck Ave San Antonio, TX | 3.0 | 2.0 | 1250 | $1,450 | $1.16 | 20d | 1 | 0.12mi |
| 115 Harcourt Ave San Antonio, TX | 3.0 | 1.0 | 912 | $1,500 | $1.64 | 22d | 1 | 0.25mi |
| 2566 Goliad Rd San Antonio, TX | 2.0 | 1.0 | 600 | $1,350 | $2.25 | 4d | 20 | 0.34mi |
| 2566 Goliad Rd San Antonio, TX | 1.0–2.0 | 1.0 | 600 | $1,300 | $2.17 | 24d | 23 | 0.34mi |
| 462 Utopia Ln San Antonio, TX | 2.0 | 1.0 | 837 | $1,215 | $1.45 | 43d | 1 | 0.45mi |
| 7035 Pickwell Dr San Antonio, TX | 1.0–3.0 | 1.0–2.0 | 953 | $1,769 | $1.86 | 3d | 32 | 0.46mi |
| 462 Utopia Ln Unit W248 San Antonio, TX | 2.0 | 1.0 | 837 | $1,239 | $1.48 | 17d | 1 | 0.51mi |
| 114 Killarney Dr San Antonio, TX | 3.0 | 2.0 | 988 | $1,500 | $1.52 | 15d | 1 | 0.53mi |
| 2303 Goliad Rd San Antonio, TX | 1.0–2.0 | 1.0 | 660 | $998 | $1.51 | 1d | 6 | 0.58mi |
| 2011 Dollarhide Ave San Antonio, TX | 1.0–2.0 | 1.0 | 730 | $1,150 | $1.58 | 22d | 5 | 0.61mi |
| 3522 Bob Billa St San Antonio, TX | 3.0 | 2.0 | 1177 | $1,200 | $1.02 | 43d | 1 | 0.70mi |
| 326 Sublett Dr San Antonio, TX | 2.0 | 1.0 | 912 | $1,350 | $1.48 | 24d | 1 | 0.72mi |
| 4011 Anton Dr San Antonio, TX | 3.0 | 2.0 | 1269 | $1,500 | $1.18 | 43d | 1 | 0.76mi |
| 3903 SE Military Dr San Antonio, TX | 1.0–3.0 | 1.0–2.0 | 942 | $1,364 | $1.45 | 22d | 10 | 0.85mi |
| 4103 Freestone St San Antonio, TX | 4.0 | 2.0 | 1195 | $1,800 | $1.51 | 24d | 1 | 1.01mi |
| 7938 City Base Lndg San Antonio, TX | 1.0–3.0 | 1.0–2.0 | 877 | $1,610 | $1.83 | 1d | 18 | 1.03mi |
| 3007 SE Military Dr Unit 710 San Antonio, TX | 2.0 | 2.0 | 1010 | $855 | $0.85 | 3d | 1 | 1.05mi |
| 7818 Shetland Dr Unit 102 San Antonio, TX | 3.0 | 2.5 | 1225 | $1,395 | $1.14 | 22d | 1 | 1.05mi |
| 7818 Shetland Dr Unit 101 San Antonio, TX | 3.0 | 2.5 | 1225 | $1,475 | $1.20 | 43d | 1 | 1.05mi |
| 7818 Shetland Dr San Antonio, TX | 3.0 | 2.5 | 1380 | $1,475 | $1.07 | 43d | 2 | 1.05mi |
| 7818 Shetland Dr San Antonio, TX | 3.0 | 2.5 | 1380 | $1,550 | $1.12 | 24d | 2 | 1.05mi |
| 4622 Clark Ave San Antonio, TX | 1.0–4.0 | 1.0–2.0 | 859 | $1,380 | $1.61 | 43d | 1 | 1.10mi |
| 4155 Freestone St San Antonio, TX | 4.0 | 2.0 | 1259 | $1,495 | $1.19 | 24d | 1 | 1.13mi |
| 4155 Freestone St San Antonio, TX | 4.0 | 2.0 | 1259 | $1,495 | $1.19 | 4d | 1 | 1.13mi |
| 7310 S New Braunfels Ave Unit 710 San Antonio, TX | 2.0 | 2.0 | 871 | $1,132 | $1.30 | 3d | 1 | 1.16mi |
| 3435 E Southcross Blvd San Antonio, TX | 1.0–2.0 | 1.0–2.0 | 867 | $1,254 | $1.45 | 43d | 1 | 1.19mi |
| 4700 Stringfellow Dr San Antonio, TX | 2.0 | 1.0–2.0 | 904 | $922 | $1.02 | 2d | 3 | 1.23mi |
| 4407 Grassland Pass San Antonio, TX | 4.0 | 2.0 | 1500 | $1,597 | $1.06 | 4d | 1 | 1.26mi |
| 6410 S New Braunfels Ave San Antonio, TX | 1.0–3.0 | 1.0–2.0 | 1017 | $1,555 | $1.53 | 3d | 21 | 1.31mi |
| 4442 Grassland Pass San Antonio, TX | 4.0 | 2.0 | 1492 | $1,685 | $1.13 | 4d | 1 | 1.31mi |
| 7910 S New Braunfels Ave San Antonio, TX | 1.0–3.0 | 1.0–2.0 | 1187 | $2,640 | $2.22 | 1d | 48 | 1.31mi |
| 4443 Glades Way San Antonio, TX | 3.0 | 2.0 | 1450 | $1,395 | $0.96 | 43d | 1 | 1.35mi |
| 4534 Zoe Pass San Antonio, TX | 4.0 | 2.0 | 1492 | $1,625 | $1.09 | 24d | 1 | 1.39mi |
| 4534 Zoe Pass San Antonio, TX | 4.0 | 2.0 | 1492 | $1,625 | $1.09 | 20d | 1 | 1.39mi |
| 7803 S New Braunfels Ave Unit 710 Brooks City Base, TX | 2.0 | 2.0 | 821 | $1,227 | $1.49 | 3d | 1 | 1.40mi |
| 3526 Manoway Bay San Antonio, TX | 3.0 | 2.0 | 1459 | $1,700 | $1.17 | 22d | 1 | 1.45mi |
| 768 Avondale Ave Unit 202 San Antonio, TX | 3.0 | 1.5 | 1050 | $1,195 | $1.14 | 3d | 1 | 1.49mi |
Listing history 15 events
-
2026-06-18days on market $135,000 Active 65 DOM
-
2026-06-17days on market $135,000 Active 64 DOM
-
2026-06-16days on market $135,000 Active 63 DOM
-
2026-06-15days on market $135,000 Active 62 DOM
-
2026-06-13days on market $135,000 Active 60 DOM
-
2026-06-09days on market $135,000 Active 56 DOM
-
2026-06-08days on market $135,000 Active 55 DOM
-
2026-06-07days on market $135,000 Active 54 DOM
-
2026-06-04days on market $135,000 Active 51 DOM
-
2026-06-03days on market $135,000 Active 50 DOM
-
2026-06-02days on market $135,000 Active 49 DOM
-
2026-06-01days on market $135,000 Active 48 DOM
-
2026-05-31days on market $135,000 Active 47 DOM
-
2026-05-12price $135,000 780-char remark
Show marketing remark (780 chars)
Welcome to this 3-bedroom, 1-bath home full of potential and ready for your personal touch! This property offers a great opportunity for investors, flippers, or buyers looking to customize their dream home. Featuring a functional layout, spacious living area, and solid structure, it’s the perfect canvas for updates and improvements. Situated on a generous lot with ample outdoor space, there’s plenty of room to enhance curb appeal or expand. Conveniently located near major highways, shopping, dining, and schools, this home combines location with opportunity. Whether you’re looking to renovate and resell or create long-term rental income, this property is priced to sell and packed with potential. Don’t miss your chance to bring your vision to life!
-
2026-04-14$140,000 Active 780-char remark
Show marketing remark (780 chars)
Welcome to this 3-bedroom, 1-bath home full of potential and ready for your personal touch! This property offers a great opportunity for investors, flippers, or buyers looking to customize their dream home. Featuring a functional layout, spacious living area, and solid structure, it’s the perfect canvas for updates and improvements. Situated on a generous lot with ample outdoor space, there’s plenty of room to enhance curb appeal or expand. Conveniently located near major highways, shopping, dining, and schools, this home combines location with opportunity. Whether you’re looking to renovate and resell or create long-term rental income, this property is priced to sell and packed with potential. Don’t miss your chance to bring your vision to life!
ⓘ Source: listings_history table (triggers on properties + properties_extension) + one-shot
backfill from property_details.listing_events for pre-trigger history.
Tax reassessment forecast TX · Resets to sale price
- Current annual tax
- $3,573 · $298/mo
- Projected year-2 tax
- $3,573 · $298/mo
- Expected delta
- $0/yr ($0/mo · 0.0%)
ⓘ Screening estimate from a state-policy table — verify with the county assessor before closing.
Climate risk First Street
- Flood 1/10 Low FEMA zone X (unshaded) · 0% chance over 30 yrs
- Wildfire 4/10 Moderate
- Heat 8/10 Severe 7 d/yr ≥109°F today · 22 d/yr by 30 yrs out
- Wind 8/10 Severe 80% chance of damaging wind over 30 yrs
- Air quality 2/10 Low 0 unhealthy d/yr today · 2 by 30 yrs out
Nearby sold comps map
Loading sold comps map…
Walkable amenities ~0.75 mi
Loading nearby amenities…
Taxation est. · year 1
- Rental income
- $17,677
- − Mortgage interest
- −$7,562
- − Property taxes
- −$3,573
- − Insurance
- −$675
- − Repairs & maintenance
- −$1,414
- − Management
- −$1,414
- − Depreciation
- −$3,927
- Taxable loss
- −$888
- Est. tax savings @ 24.0%
- +$213
- After-tax cash flow
- $1,435/yr
For passive investors: Depreciation is non-cash, so a rental often shows a tax loss while cash-flowing — sheltering income. Rental losses are passive: they offset passive income freely, and up to $25,000/yr can offset ordinary (W-2) income if you actively participate and your MAGI is under $100k (phasing out to $0 by $150k); unused losses carry forward. On sale, claimed depreciation is recaptured at up to 25%, and gains may owe capital-gains tax (a 1031 exchange can defer both). Figures are a year-1 estimate at your 24.0% rate — not tax advice; consult a CPA.
Schools (NCES district)
- District
- San Antonio ISD
- NCES district ID
- 4838730
- Math proficiency
- 12% ▼ -21.00%
- Reading proficiency
- 22% ▼ -7.00%
- Median HH income
- $30,952
- Composite
- 13.57/100
- National rank
- #9512
- State rank
- #805 of 826 in TX
Livability — San Antonio
- Score
- 80/100
- State rank
- #31
- US rank
- #1616
Category grades
Schools grade is shown separately in the Schools card above.
Census & demographics
- Census place
- San Antonio, TX
- County
- Bexar County · 1,990,555 people
- City population
- 1,806,925
- Metro
- San Antonio-New Braunfels, TX
- Population (ZIP)
- 58,983
- Household income
- $52,088
- Rent vs Own
- Severe rent burden
- 2809.0
Population outlook (Bexar County) Hauer SSP2
- Today (2025)
- 2,336,851 people
- By 2030
- 2,560,728 · +9.6%
- By 2040
- 3,020,569 · +29.3%
- By 2050
- 3,493,522 · +49.5%
- By 2075
- 4,668,459 · +99.8%
- By 2100
- 5,533,242 · +136.8%
Race, ethnicity, and origin ACS 2023
- Neighborhood character
- Predominantly Hispanic (76%)
- Race & ethnicity
- Hispanic / Latino 76% Two or more races 28% White 16% Black 5% Asian 2% Native American 1%
- Hispanic origin (detail)
- Mexican 67%
- Common ancestry
- Lithuanian 2% Romanian 1% Slovak 1%
- Foreign-born
- 10% · Canada, Vietnam
- Languages at home
- 63% English-only · Spanish 36%
Political lean MEDSL · Bexar
- 2024 margin
- Lean D (+9.8) · D 54.3% · R 44.6% · Other 1.1%
- 2008→2024 swing
- +4.2pp toward D · 2008: 5.6pp · 2024: 9.8pp
- All cycles
- 2024: D+9.8 2020: D+18.2 2016: D+13.5 2012: D+4.6 2008: D+5.6
Not yet ingested
- Civics
- —
Market trends
- HPI YoY
- ▼ -52.06%
- Current HPI
- 265.2235
- Rent YoY
- ▼ -3.36%
- Metro
- San Antonio-New Braunfels, TX
- State GDP YoY
- ▲ 3.95%
- F500 in state
- 110
Industry mix (Fortune 500 HQ in TX)
| Industry | F500 HQs | Revenue |
|---|---|---|
| Energy | 16 | $1,198B |
|
||
| Technology | 5 | $198B |
|
||
| Engineering / Construction | 4 | $72B |
|
||
| Energy Services | 3 | $60B |
|
||
| Utilities | 3 | $41B |
|
||
| Healthcare | 2 | $330B |
|
||
Price history
-3.6% since first listed2 events — show timeline
- 2026-05-12 Price Changed $135,000 Unlock MLS
- 2026-04-14 Listed $140,000 Unlock MLS
Property tax history
+5.1%/yrLatest (2025): $3,573 · +10.0% YoY. Source: county tax records.
Cash-flow waterfall
monthlySold comps — $/sqft
last 12 mo · ≤1 miLoading sold comps…