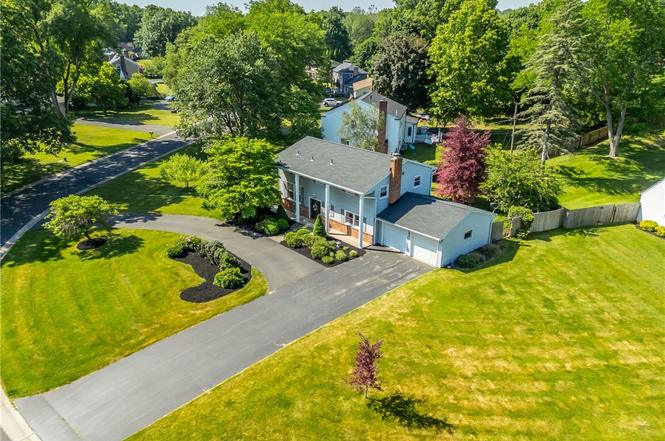
52 Parkridge Dr · Pittsford, NY
Flood risk 1/10 · Minimal
- FEMA flood zone
- X (unshaded)
- Chance of flooding over 30 yrs
- 0.0%
- Est. flood insurance / yr
- $473 – $860
Fire risk 1/10 · Minimal
- Est. fire insurance / yr
- $691 – $1,283
Heat risk 2/10 · Minimal
- Hot days now (above 95°F)
- 7 days/yr
- Hot days in 30 yrs
- 16 days/yr
Wind risk 1/10 · Minimal
- Chance of severe wind over 30 yrs
- —
Air-quality risk 2/10 · Minimal
- Unhealthy air days now
- 1 days/yr
- Unhealthy air days in 30 yrs
- 1 days/yr
Risk factors via First Street. Map © Google.
Why this score? — see what drove the D+ grade
The composite is a weighted blend of 9 inputs, each scored 0–100. Each bar is that input's sub-score; the figure is the points it added to the 100-point composite (weight × sub-score).
- ARV discount +15.0/15.0
- Cash flow +9.5/30.0
- Schools +7.5/10.0
- Livability +4.7/5.0
- 1% rule +3.9/10.0
- DSCR +2.7/10.0
- Rent growth +2.5/5.0
- Condition / age +2.5/5.0
- Appreciation +0.0/10.0
$349,900
🖨 Deal sheet 📄 Offer letter ✓ Due diligence
Listing remarks
WELCOME TO 52 PARKRIDGE DRIVE! Meticulously cared for by its original owners since 1965, this classic Pittsford split-level is officially ready for its next chapter. Set in one of Pittsford's most established, neighborhood-focused settings, this property offers an unparalleled location with immediate access to local recreation and everyday conveniences. You are ideally situated just moments from the scenic trails of Powder Mills Park, in close proximity to Park Road Elementary School, and right down the street from the YMCA Camp Arrowhead. True pride of ownership shines through in the excellent structural care, featuring a newer central A/C system, updated mechanics, and vinyl replacement w
Key facts
- Spacious yard
- Premier location
- Circular driveway
Tags
Property features AI
Exterior
- Parking: Attached 2-car garage; Circular driveway
- Utilities: Public water connected; Sewer connected
- Home design: 3-story home; Existing construction
- Construction: Vinyl siding; Asphalt roof; Block foundation; Resale condition
- Exterior features: Blacktop driveway; Patio; Pie-shaped residential lot; Lot dimensions approximately 136 x 138; City street frontage
Interior
- Kitchen: Dishwasher; Disposal; Refrigerator; Eat-in kitchen
- Bedrooms: Bedrooms not specified
- Flooring: Carpet; Hardwood; Tile; Varied flooring
- Bathrooms: 2 full bathrooms; 1 half bathroom; 1 main-level bathroom
- Heating & cooling: Gas forced-air heating; Central air conditioning
- Interior features: Separate/formal dining room; Entrance foyer; Eat-in kitchen; Separate/formal living room; Primary bedroom with private bath; Partial basement; Recreation room; Family room; Living room; Basement
- Laundry & utility: Washer; Dryer; Gas water heater
Neighborhood map
What this means for you Summary
Snapshot
- This is a 4-bed/2.5-bath single-family listed at $350k.
Deal economics
- At list price, monthly cash flow is $-245 ($-3k/yr) — negative.
- To cash-flow at today's rent, offer at most $307k (12.4% below list).
- To meet the 1% rule (rent ≥ 1% of price), the offer needs to be $311k (11.0% below list).
- Recommended offer: $307k (12.4% below list) — sets the bar for cash-flow.
- Cap rate 5.5% vs local median 2.5% in Pittsford — top-decile yield for the area; either an underpriced asset or a hidden risk that comps aren't pricing in. Stress-test before assuming the spread holds.
Location & tenants
- Location reads 94/100 on livability (#1 in NY, #10 nationally) — a professional / high-income tenant draw. Strengths: schools A+, crime A+, commute A+; Watch: cost of living D.
- Pittsford Central School District (suburban): math 80% / reading 84% proficiency, ranked #34 of 590 in NY (top 6%) — strong family-tenant draw, lease renewals of 3-5y typical; only 2% free/reduced lunch — higher-income household profile.
- Market conditions: 186 active listings in the ZIP; 1 comparable units currently listed for rent nearby; high-income renter base; 1,169 units permitted in Monroe County in 2024 (591 in 5+ unit buildings).
Forward outlook
- Local home prices are declining (-3.0%/yr); year-one equity from $2k of loan paydown is wiped out by about $10k of value loss. Plan a longer hold.
- Monroe County population projected to shrink 6% by 2050 — rents likely to lag national; underwrite the cash flow, not the appreciation.
Negotiation context
- Only 7 days on market — expect competitive offers; lowballing is unlikely to land.
Questions for the listing agent
- What do current leases actually rent for vs. the listed asking? Can we see a recent rent roll and the last 12 months of T-12 income?
- Built in 1965 — when were the roof, HVAC, electrical panel, plumbing, and water heater last replaced?
- Is there a deadline driving the sale (1031 exchange, divorce, estate, relocation)? That informs how much negotiation room exists.
- Schools are A-rated — typically a magnet for longer-tenancy family renters. What's the average tenant stay here, and is there a school-zone premium baked into asking?
- The area grade is low — what's the realistic commute time and amenity access for the typical tenant pool here? Any planned neighborhood developments (good or bad) we should know about?
- What's the average days-on-market for RENTAL listings here right now (not sales)? A rising rental-DOM trend means longer vacancies and softer asking-rent achievability than the comps imply.
- What's the recent tenant-quality profile in this submarket — average credit score on applications, eviction rate, late-payment / NSF rate, and stable-employment percentage? A property-management company in the area should have these aggregated.
- How much new for-sale + rental construction is in the pipeline within 1–3 miles? Heavy new supply typically softens prices + rents 12–24 months out; constrained supply supports both.
Investment metrics
- 1% rule
- 0.89% ✗
- Cap rate
- 5.45%
- Cash-on-cash
- -3.00%
- DSCR
- 0.87
- GRM
- 9.4
CMA / ARV
- ARV (on-the-fly)
- $436,500
- Comps found
- 12
Show comp detail 12 sales within ~0.75 mi
| Address | Dist | Beds/Ba | Sqft | Sold | Price | $/sf | Match |
|---|---|---|---|---|---|---|---|
| 2 Preston Cir | 0.15mi | 4/2.0 | 1,854 (-4%) | 0mo | $485,000 | $262 | 83 |
| 28 Railroad Mills Rd | 0.22mi | 4/2.5 | 1,968 (+1%) | 9mo | $390,000 | $198 | 80 |
| 2 Park Bluff Way | 0.08mi | 4/2.5 | 2,138 (+10%) | 5mo | $399,900 | $187 | 75 |
| 16 Musket Ln | 0.42mi | 5/2.5 (+1) | 1,944 (+0%) | 0mo | $490,500 | $252 | 75 |
| 343 East St | 0.67mi | 4/2.0 | 1,936 (-0%) | 6mo | $435,000 | $225 | 61 |
| 25 Kurt Rd | 0.65mi | 4/2.5 | 1,886 (-3%) | 8mo | $405,000 | $215 | 59 |
| 29 Rosewood Dr | 0.48mi | 4/1.5 | 2,069 (+7%) | 7mo | $484,000 | $234 | 57 |
| 5 Sugarwood Dr | 0.58mi | 4/2.5 | 1,764 (-9%) | 2mo | $505,000 | $286 | 57 |
| 2 Burr Oak Dr | 0.62mi | 4/2.5 | 2,040 (+5%) | 10mo | $518,000 | $254 | 54 |
| 1 Mill Valley Rd | 0.58mi | 5/2.5 (+1) | 2,076 (+7%) | 8mo | $405,000 | $195 | 50 |
| 308 Thornell Rd | 0.64mi | 4/2.5 | 1,764 (-9%) | 9mo | $365,000 | $207 | 47 |
| 373 East St | 0.62mi | 5/2.5 (+1) | 2,195 (+13%) | 8mo | $420,000 | $191 | 38 |
Match score weights: distance 35% · size 25% · config 20% · recency 20%. Top-matched comps best support the ARV.
Projected returns pro-forma
-3.0% appreciation · 3.0% rent growth · sell at horizon
- IRR
- -21.2%
- Equity multiple
- 0.26×
- Total profit
- $-72,071
- Equity at exit
- $52,171
- IRR
- -14.6%
- Equity multiple
- 0.16×
- Total profit
- $-81,934
- Equity at exit
- $30,253
Cash invested: $97,972 (down + closing). Projections, not guarantees.
Landlord ↔ Tenant lean methodology
- Overall (STATE)
- 15 Strongly Tenant-Friendly
- State New York
- 15 Strongly Tenant-Friendly · D+10
- County
- — inherits STATE
- City
- — inherits STATE
ZIP-level market 14534
- Active inventory
- 186
- Price-to-rent
- 9.4×
Monthly cashflow live
- Estimated rent
- $3,114 medium interval (Pro) →
- Mortgage (P&I)
- −$1,835
- Tax from tax record
- −$724 /mo · $8,688/yr
- Insurance
- −$146
- HOA
- −$0
- Vacancy / Maint / Mgmt
- −$654
- Net cashflow
- $-245
Break-even live
UW: 25.0% down · 7.5% · 30yr · 1.5% tax · 5.0% vac · 8.0% maint · 8.0% mgmt
Financing live
Cash to close
- Down payment
- $87,475
- Closing costs
- $10,497
- Reserves months
- —
- Total cash needed
- —
Loan-product check · same deal, 3 products live
Conventional
25% down · 7.5% · 30yr
- Down + closing
- —
- Monthly P&I
- —
- Monthly cashflow
- —
- DSCR
- —
- Eligible?
- —
Personal DTI + credit; lowest rate.
DSCR
20% down · 8.5% · 30yr
- Down + closing
- —
- Monthly P&I
- —
- Monthly cashflow
- —
- DSCR
- —
- Eligible?
- —
No personal income docs; deal must DSCR.
Hard money
10% down · 12.0% · 12mo
- Down + closing
- —
- Monthly P&I
- —
- Monthly cashflow
- —
- DSCR
- —
- Eligible?
- —
Short-term bridge; refi at stabilization.
Rent comps 1 comps
| Address | Beds | Baths | Sqft | Rent | $/sqft | DOM | Units | Dist |
|---|---|---|---|---|---|---|---|---|
| 23 Musket Ln Unit NA Pittsford, NY | 4.0 | 2.5 | 2058 | $2,900 | $1.41 | 23d | 1 | 0.44mi |
Listing history 8 events
-
2026-06-17status $349,900 Pending 7 DOM
-
2026-06-17days on market $349,900 Active 7 DOM
-
2026-06-16days on market $349,900 Active 6 DOM
-
2026-06-15days on market $349,900 Active 5 DOM
-
2026-06-13remarks 699-char remark
-
2026-06-13days on market $349,900 Active 3 DOM
-
2026-06-13remarks 693-char remark
-
2026-06-13$349,900 Active 2 DOM
ⓘ Source: listings_history table (triggers on properties + properties_extension) + one-shot
backfill from property_details.listing_events for pre-trigger history.
Tax reassessment forecast NY · Partial reset (capped growth)
- Current annual tax
- $8,688 · $724/mo
- Projected year-2 tax
- $8,688 · $724/mo
- Expected delta
- $0/yr ($0/mo · 0.0%)
ⓘ Screening estimate from a state-policy table — verify with the county assessor before closing.
Climate risk First Street
- Flood 1/10 Low FEMA zone X (unshaded) · 0% chance over 30 yrs
- Wildfire 1/10 Low
- Heat 2/10 Low 7 d/yr ≥95°F today · 16 d/yr by 30 yrs out
- Wind 1/10 Low
- Air quality 2/10 Low 1 unhealthy d/yr today · 1 by 30 yrs out
Nearby sold comps map
Loading sold comps map…
Walkable amenities ~0.75 mi
Loading nearby amenities…
Taxation est. · year 1
- Rental income
- $37,364
- − Mortgage interest
- −$19,600
- − Property taxes
- −$8,688
- − Insurance
- −$1,750
- − Repairs & maintenance
- −$2,989
- − Management
- −$2,989
- − Depreciation
- −$10,179
- Taxable loss
- −$8,830
- Est. tax savings @ 24.0%
- +$2,119
- After-tax cash flow
- $-819/yr
For passive investors: Depreciation is non-cash, so a rental often shows a tax loss while cash-flowing — sheltering income. Rental losses are passive: they offset passive income freely, and up to $25,000/yr can offset ordinary (W-2) income if you actively participate and your MAGI is under $100k (phasing out to $0 by $150k); unused losses carry forward. On sale, claimed depreciation is recaptured at up to 25%, and gains may owe capital-gains tax (a 1031 exchange can defer both). Figures are a year-1 estimate at your 24.0% rate — not tax advice; consult a CPA.
Schools (NCES district)
- District
- Pittsford Central School District
- NCES district ID
- 3623160
- Math proficiency
- 80% ▼ -4.00%
- Reading proficiency
- 84% ▲ 7.00%
- Median HH income
- $106,940
- Composite
- 74.75/100
- National rank
- #151
- State rank
- #34 of 590 in NY
Livability — Pittsford
- Score
- 94/100
- State rank
- #1
- US rank
- #10
Category grades
Schools grade is shown separately in the Schools card above.
Census & demographics
- County
- Monroe County · 674,131 people
- City population
- 33,230
- Metro
- Rochester, NY
- Population (ZIP)
- 33,230
- Household income
- $143,694
- Rent vs Own
- Severe rent burden
- 398.0
Population outlook (Monroe County) Hauer SSP2
- Today (2025)
- 759,460 people
- By 2030
- 757,154 · -0.3%
- By 2040
- 740,644 · -2.5%
- By 2050
- 714,443 · -5.9%
- By 2075
- 645,883 · -15.0%
- By 2100
- 547,084 · -28.0%
Race, ethnicity, and origin ACS 2023
- Neighborhood character
- Predominantly White (81%)
- Race & ethnicity
- White 81% Asian 8% Two or more races 6% Hispanic / Latino 4% Black 2%
- Common ancestry
- Romanian 5% Italian 4% Lithuanian 3%
- Foreign-born
- 12% · Canada, China, South Korea
- Languages at home
- 87% English-only · Other Indo-European 3% Chinese 2% Spanish 2%
Political lean MEDSL · Monroe
- 2024 margin
- D (+19.1) · D 59.5% · R 40.5%
- 2008→2024 swing
- +1.4pp toward D · 2008: 17.7pp · 2024: 19.1pp
- All cycles
- 2024: D+19.1 2020: D+21.0 2016: D+14.1 2012: D+17.4 2008: D+17.7
Not yet ingested
- Civics
- —
Market trends
- HPI YoY
- ▼ -232.40%
- Current HPI
- 258.0726
- Rent YoY
- —
- Metro
- Rochester, NY
- State GDP YoY
- ▲ 2.60%
- F500 in state
- 92
Industry mix (Fortune 500 HQ in NY)
| Industry | F500 HQs | Revenue |
|---|---|---|
| Financial Services | 10 | $950B |
|
||
| Consumer Goods | 9 | $162B |
|
||
| Insurance | 4 | $225B |
|
||
| Telecommunications | 2 | $144B |
|
||
| Pharmaceuticals | 2 | $112B |
|
||
| Media / Entertainment | 2 | $69B |
|
||
Price history
1 event — show timeline
- 2026-06-10 Listed $349,900 UNYREIS
Property tax history
+2.4%/yrLatest (2025): $8,688 · +10.4% YoY. Source: county tax records.
Cash-flow waterfall
monthlySold comps — $/sqft
last 12 mo · ≤1 miLoading sold comps…