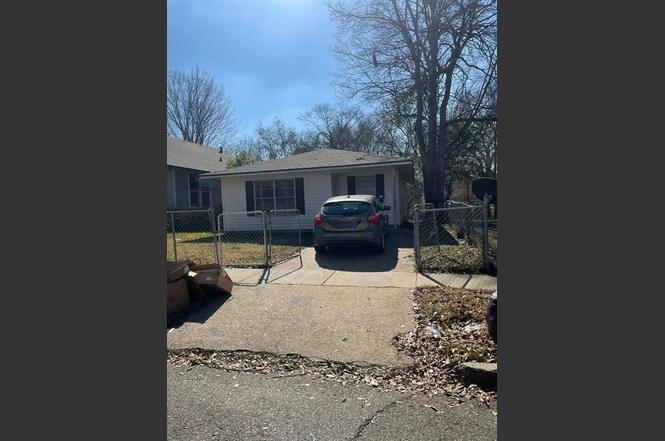
3117 Frederick St · Shreveport, LA
Flood risk 1/10 · Minimal
- FEMA flood zone
- X (unshaded)
- Chance of flooding over 30 yrs
- 0.0%
- Est. flood insurance / yr
- $507 – $1,088
Fire risk 1/10 · Minimal
- Est. fire insurance / yr
- $1,269 – $2,357
Heat risk 7/10 · Major
- Hot days now (above 110°F)
- 7 days/yr
- Hot days in 30 yrs
- 21 days/yr
Wind risk 6/10 · Moderate
- Chance of severe wind over 30 yrs
- 64.0%
Air-quality risk 2/10 · Minimal
- Unhealthy air days now
- 1 days/yr
- Unhealthy air days in 30 yrs
- 1 days/yr
Risk factors via First Street. Map © Google.
Why this score? — see what drove the C+ grade
The composite is a weighted blend of 9 inputs, each scored 0–100. Each bar is that input's sub-score; the figure is the points it added to the 100-point composite (weight × sub-score).
- Cash flow +30.0/30.0
- 1% rule +10.0/10.0
- DSCR +10.0/10.0
- Appreciation +4.4/10.0
- Livability +3.0/5.0
- Rent growth +2.5/5.0
- Condition / age +2.5/5.0
- Schools +2.2/10.0
- ARV discount +0.0/15.0
$43,000
🖨 Deal sheet 📄 Offer letter ✓ Due diligence
Listing remarks
A 3 Bed 1 Bath property in Shreveport, Louisiana. Comes with a spacious eat-in kitchen, large living area, central air and heating, washer and dryer hookups, a large backyard, and a carport. This property is rented for $750 per month. This is a great opportunity for any owner, occupant, or buyer looking to expand their rental portfolio. This is part of a large portfolio. Please see the agent for details.
Key facts
- Large living area
- Large backyard
- Carport
Tags
Property features AI
Finance
- HOA & community: No association
Exterior
- Parking: 1 covered parking space; 1 carport space; Other parking features
- Utilities: City water; City sewer; Not in a municipal utility district
- Home design: Single-family residence; Residential property; Built in 1985; One story
- Construction: Year built: 1985
- Exterior features: Lot under 0.5 acre (approximately 0.11 acre); Subdivision: Queensborough
Interior
- Kitchen: Other appliances
- Bedrooms: 3 bedrooms (primary bedroom on level 1)
- Bathrooms: 1 full bathroom
- Heating & cooling: Central heating; Central air conditioning
- Interior features: One-level layout; 1 living area; 1 dining area; Other interior features
- Laundry & utility: Washer hookup
Neighborhood map
What this means for you Summary
Snapshot
- This is a 3-bed/1.0-bath single-family listed at $43k.
Deal economics
- At list price, monthly cash flow is $394 ($5k/yr) — positive.
- The deal already cash-flows at list — no discount required.
- Meets the 1% rule at list price ($840 rent vs $43k).
- Cap rate 17.3% vs local median 5.7% in Shreveport — top-decile yield for the area; either an underpriced asset or a hidden risk that comps aren't pricing in. Stress-test before assuming the spread holds.
Location & tenants
- Location reads 59/100 on livability (#270 in LA) — a working-class tenant base; expect higher turnover. Strengths: cost of living A+, housing A; Watch: schools D+, crime F, amenities F.
- Caddo Parish (urban): math 21% / reading 32% proficiency, ranked #53 of 98 in LA (top 54%) — low school quality limits family demand, transient renter base, plan for 1-2y turnover; 64% free/reduced lunch — lower-income household profile, screen leases tightly.
- Market conditions: 123 active listings in the ZIP; 24 comparable units currently listed for rent nearby; rentals at typical pace (median 21d on market — plan ~3-4 weeks tenant-placement turnaround); 42% of comp listings sitting > 30 days — soft ceiling on asking rent; lower-income renter base — watch delinquency; 221 units permitted in Caddo Parish in 2024 (0 in 5+ unit buildings).
- This rent runs 31% of the median local income ($33k/yr) — at the standard rent-burdened threshold; future hikes will face affordability resistance.
Forward outlook
- Local home prices are declining (-1.2%/yr); year-one equity from $297 of loan paydown is wiped out by about $508 of value loss. Plan a longer hold.
- Caddo County population projected at -15% by 2050 — secular population decline; favor cash flow + early exit over multi-decade hold.
- At projected returns (-1.2% appreciation + 3.0% rent growth), your $12k cash investment doubles in ~3 years — after that, you're playing with house money.
Negotiation context
- Only 3 days on market — expect competitive offers; lowballing is unlikely to land.
- 2 sale attempts with the ask held roughly flat each time — persistent listings suggest the price (not the market) is what's stuck; bring a comps-based counter.
Risks & watch-outs
- Climate carrying-cost: major wind risk, 64% chance of damaging wind over 30y; extreme-heat days projected 7→21/yr by 2055 (HVAC capex compounding) — expect insurance premiums to compound above CPI over the hold.
Questions for the listing agent
- Is there a deadline driving the sale (1031 exchange, divorce, estate, relocation)? That informs how much negotiation room exists.
- Schools are D-rated, which usually means shorter tenancies and higher turnover. Who's the typical renter profile here, and what's been the actual vacancy rate?
- Crime grade is F in this area — have there been break-ins, vandalism, or insurance claims at this property in the last 3 years? What carrier currently insures it and at what premium?
- What's the average days-on-market for RENTAL listings here right now (not sales)? A rising rental-DOM trend means longer vacancies and softer asking-rent achievability than the comps imply.
- What's the recent tenant-quality profile in this submarket — average credit score on applications, eviction rate, late-payment / NSF rate, and stable-employment percentage? A property-management company in the area should have these aggregated.
- How much new for-sale + rental construction is in the pipeline within 1–3 miles? Heavy new supply typically softens prices + rents 12–24 months out; constrained supply supports both.
Investment metrics
- 1% rule
- 1.95% ✓
- Cap rate
- 17.28%
- Cash-on-cash
- 39.25%
- DSCR
- 2.75
- GRM
- 4.3
CMA / ARV
- ARV (on-the-fly)
- $36,564
- Comps found
- 12
Show comp detail 12 sales within ~0.75 mi
| Address | Dist | Beds/Ba | Sqft | Sold | Price | $/sf | Match |
|---|---|---|---|---|---|---|---|
| 2824 W Caperton St | 0.50mi | 2/1.0 (-1) | 1,100 (-1%) | 2mo | $60,900 | $55 | 69 |
| 3501 Hardy St | 0.40mi | 2/1.0 (-1) | 1,150 (+4%) | 2mo | $25,000 | $22 | 68 |
| 3147 Milton St | 0.12mi | 2/1.0 (-1) | 951 (-14%) | 1mo | $31,000 | $33 | 65 |
| 3240 Jackson St | 0.35mi | 2/1.0 (-1) | 1,014 (-8%) | 7mo | $34,900 | $34 | 59 |
| 1821 Dolphine | 0.74mi | 2/1.0 (-1) | 1,100 (-1%) | 4mo | $19,000 | $17 | 56 |
| 3218 Sumner St | 0.39mi | 3/1.0 | 1,253 (+13%) | 6mo | $22,000 | $18 | 55 |
| 3560 Lillian St | 0.56mi | 3/1.0 | 1,229 (+11%) | 2mo | $40,000 | $33 | 54 |
| 2631 Lillian St | 0.52mi | 3/2.0 | 1,227 (+11%) | 6mo | $125,000 | $102 | 48 |
| 3528 Lakeshore Dr | 0.56mi | 3/1.0 | 1,270 (+15%) | 2mo | $85,000 | $67 | 48 |
| 3727 Judson St | 0.65mi | 3/1.0 | 988 (-11%) | 9mo | $18,500 | $19 | 44 |
| 3532 Sumner St | 0.55mi | 4/2.0 (+1) | 1,221 (+10%) | 8mo | $45,000 | $37 | 42 |
| 3615 Lakeshore Dr | 0.61mi | 2/1.0 (-1) | 965 (-13%) | 6mo | $23,500 | $24 | 40 |
Match score weights: distance 35% · size 25% · config 20% · recency 20%. Top-matched comps best support the ARV.
Projected returns pro-forma
-1.18% appreciation · 3.0% rent growth · sell at horizon
- IRR
- 38.4%
- Equity multiple
- 2.78×
- Total profit
- $21,488
- Equity at exit
- $10,007
- IRR
- 42.9%
- Equity multiple
- 5.50×
- Total profit
- $54,134
- Equity at exit
- $10,194
Cash invested: $12,040 (down + closing). Projections, not guarantees.
Landlord ↔ Tenant lean methodology
- Overall (STATE)
- 90 Strongly Landlord-Friendly
- State Louisiana
- 90 Strongly Landlord-Friendly · R+12
- County
- — inherits STATE
- City
- — inherits STATE
ZIP-level market 71109
- Home prices YoY
- -2.1%
- Active inventory
- 123
- Price-to-rent
- 4.3×
Monthly cashflow live
- Estimated rent
- $840 high interval (Pro) →
- Mortgage (P&I)
- −$225
- Tax from tax record
- −$26 /mo · $318/yr
- Insurance
- −$18
- HOA
- −$0
- Vacancy / Maint / Mgmt
- −$176
- Net cashflow
- $394
Break-even live
UW: 25.0% down · 7.5% · 30yr · 1.5% tax · 5.0% vac · 8.0% maint · 8.0% mgmt
Financing live
Cash to close
- Down payment
- $10,750
- Closing costs
- $1,290
- Reserves months
- —
- Total cash needed
- —
Loan-product check · same deal, 3 products live
Conventional
25% down · 7.5% · 30yr
- Down + closing
- —
- Monthly P&I
- —
- Monthly cashflow
- —
- DSCR
- —
- Eligible?
- —
Personal DTI + credit; lowest rate.
DSCR
20% down · 8.5% · 30yr
- Down + closing
- —
- Monthly P&I
- —
- Monthly cashflow
- —
- DSCR
- —
- Eligible?
- —
No personal income docs; deal must DSCR.
Hard money
10% down · 12.0% · 12mo
- Down + closing
- —
- Monthly P&I
- —
- Monthly cashflow
- —
- DSCR
- —
- Eligible?
- —
Short-term bridge; refi at stabilization.
Rent comps 24 comps
| Address | Beds | Baths | Sqft | Rent | $/sqft | DOM | Units | Dist |
|---|---|---|---|---|---|---|---|---|
| 3323 Darien St Shreveport, LA | 3.0 | 1.0 | 1200 | $785 | $0.65 | 43d | 1 | 0.31mi |
| 3240 Jackson St Shreveport, LA | 2.0 | 1.0 | 1014 | $700 | $0.69 | 13d | 1 | 0.33mi |
| 3022 Lillian St Shreveport, LA | 2.0 | 1.0 | 1115 | $695 | $0.62 | 21d | 1 | 0.35mi |
| 3420 Darien St Shreveport, LA | 2.0 | 1.0 | 1200 | $665 | $0.55 | 13d | 1 | 0.38mi |
| 3515 Stonewall St Shreveport, LA | 2.0 | 1.0 | 1000 | $600 | $0.60 | 13d | 1 | 0.41mi |
| 3628 Sumner St Shreveport, LA | 3.0 | 1.0 | 956 | $950 | $0.99 | 44d | 1 | 0.64mi |
| 3612 Michigan Blvd Shreveport, LA | 2.0 | 1.0 | 1200 | $615 | $0.51 | 13d | 1 | 0.81mi |
| 3101 Harp St Shreveport, LA | 3.0 | 1.0 | 839 | $850 | $1.01 | 21d | 1 | 0.82mi |
| 2551 Claiborne Ave Shreveport, LA | 2.0 | 1.5 | 1202 | $945 | $0.79 | 13d | 1 | 0.83mi |
| 2134 Queens Hwy Shreveport, LA | 3.0 | 1.5 | 1374 | $1,475 | $1.07 | 21d | 1 | 0.86mi |
| 2711 Thayer St Shreveport, LA | 4.0 | 1.0 | 1436 | $1,552 | $1.08 | 43d | 1 | 0.86mi |
| 3907 Milton St Shreveport, LA | 3.0 | 1.5 | 1275 | $1,100 | $0.86 | 43d | 1 | 0.87mi |
| 2924 DuPont St Shreveport, LA | 2.0 | 1.0 | 768 | $750 | $0.98 | 21d | 1 | 0.87mi |
| 2520 Merwin St Shreveport, LA | 3.0 | 1.0 | 924 | $700 | $0.76 | 21d | 1 | 0.89mi |
| 3902 Sumner St Shreveport, LA | 2.0 | 1.0 | 900 | $700 | $0.78 | 43d | 1 | 0.89mi |
| 2714 DuPont St Shreveport, LA | 2.0 | 1.0 | 980 | $565 | $0.58 | 13d | 1 | 0.92mi |
| 4223 Lakeshore Dr Shreveport, LA | 1.0–3.0 | 1.0–2.0 | 1002 | $900 | $0.90 | 43d | 1 | 1.00mi |
| 4122 Cherokee St Apt 4 Shreveport, LA | 2.0 | 1.0 | 750 | $850 | $1.13 | 21d | 1 | 1.00mi |
| 4122 Cherokee St Apt 4 Shreveport, LA | 2.0 | 1.0 | 960 | $850 | $0.89 | 43d | 1 | 1.00mi |
| 2042 Laurel St Shreveport, LA | 3.0 | 1.0 | 1100 | $800 | $0.73 | 43d | 1 | 1.02mi |
| 2712 Ashton St Shreveport, LA | 2.0 | 1.0 | 875 | $700 | $0.80 | 13d | 1 | 1.09mi |
| 1719 Lakeshore Dr Shreveport, LA | 3.0 | 1.5 | 1200 | $950 | $0.79 | 43d | 1 | 1.21mi |
| 2531 Drexel St Shreveport, LA | 3.0 | 2.0 | 1250 | $950 | $0.76 | 21d | 1 | 1.38mi |
| 509 Alabama Ave SE Shreveport, LA | 2.0 | 1.0 | 700 | $700 | $1.00 | 43d | 1 | 1.39mi |
Listing history 4 events
-
2026-06-18days on market $43,000 Active 3 DOM
-
2026-06-17days on market $43,000 Active 2 DOM
-
2026-06-15remarks 407-char remark
-
2026-06-15$43,000 Active 1 DOM
ⓘ Source: listings_history table (triggers on properties + properties_extension) + one-shot
backfill from property_details.listing_events for pre-trigger history.
Tax reassessment forecast LA · Resets to sale price
- Current annual tax
- $318 · $26/mo
- Projected year-2 tax
- $318 · $26/mo
- Expected delta
- $0/yr ($0/mo · 0.0%)
ⓘ Screening estimate from a state-policy table — verify with the county assessor before closing.
Climate risk First Street
- Flood 1/10 Low FEMA zone X (unshaded) · 0% chance over 30 yrs
- Wildfire 1/10 Low
- Heat 7/10 Severe 7 d/yr ≥110°F today · 21 d/yr by 30 yrs out
- Wind 6/10 Major 64% chance of damaging wind over 30 yrs
- Air quality 2/10 Low 1 unhealthy d/yr today · 1 by 30 yrs out
Nearby sold comps map
Loading sold comps map…
Walkable amenities ~0.75 mi
Loading nearby amenities…
Taxation est. · year 1
- Rental income
- $10,081
- − Mortgage interest
- −$2,409
- − Property taxes
- −$318
- − Insurance
- −$215
- − Repairs & maintenance
- −$807
- − Management
- −$807
- − Depreciation
- −$1,251
- Taxable income
- $4,276
- Est. tax owed @ 24.0%
- −$1,026
- After-tax cash flow
- $3,699/yr
For passive investors: Depreciation is non-cash, so a rental often shows a tax loss while cash-flowing — sheltering income. Rental losses are passive: they offset passive income freely, and up to $25,000/yr can offset ordinary (W-2) income if you actively participate and your MAGI is under $100k (phasing out to $0 by $150k); unused losses carry forward. On sale, claimed depreciation is recaptured at up to 25%, and gains may owe capital-gains tax (a 1031 exchange can defer both). Figures are a year-1 estimate at your 24.0% rate — not tax advice; consult a CPA.
Schools (NCES district)
- District
- Caddo Parish
- NCES district ID
- 2200300
- Math proficiency
- 21% ▼ -33.00%
- Reading proficiency
- 32% ▼ -30.00%
- Median HH income
- $39,227
- Composite
- 22.23/100
- National rank
- #8148
- State rank
- #53 of 98 in LA
Livability — Shreveport
- Score
- 59/100
- State rank
- #270
- US rank
- #19730
Category grades
Schools grade is shown separately in the Schools card above.
Census & demographics
- Census place
- Shreveport, LA
- County
- Caddo Parish · 178,536 people
- City population
- 164,123
- Metro
- Shreveport-Bossier City, LA
- Population (ZIP)
- 17,412
- Household income
- $32,939
- Rent vs Own
- Severe rent burden
- 1265.0
Population outlook (Caddo County) Hauer SSP2
- Today (2025)
- 243,190 people
- By 2030
- 237,231 · -2.5%
- By 2040
- 222,502 · -8.5%
- By 2050
- 206,516 · -15.1%
- By 2075
- 165,706 · -31.9%
- By 2100
- 122,262 · -49.7%
Race, ethnicity, and origin ACS 2023
- Neighborhood character
- Predominantly Black (95%)
- Race & ethnicity
- Black 95% White 4%
- Common ancestry
- Lithuanian 1%
- Foreign-born
- 0%
Political lean MEDSL · Caddo
- 2024 margin
- Toss-up / Even · D 51.6% · R 47.0% · Other 1.4%
- 2008→2024 swing
- +1.6pp toward D · 2008: 3.0pp · 2024: 4.6pp
- All cycles
- 2024: D+4.6 2020: D+6.8 2016: D+4.2 2012: D+4.9 2008: D+3.0
Not yet ingested
- Civics
- —
Market trends
- HPI YoY
- ▼ -1.18%
- Current HPI
- 54.4158
- Rent YoY
- —
- Metro
- Shreveport-Bossier City, LA
- State GDP YoY
- ▲ 3.29%
- F500 in state
- 10
Industry mix (Fortune 500 HQ in LA)
| Industry | F500 HQs | Revenue |
|---|---|---|
| Telecommunications | 2 | $23B |
|
||
| Utilities | 1 | $12B |
|
||
| Wholesale / Distribution | 1 | $5B |
|
||
| Advertising | 1 | $2B |
|
||
Price history
3 events — show timeline
- 2026-06-02 Listed $43,000 NTREIS
- 2026-01-26 Rental Removed $750 TENANTTURNER2
- 2025-12-20 Listed for Rent $750 TENANTTURNER2
Property tax history
-1.7%/yrLatest (2025): $318 · +0.4% YoY. Source: county tax records.
Cash-flow waterfall
monthlySold comps — $/sqft
last 12 mo · ≤1 miLoading sold comps…