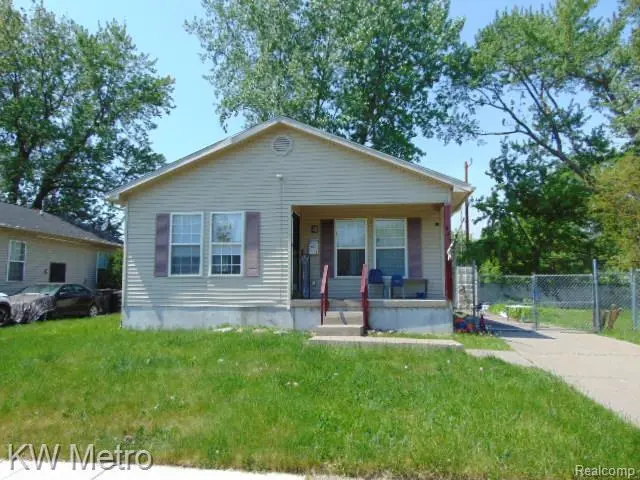
445 Navahoe St · Detroit, MI
Flood risk 6/10 · Moderate
- FEMA flood zone
- AE
- Chance of flooding over 30 yrs
- 0.75%
- Est. flood insurance / yr
- $2,026 – $9,024
Fire risk 1/10 · Minimal
- Est. fire insurance / yr
- $784 – $1,456
Heat risk 3/10 · Minor
- Hot days now (above 96°F)
- 7 days/yr
- Hot days in 30 yrs
- 15 days/yr
Wind risk 2/10 · Minimal
- Chance of severe wind over 30 yrs
- —
Air-quality risk 3/10 · Minor
- Unhealthy air days now
- 2 days/yr
- Unhealthy air days in 30 yrs
- 5 days/yr
Risk factors via First Street. Map © Google.
Why this score? — see what drove the B grade
The composite is a weighted blend of 9 inputs, each scored 0–100. Each bar is that input's sub-score; the figure is the points it added to the 100-point composite (weight × sub-score).
- Cash flow +30.0/30.0
- ARV discount +15.0/15.0
- DSCR +10.0/10.0
- 1% rule +8.5/10.0
- Livability +3.7/5.0
- Rent growth +2.5/5.0
- Condition / age +2.5/5.0
- Schools +1.3/10.0
- Appreciation +0.0/10.0
$100,000
🖨 Deal sheet (PDF) 📄 Offer letter ✓ Due diligence
Listing remarks MLS
3 bedroom ranch style home with full basement, newer furnace and water tank, central air and more. Located near Grayhaven, and Clairpointe. Just a short walk to the Detroit River and minutes from Downtown Detroit.
Key facts
- Newer furnace
- Ranch style home
- Full basement
Tags
Property features AI
Exterior
- Parking: No garage
- Utilities: Public water; Public sewer
- Home design: Single-family residence; One level; Entry at ground level
- Construction: Vinyl siding
- Exterior features: Paved road access; Lot dimensions approximately 52.5 x 100 (0.12 acre)
Interior
- Bathrooms: 1 full bathroom
- Heating & cooling: Central air; Ceiling fan(s); Forced air heating; Natural gas heating
- Interior features: Partially finished basement; Ground-level entry
Neighborhood map
What this means for you Summary
Snapshot
- This is a 3-bed/1.0-bath single-family listed at $100k.
Deal economics
- At list price, monthly cash flow is $-32 ($-378/yr) — negative.
- To cash-flow at today's rent, offer at most $94k (5.6% below list).
- Meets the 1% rule at list price ($1k rent vs $100k).
- Recommended offer: $94k (5.6% below list) — sets the bar for cash-flow.
Location & tenants
- Location reads 73/100 on livability (#218 in MI) — a middle-class / working-renter tenant base. Strengths: amenities A+, commute A+, cost of living A+; Watch: crime F, employment F.
- Detroit Public Schools Community District (urban): math 10% / reading 24% proficiency, ranked #499 of 540 in MI (top 92%) — low school quality limits family demand, transient renter base, plan for 1-2y turnover; 90% free/reduced lunch — lower-income household profile, screen leases tightly.
- Zoned schools: Charles Wright Academy of Arts And Science (math 10% / reading 10%, grade F, #1,230 of 1,397 statewide, top 91%, 618 students, 90% FRL); East English Village Preparatory Academy At Finney (math 10% / reading 10%, grade F, #659 of 713 statewide, top 97%, 697 students, 85% FRL) — zoned schools at 88% FRL track the district average.
- Market conditions: 137 active listings in the ZIP; 13 comparable units currently listed for rent nearby; rentals at typical pace (median 24d on market — plan ~3-4 weeks tenant-placement turnaround); 2,639 units permitted in Wayne County in 2024 (1,216 in 5+ unit buildings).
Forward outlook
- Local home prices are declining (-3.0%/yr); year-one equity from $691 of loan paydown is wiped out by about $3k of value loss. Plan a longer hold.
- Wayne County population projected at -17% by 2050 — secular population decline; favor cash flow + early exit over multi-decade hold.
Negotiation context
- It's been on market 33 days — a 3% lower offer ($97k) is reasonable based on typical stale-listing flexibility.
- 2 sale attempts with the ask held roughly flat each time — persistent listings suggest the price (not the market) is what's stuck; bring a comps-based counter.
- Current owner paid $60k; list at $100k implies a 68% gain — meaningful room to come down on a strong offer.
Risks & watch-outs
- Watch-outs: flood insurance adds $460/mo.
- Climate carrying-cost: in FEMA flood zone AE (mandatory federal flood insurance) — expect insurance premiums to compound above CPI over the hold.
Questions for the listing agent
- What do current leases actually rent for vs. the listed asking? Can we see a recent rent roll and the last 12 months of T-12 income?
- It's been on market 33 days. Have you received any prior offers? Is the seller open to a 6% concession, seller financing, or rate buy-down credit?
- What's the actual annual flood-insurance premium (NFIP or private), and is the property in a SFHA with mandatory coverage?
- Is there a deadline driving the sale (1031 exchange, divorce, estate, relocation)? That informs how much negotiation room exists.
- Schools are F-rated, which usually means shorter tenancies and higher turnover. Who's the typical renter profile here, and what's been the actual vacancy rate?
- Crime grade is F in this area — have there been break-ins, vandalism, or insurance claims at this property in the last 3 years? What carrier currently insures it and at what premium?
- What's the average days-on-market for RENTAL listings here right now (not sales)? A rising rental-DOM trend means longer vacancies and softer asking-rent achievability than the comps imply.
- What's the recent tenant-quality profile in this submarket — average credit score on applications, eviction rate, late-payment / NSF rate, and stable-employment percentage? A property-management company in the area should have these aggregated.
- How much new for-sale + rental construction is in the pipeline within 1–3 miles? Heavy new supply typically softens prices + rents 12–24 months out; constrained supply supports both.
Investment metrics
- 1% rule
- 1.35% ✓
- Cap rate
- 11.44%
- Cash-on-cash
- 18.38%
- DSCR
- 1.82
- GRM
- 6.2
CMA / ARV
- ARV (on-the-fly)
- $133,001
- Comps found
- 10
Show comp detail 10 sales within ~0.75 mi
| Address | Dist | Beds/Ba | Sqft | Sold | Price | $/sf | Match |
|---|---|---|---|---|---|---|---|
| 444 Conner St | 0.02mi | 3/1.0 | 1,148 (-2%) | 1mo | $130,000 | $113 | 94 |
| 462 Algonquin St | 0.08mi | 3/1.0 | 1,176 (-0%) | 20mo | $72,500 | $62 | 80 |
| 396 Lenox St | 0.35mi | 3/2.0 | 1,248 (+6%) | 1mo | $249,000 | $200 | 68 |
| 432 Eastlawn St | 0.54mi | 3/1.0 | 1,230 (+4%) | 2mo | $145,000 | $118 | 66 |
| 809 Algonquin St | 0.42mi | 3/1.0 | 1,300 (+10%) | 9mo | $67,500 | $52 | 56 |
| 265 Newport St | 0.64mi | 2/1.0 (-1) | 1,190 (+1%) | 10mo | $95,000 | $80 | 55 |
| 258 Piper Blvd | 0.56mi | 3/1.0 | 1,285 (+9%) | 4mo | $123,000 | $96 | 55 |
| 785 Algonquin St | 0.39mi | 3/1.0 | 1,101 (-6%) | 22mo | $25,000 | $23 | 52 |
| 191 Eastlawn St | 0.66mi | 3/2.0 | 1,278 (+9%) | 5mo | $249,000 | $195 | 47 |
| 13137 Averhill Ct | 0.37mi | 3/1.0 | 1,017 (-14%) | 20mo | $145,000 | $143 | 44 |
Match score weights: distance 35% · size 25% · config 20% · recency 20%. Top-matched comps best support the ARV.
Projected returns pro-forma
-3.0% appreciation · 3.0% rent growth · sell at horizon
- IRR
- -18.2%
- Equity multiple
- 0.36×
- Total profit
- $-17,942
- Equity at exit
- $14,910
- IRR
- -9.8%
- Equity multiple
- 0.39×
- Total profit
- $-17,112
- Equity at exit
- $8,646
Cash invested: $28,000 (down + closing). Projections, not guarantees.
Landlord ↔ Tenant lean methodology
- Overall (STATE)
- 62 Landlord-Friendly
- State Michigan
- 62 Landlord-Friendly · EVEN
- County
- — inherits STATE
- City
- — inherits STATE
ZIP-level market 48215
- Home prices YoY
- -24.1%
- Active inventory
- 137
- Price-to-rent
- 6.2×
Monthly cashflow live
- Estimated rent
- $1,349 high interval (Pro) →
- Mortgage (P&I)
- −$524
- Tax from tax record
- −$71 /mo · $848/yr
- Insurance
- −$42
- Flood insurance flood zone
- −$460 /mo · $5,525/yr
- HOA
- −$0
- Vacancy / Maint / Mgmt
- −$283
- Net cashflow
- $-32
Break-even live
Sensitivity live
| Price | -10% $25 | -5% $-3 | +0% $-32 | +5% $-60 | +10% $-88 |
|---|---|---|---|---|---|
| Rent | -10% $-138 | -5% $-85 | +0% $-32 | +5% $22 | +10% $75 |
| Rate | -1.0pp $19 | -0.5pp $-6 | base $-32 | +0.5pp $-57 | +1.0pp $-84 |
UW: 25.0% down · 7.5% · 30yr · 1.5% tax · 5.0% vac · 8.0% maint · 8.0% mgmt
Financing live
Cash to close
- Down payment
- $25,000
- Closing costs
- $3,000
- Reserves months
- —
- Total cash needed
- —
Loan-product check · same deal, 3 products live
Conventional
25% down · 7.5% · 30yr
- Down + closing
- —
- Monthly P&I
- —
- Monthly cashflow
- —
- DSCR
- —
- Eligible?
- —
Personal DTI + credit; lowest rate.
DSCR
20% down · 8.5% · 30yr
- Down + closing
- —
- Monthly P&I
- —
- Monthly cashflow
- —
- DSCR
- —
- Eligible?
- —
No personal income docs; deal must DSCR.
Hard money
10% down · 12.0% · 12mo
- Down + closing
- —
- Monthly P&I
- —
- Monthly cashflow
- —
- DSCR
- —
- Eligible?
- —
Short-term bridge; refi at stabilization.
Rent comps 13 comps
| Address | Beds | Baths | Sqft | Rent | $/sqft | DOM | Units | Dist |
|---|---|---|---|---|---|---|---|---|
| 13010 Avondale St Detroit, MI | 1.0–2.0 | 1.0–2.0 | 1003 | $1,725 | $1.72 | 0d | 1 | 0.33mi |
| 13329 Averhill Ct Unit 1 Detroit, MI | 2.0 | 1.0 | 1019 | $1,100 | $1.08 | 45d | 1 | 0.50mi |
| 1050 Lakewood St Unit 1S Detroit, MI | 2.0 | 1.0 | 896 | $1,100 | $1.23 | 45d | 1 | 0.94mi |
| 1050 Lakewood St Apt 1N Detroit, MI | 2.0 | 1.0 | 896 | $1,100 | $1.23 | 0d | 1 | 0.94mi |
| 875 Philip St Detroit, MI | 3.0 | 1.0 | 1353 | $1,400 | $1.03 | 45d | 1 | 1.00mi |
| 734 Ashland St Detroit, MI | 3.0 | 1.0 | 1110 | $1,300 | $1.17 | 24d | 1 | 1.07mi |
| 734 Ashland St Detroit, MI | 3.0 | 1.0 | 1110 | $1,300 | $1.17 | 26d | 1 | 1.07mi |
| 450 Marquette Dr Detroit, MI | 2.0 | 1.0 | 972 | $1,200 | $1.23 | 22d | 1 | 1.15mi |
| 15111 E Vernor Hwy Unit 6 Detroit, MI | 2.0 | 1.0 | 900 | $1,200 | $1.33 | 26d | 1 | 1.30mi |
| 861 Beaconsfield Ave Grosse Pointe Park, MI | 2.0 | 1.0 | 1300 | $1,500 | $1.15 | 14d | 1 | 1.32mi |
| 1042 Wayburn St Grosse Pointe Park, MI | 3.0 | 1.0 | 1000 | $1,575 | $1.57 | 7d | 1 | 1.33mi |
| 981 Beaconsfield Ave Grosse Pointe Park, MI | 2.0 | 1.0 | 1000 | $1,095 | $1.09 | 45d | 1 | 1.38mi |
| 1052 Beaconsfield Ave Grosse Pointe Park, MI | 2.0 | 1.0 | 1000 | $1,350 | $1.35 | 19d | 1 | 1.49mi |
Listing history 17 events
-
2026-06-21days on market $100,000 Active 33 DOM
-
2026-06-18days on market $100,000 Active 30 DOM
-
2026-06-17days on market $100,000 Active 29 DOM
-
2026-06-15days on market $100,000 Active 27 DOM
-
2026-06-13days on market $100,000 Active 25 DOM
-
2026-06-13days on market $100,000 Active 24 DOM
-
2026-06-09days on market $100,000 Active 21 DOM
-
2026-06-08days on market $100,000 Active 20 DOM
-
2026-06-07days on market $100,000 Active 19 DOM
-
2026-06-04days on market $100,000 Active 16 DOM
-
2026-06-03days on market $100,000 Active 15 DOM
-
2026-06-02days on market $100,000 Active 14 DOM
-
2026-06-01days on market $100,000 Active 13 DOM
-
2026-05-31days on market $100,000 Active 12 DOM
-
2026-05-19$100,000 Active
Show marketing remark (213 chars)
3 bedroom ranch style home with full basement, newer furnace and water tank, central air and more. Located near Grayhaven, and Clairpointe. Just a short walk to the Detroit River and minutes from Downtown Detroit.
-
2026-05-19$100,000 Active 213-char remark
Show marketing remark (213 chars)
3 bedroom ranch style home with full basement, newer furnace and water tank, central air and more. Located near Grayhaven, and Clairpointe. Just a short walk to the Detroit River and minutes from Downtown Detroit.
-
2000-11-14soldstatus $59,500
ⓘ Source: listings_history table (triggers on properties + properties_extension) + one-shot
backfill from property_details.listing_events for pre-trigger history.
Tax reassessment forecast MI · Partial reset (capped growth)
- Current annual tax
- $848 · $71/mo
- Projected year-2 tax
- $1,194 · $99/mo
- Expected delta
- +$346/yr (+$29/mo · 40.8%)
ⓘ Screening estimate from a state-policy table — verify with the county assessor before closing.
Climate risk First Street
- Flood 6/10 Major FEMA zone AE · 75% chance over 30 yrs
- Wildfire 1/10 Low
- Heat 3/10 Moderate 7 d/yr ≥96°F today · 15 d/yr by 30 yrs out
- Wind 2/10 Low
- Air quality 3/10 Moderate 2 unhealthy d/yr today · 5 by 30 yrs out
Nearby sold comps map
Loading sold comps map…
Walkable amenities ~0.75 mi
Loading nearby amenities…
Taxation est. · year 1
- Rental income
- $16,187
- − Mortgage interest
- −$5,602
- − Property taxes
- −$848
- − Insurance
- −$6,025
- − Repairs & maintenance
- −$1,295
- − Management
- −$1,295
- − Depreciation
- −$2,909
- Taxable loss
- −$1,787
- Est. tax savings @ 24.0%
- +$429
- After-tax cash flow
- $51/yr
For passive investors: Depreciation is non-cash, so a rental often shows a tax loss while cash-flowing — sheltering income. Rental losses are passive: they offset passive income freely, and up to $25,000/yr can offset ordinary (W-2) income if you actively participate and your MAGI is under $100k (phasing out to $0 by $150k); unused losses carry forward. On sale, claimed depreciation is recaptured at up to 25%, and gains may owe capital-gains tax (a 1031 exchange can defer both). Figures are a year-1 estimate at your 24.0% rate — not tax advice; consult a CPA.
Schools (NCES district)
- District
- Detroit Public Schools Community District
- NCES district ID
- 2601103
- Math proficiency
- 10% ▼ -2.00%
- Reading proficiency
- 24% ▲ 6.00%
- Median HH income
- $25,815
- Composite
- 13.06/100
- National rank
- #9564
- State rank
- #499 of 540 in MI
Livability — Detroit
- Score
- 73/100
- State rank
- #218
- US rank
- #5427
Category grades
Schools grade is shown separately in the Schools card above.
Census & demographics
- Census place
- Detroit, MI
- City population
- 572,865
- Population (ZIP)
- 10,238
Population outlook (Wayne County) Hauer SSP2
- Today (2025)
- 1,675,273 people
- By 2030
- 1,620,300 · -3.3%
- By 2040
- 1,502,341 · -10.3%
- By 2050
- 1,384,039 · -17.4%
- By 2075
- 1,124,592 · -32.9%
- By 2100
- 881,193 · -47.4%
Race, ethnicity, and origin ACS 2023
- Neighborhood character
- Predominantly Black (87%)
- Race & ethnicity
- Black 87% White 9% Two or more races 2% Hispanic / Latino 2%
- Common ancestry
- Romanian 1% Slovak 1% Lithuanian 1%
- Foreign-born
- 1% · Canada
- Languages at home
- 99% English-only · Spanish 1%
Political lean MEDSL · Wayne
- 2024 margin
- Strong D (+29.0) · D 62.7% · R 33.7% · Other 3.6%
- 2008→2024 swing
- -20.5pp toward R · 2008: 49.5pp · 2024: 29.0pp
- All cycles
- 2024: D+29.0 2020: D+38.1 2016: D+37.3 2012: D+46.9 2008: D+49.5
Not yet ingested
- Civics
- —
Market trends
- HPI YoY
- ▼ -60.84%
- Current HPI
- 191.0405
- Rent YoY
- —
- Metro
- —
- State GDP YoY
- ▲ 1.37%
- F500 in state
- 28
Industry mix (Fortune 500 HQ in MI)
| Industry | F500 HQs | Revenue |
|---|---|---|
| Automotive Parts | 3 | $48B |
|
||
| Automotive | 2 | $372B |
|
||
| Chemicals | 1 | $45B |
|
||
| Automotive Retail | 1 | $29B |
|
||
| Healthcare / Medical Devices | 1 | $23B |
|
||
| Automotive Technology | 1 | $20B |
|
||
Price history
+68.1% since first listed3 events — show timeline
- 2026-05-19 Listed $100,000 MiRealSource-MiMLS
- 2026-05-19 Listed $100,000 REALCOMP
- 2000-11-14 Sold (Public Records) $59,500 Public Records
Property tax history
-6.0%/yrLatest (2025): $848 · -54.8% YoY. Source: county tax records.
Cash-flow waterfall
monthlySold comps — $/sqft
last 12 mo · ≤1 miLoading sold comps…