 🏗️ New Construction
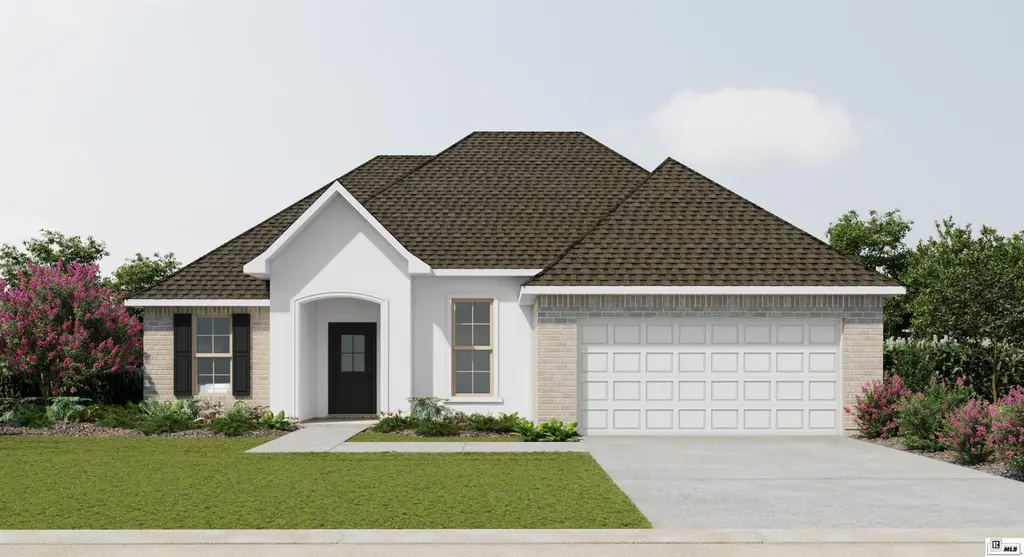
100 Oak Meadow Rd · West Monroe, LA
Flood risk No data
- FEMA flood zone
- —
- Chance of flooding over 30 yrs
- —
- Est. flood insurance / yr
- —
Fire risk No data
- Est. fire insurance / yr
- —
Heat risk No data
- Hot days now (above threshold)
- —
- Hot days in 30 yrs
- —
Wind risk No data
- Chance of severe wind over 30 yrs
- —
Air-quality risk No data
- Unhealthy air days now
- —
- Unhealthy air days in 30 yrs
- —
Risk factors via First Street. Map © Google.
Why this score? — see what drove the C grade
The composite is a weighted blend of 9 inputs, each scored 0–100. Each bar is that input's sub-score; the figure is the points it added to the 100-point composite (weight × sub-score).
- Cash flow +17.4/30.0
- Appreciation +10.0/10.0
- ARV discount +7.5/15.0
- DSCR +5.4/10.0
- 1% rule +4.8/10.0
- Condition / age +3.8/5.0
- Livability +3.5/5.0
- Schools +3.2/10.0
- Rent growth +2.5/5.0
$280,500
🖨 Deal sheet (PDF) 📄 Offer letter ✓ Due diligence
Listing remarks
The ROSES V C in Somerset Park community offers a 3 bedroom, 2 full bathroom, open and split design with a flex space, a separate dining area, and a computer desk/niche. Features: double vanity, garden tub, separate shower, and 2 walk-in closets in the primary suite, tray ceiling in the primary bedroom, a kitchen island overlooking the living room, spacious walk-in pantry, covered rear porch, ceiling fans in the living room and primary bedroom are standard, smart connect wi-fi thermostat, smoke and carbon monoxide detectors, landscaping, architectural 30-year shingles, flood lights, and more! Energy Efficient Features: a tankless gas water heater, a kitchen appliance package, low E til
Key facts
- 6,969 sq ft lot
- 2 garage spots
- Built 2026
Neighborhood map
What this means for you Summary
Snapshot
- This is a 3-bed/2.0-bath single-family listed at $280k. Condition is rated good.
Deal economics
- At list price, monthly cash flow is $151 ($2k/yr) — positive.
- To cash-flow at today's rent, offer at most $224k (20.1% below list).
- To meet the 1% rule (rent ≥ 1% of price), the offer needs to be $199k (29.2% below list).
- Recommended offer: $199k (29.2% below list) — sets the bar for 1% rule.
- Cap rate 7.2% vs local median 5.3% in West Monroe — top-decile yield for the area; either an underpriced asset or a hidden risk that comps aren't pricing in. Stress-test before assuming the spread holds.
Location & tenants
- Location reads 70/100 on livability (#53 in LA) — a middle-class / working-renter tenant base. Strengths: cost of living A+, health & safety A+, housing A; Watch: crime F, commute F, employment F.
- Ouachita Parish (suburban): math 31% / reading 45% proficiency, ranked #26 of 98 in LA (top 26%) — families likely to look elsewhere, expect single-tenant / working-renter base with shorter leases.
- Zoned schools: Sterlington Elementary School (math 56% / reading 65%, grade B-, #62 of 646 statewide, top 10%, 820 students, 45% FRL); Sterlington Middle School (math 50% / reading 58%, grade B-, #19 of 218 statewide, top 9%, 423 students, 48% FRL); Sterlington High School (math 42% / reading 47%, grade F, #58 of 265 statewide, top 23%, 539 students, 41% FRL).
- Zoned-school proficiency averages 53% at this address vs 38% district-wide (+15 pts) — the actual schools serving this property are materially stronger than the Ouachita Parish average implies; a family-tenant draw the district grade alone would hide.
- Market conditions: 189 active listings in the ZIP; 4 comparable units currently listed for rent nearby; rentals at typical pace (median 23d on market — plan ~3-4 weeks tenant-placement turnaround); 345 units permitted in Ouachita Parish in 2024 (0 in 5+ unit buildings).
Forward outlook
- In year one you build about $22k of equity ($1k loan paydown + $20k appreciation (10.0% local appreciation)).
- At projected returns (10.0% appreciation + 3.0% rent growth), your $57k cash investment doubles in ~3 years — after that, you're playing with house money.
- By year 2, paydown + projected appreciation supports a ~$35k cash-out refi (75% LTV) — recoverable capital for the next deal without selling this one.
Negotiation context
- Only 0 days on market — expect competitive offers; lowballing is unlikely to land.
Questions for the listing agent
- What does the HOA fee cover, when was the last increase, and are there any pending special assessments or reserve-fund shortfalls?
- Is there a deadline driving the sale (1031 exchange, divorce, estate, relocation)? That informs how much negotiation room exists.
- Schools are B-rated — typically a magnet for longer-tenancy family renters. What's the average tenant stay here, and is there a school-zone premium baked into asking?
- Crime grade is F in this area — have there been break-ins, vandalism, or insurance claims at this property in the last 3 years? What carrier currently insures it and at what premium?
- What's the average days-on-market for RENTAL listings here right now (not sales)? A rising rental-DOM trend means longer vacancies and softer asking-rent achievability than the comps imply.
- What's the recent tenant-quality profile in this submarket — average credit score on applications, eviction rate, late-payment / NSF rate, and stable-employment percentage? A property-management company in the area should have these aggregated.
- How much new for-sale + rental construction is in the pipeline within 1–3 miles? Heavy new supply typically softens prices + rents 12–24 months out; constrained supply supports both.
Investment metrics
- 1% rule
- 0.98% ✗
- Cap rate
- 7.19%
- Cash-on-cash
- 3.21%
- DSCR
- 1.14
- GRM
- 8.5
CMA / ARV
- ARV (on-the-fly)
- $202,125
- Comps found
- 6
Show comp detail 6 sales within ~0.75 mi
| Address | Dist | Beds/Ba | Sqft | Sold | Price | $/sf | Match |
|---|---|---|---|---|---|---|---|
| 123 Oak Dr | 0.09mi | 3/2.0 | 2,081 (+8%) | 13mo | $160,000 | $77 | 72 |
| 121 Hemlock Cir | 0.49mi | 3/2.0 | 1,902 (-1%) | 6mo | $199,000 | $105 | 70 |
| 109 Parkwest Dr | 0.33mi | 3/2.0 | 1,918 (-0%) | 20mo | $225,000 | $117 | 68 |
| 404 Register St | 0.50mi | 3/1.0 | 1,886 (-2%) | 11mo | $99,900 | $53 | 60 |
| 114 Mcalpine Dr | 0.47mi | 3/2.0 | 1,885 (-2%) | 22mo | $249,900 | $133 | 56 |
| 1314 Parnell St | 0.57mi | 4/3.0 (+1) | 2,084 (+8%) | 1mo | $150,000 | $72 | 50 |
Match score weights: distance 35% · size 25% · config 20% · recency 20%. Top-matched comps best support the ARV.
Projected returns pro-forma
10.0% appreciation · 3.0% rent growth · sell at horizon
- IRR
- 26.6%
- Equity multiple
- 3.12×
- Total profit
- $119,761
- Equity at exit
- $182,090
- IRR
- 23.3%
- Equity multiple
- 7.10×
- Total profit
- $345,185
- Equity at exit
- $392,684
Cash invested: $56,595 (down + closing). Projections, not guarantees.
Landlord ↔ Tenant lean methodology
- Overall (STATE)
- 90 Strongly Landlord-Friendly
- State Louisiana
- 90 Strongly Landlord-Friendly · R+12
- County
- — inherits STATE
- City
- — inherits STATE
ZIP-level market 71280
- Home prices YoY
- 4.1%
- Active inventory
- 189
- Price-to-rent
- 11.8×
Monthly cashflow live
- Estimated rent
- $1,986 medium interval (Pro) →
- Mortgage (P&I)
- −$1,060
- Tax est. 1.5%
- −$253 /mo · $3,032/yr
- Insurance
- −$84
- HOA
- −$21
- Vacancy / Maint / Mgmt
- −$417
- Net cashflow
- $151
Break-even live
Sensitivity live
| Price | -10% $291 | -5% $221 | +0% $151 | +5% $81 | +10% $12 |
|---|---|---|---|---|---|
| Rent | -10% $-6 | -5% $73 | +0% $151 | +5% $230 | +10% $308 |
| Rate | -1.0pp $253 | -0.5pp $203 | base $151 | +0.5pp $99 | +1.0pp $46 |
UW: 25.0% down · 7.5% · 30yr · 1.5% tax · 5.0% vac · 8.0% maint · 8.0% mgmt
Financing live
Cash to close
- Down payment
- $50,531
- Closing costs
- $6,064
- Reserves months
- —
- Total cash needed
- —
Loan-product check · same deal, 3 products live
Conventional
25% down · 7.5% · 30yr
- Down + closing
- —
- Monthly P&I
- —
- Monthly cashflow
- —
- DSCR
- —
- Eligible?
- —
Personal DTI + credit; lowest rate.
DSCR
20% down · 8.5% · 30yr
- Down + closing
- —
- Monthly P&I
- —
- Monthly cashflow
- —
- DSCR
- —
- Eligible?
- —
No personal income docs; deal must DSCR.
Hard money
10% down · 12.0% · 12mo
- Down + closing
- —
- Monthly P&I
- —
- Monthly cashflow
- —
- DSCR
- —
- Eligible?
- —
Short-term bridge; refi at stabilization.
Rent comps 4 comps
| Address | Beds | Baths | Sqft | Rent | $/sqft | DOM | Units | Dist |
|---|---|---|---|---|---|---|---|---|
| 1114 Otis St West Monroe, LA | 3.0 | 2.0 | 1304 | $1,595 | $1.22 | 45d | 1 | 1.13mi |
| 403 K St Monroe, LA | 3.0 | 2.0 | 1561 | $1,100 | $0.70 | 23d | 1 | 1.28mi |
| 1707 N 5th St Monroe, LA | 3.0 | 2.0 | 1694 | $3,500 | $2.07 | 23d | 1 | 1.31mi |
| 118 Bancroft Blvd West Monroe, LA | 3.0 | 2.0 | 1300 | $1,525 | $1.17 | 23d | 1 | 1.41mi |
HOA detail
- Monthly dues
- $21 · $252/yr
- Likely covers
- watergasinternetlandscaping
Nearby sold comps map
Loading sold comps map…
Walkable amenities ~0.75 mi
Loading nearby amenities…
Taxation est. · year 1
- Rental income
- $23,835
- − Mortgage interest
- −$11,322
- − Property taxes
- −$3,032
- − Insurance
- −$1,011
- − Repairs & maintenance
- −$1,907
- − Management
- −$1,907
- − HOA
- −$252
- − Depreciation
- −$5,880
- Taxable loss
- −$1,475
- Est. tax savings @ 24.0%
- +$354
- After-tax cash flow
- $2,170/yr
For passive investors: Depreciation is non-cash, so a rental often shows a tax loss while cash-flowing — sheltering income. Rental losses are passive: they offset passive income freely, and up to $25,000/yr can offset ordinary (W-2) income if you actively participate and your MAGI is under $100k (phasing out to $0 by $150k); unused losses carry forward. On sale, claimed depreciation is recaptured at up to 25%, and gains may owe capital-gains tax (a 1031 exchange can defer both). Figures are a year-1 estimate at your 24.0% rate — not tax advice; consult a CPA.
Condition & rehab AI · 3 photos
This single-family home in Somerset Park is in good condition with minimal repairs needed. It offers a good ROI with updates focusing on curb appeal and interior aesthetics.
Value-add opportunities
- Both Painting exterior and interior walls — Fresh paint enhances curb appeal and interior aesthetics
- Both Landscaping improvements — Enhances curb appeal and adds value
- Both HVAC maintenance — Ensures comfort and energy efficiency
Renovation cost estimate screening
Value-add ROI direction
- Both Painting exterior and interior walls — Fresh paint enhances curb appeal and interior aesthetics ↑
- Both Landscaping improvements — Enhances curb appeal and adds value ↑
- Both HVAC maintenance — Ensures comfort and energy efficiency ↑
ⓘ Cost ranges are severity-bucket heuristics (US national rule-of-thumb). Get contractor quotes + a written scope before underwriting a rehab budget.
Schools (NCES district)
- District
- Ouachita Parish
- NCES district ID
- 2201200
- Math proficiency
- 31% ▼ -38.00%
- Reading proficiency
- 45% ▼ -31.00%
- Median HH income
- $43,316
- Composite
- 32.14/100
- National rank
- #5791
- State rank
- #26 of 98 in LA
Livability — West Monroe
- Score
- 70/100
- State rank
- #53
- US rank
- #7498
Category grades
Schools grade is shown separately in the Schools card above.
Census & demographics
- Census place
- West Monroe, LA
- City population
- 58,204
- Population (ZIP)
- 4,999
Population outlook (Ouachita County) Hauer SSP2
- Today (2025)
- 163,370 people
- By 2030
- 165,520 · +1.3%
- By 2040
- 167,652 · +2.6%
- By 2050
- 166,699 · +2.0%
- By 2075
- 156,348 · -4.3%
- By 2100
- 134,102 · -17.9%
Race, ethnicity, and origin ACS 2023
- Neighborhood character
- Predominantly White (74%)
- Race & ethnicity
- White 74% Black 21% Hispanic / Latino 4%
- Common ancestry
- Lithuanian 4% Iranian 2% Danish 1%
- Foreign-born
- 3% · Canada, Jamaica
- Languages at home
- 98% English-only · Spanish 2%
Political lean MEDSL · Ouachita
- 2024 margin
- Strong R (+27.9) · D 35.5% · R 63.3% · Other 1.2%
- 2008→2024 swing
- -2.7pp toward R · 2008: -25.2pp · 2024: -27.9pp
- All cycles
- 2024: R+27.9 2020: R+23.6 2016: R+25.4 2012: R+20.9 2008: R+25.2
Not yet ingested
- Civics
- —
Market trends
- HPI YoY
- ▲ 11.14%
- Current HPI
- 283.4492
- Rent YoY
- —
- Metro
- —
- State GDP YoY
- ▲ 3.29%
- F500 in state
- 10
Industry mix (Fortune 500 HQ in LA)
| Industry | F500 HQs | Revenue |
|---|---|---|
| Telecommunications | 2 | $23B |
|
||
| Utilities | 1 | $12B |
|
||
| Wholesale / Distribution | 1 | $5B |
|
||
| Advertising | 1 | $2B |
|
||
Cash-flow waterfall
monthlySold comps — $/sqft
last 12 mo · ≤1 miLoading sold comps…