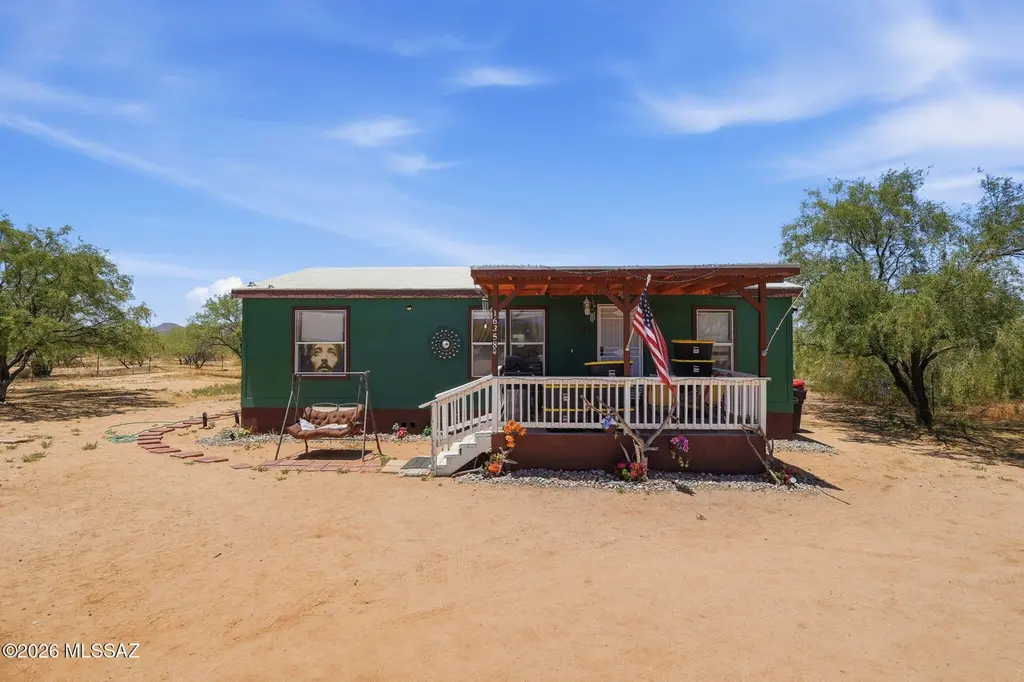
16358 W Sweet Jonquil Ct · Three Points, AZ
Flood risk 1/10 · Minimal
- FEMA flood zone
- AO
- Chance of flooding over 30 yrs
- 0.0%
- Est. flood insurance / yr
- $848 – $2,087
Fire risk 6/10 · Moderate
- Est. fire insurance / yr
- $610 – $1,132
Heat risk 8/10 · Major
- Hot days now (above 106°F)
- 7 days/yr
- Hot days in 30 yrs
- 18 days/yr
Wind risk 1/10 · Minimal
- Chance of severe wind over 30 yrs
- —
Air-quality risk 1/10 · Minimal
- Unhealthy air days now
- 0 days/yr
- Unhealthy air days in 30 yrs
- 0 days/yr
Risk factors via First Street. Map © Google.
Why this score? — see what drove the B- grade
The composite is a weighted blend of 9 inputs, each scored 0–100. Each bar is that input's sub-score; the figure is the points it added to the 100-point composite (weight × sub-score).
- Cash flow +27.5/30.0
- ARV discount +15.0/15.0
- DSCR +9.7/10.0
- 1% rule +6.4/10.0
- Livability +2.7/5.0
- Rent growth +2.5/5.0
- Condition / age +2.5/5.0
- Schools +1.5/10.0
- Appreciation +0.0/10.0
$164,900
🖨 Deal sheet 📄 Offer letter ✓ Due diligence
Listing remarks MLS
Great corner lot home on over an acre with beautiful Mountain views. Split floor plan 3 bedrooms/2 full baths, very spacious living area, laundry room off the kitchen with plenty of cabinet and counter space. Solid wood Deck and porch Enjoy the privacy, NO HOA! what more could you want
Key facts
- Covered porch
- Country living
- Solid wood deck
Tags
Property features AI
Finance
- Other: Zoned Three Points - GR1
Exterior
- Utilities: Water provided by water company; Septic tank for sewer
- Home design: Manufactured home; Single-story; Faces south
- Construction: Frame and siding construction; Shingle roof
- Exterior features: Covered patio; Shed(s); Chain link fencing; Shrubs on lot; Previously developed lot; North/South exposure; Dirt road access
Interior
- Kitchen: Dishwasher; Electric range; Electric oven; Microwave
- Flooring: Laminate flooring
- Bathrooms: 2 full bathrooms
- Heating & cooling: Heat pump heating; Central air conditioning
- Interior features: Entrance foyer
- Laundry & utility: Dedicated laundry room
Neighborhood map
What this means for you Summary
Snapshot
- This is a 3-bed/2.0-bath manufactured listed at $165k.
Deal economics
- At list price, monthly cash flow is $367 ($4k/yr) — positive.
- The deal already cash-flows at list — no discount required.
- Meets the 1% rule at list price ($2k rent vs $165k).
- Cap rate 9.9% vs local median 4.8% in Three Points — top-decile yield for the area; either an underpriced asset or a hidden risk that comps aren't pricing in. Stress-test before assuming the spread holds.
Location & tenants
- Location reads 53/100 on livability (#286 in AZ) — a working-class tenant base; expect higher turnover. Strengths: cost of living A+, housing A+; Watch: amenities F, commute F, employment D-.
- Altar Valley Elementary District (4418) (rural): math 15% / reading 19% proficiency, ranked #202 of 249 in AZ (top 81%) — low school quality limits family demand, transient renter base, plan for 1-2y turnover; 68% free/reduced lunch — lower-income household profile, screen leases tightly.
- Zoned schools: Robles Elementary School (math 17% / reading 17%, grade F, #814 of 1,109 statewide, top 76%, 389 students, 79% FRL); Altar Valley Middle School (math 14% / reading 19%, grade F, #151 of 218 statewide, top 70%, 196 students, 69% FRL).
- Market conditions: 83 active listings in the ZIP; 5,268 units permitted in Pima County in 2024 (996 in 5+ unit buildings).
Forward outlook
- Local home prices are declining (-3.0%/yr); year-one equity from $1k of loan paydown is wiped out by about $5k of value loss. Plan a longer hold.
- Pima County population projected at +8% by 2050 — modest demand growth; plan on rents tracking national, not racing it.
Negotiation context
- Only 14 days on market — expect competitive offers; lowballing is unlikely to land.
- 10 sale attempts since 11y ago with the ask held roughly flat each time — persistent listings suggest the price (not the market) is what's stuck; bring a comps-based counter.
Risks & watch-outs
- Watch-outs: flood insurance adds $122/mo.
- Climate carrying-cost: in FEMA flood zone AO (mandatory federal flood insurance); major wildfire risk; extreme-heat days projected 7→18/yr by 2055 (HVAC capex compounding) — expect insurance premiums to compound above CPI over the hold.
Questions for the listing agent
- What's the actual annual flood-insurance premium (NFIP or private), and is the property in a SFHA with mandatory coverage?
- Is there a deadline driving the sale (1031 exchange, divorce, estate, relocation)? That informs how much negotiation room exists.
- Schools are F-rated, which usually means shorter tenancies and higher turnover. Who's the typical renter profile here, and what's been the actual vacancy rate?
- What's the average days-on-market for RENTAL listings here right now (not sales)? A rising rental-DOM trend means longer vacancies and softer asking-rent achievability than the comps imply.
- What's the recent tenant-quality profile in this submarket — average credit score on applications, eviction rate, late-payment / NSF rate, and stable-employment percentage? A property-management company in the area should have these aggregated.
- How much new for-sale + rental construction is in the pipeline within 1–3 miles? Heavy new supply typically softens prices + rents 12–24 months out; constrained supply supports both.
Investment metrics
- 1% rule
- 1.14% ✓
- Cap rate
- 9.85%
- Cash-on-cash
- 12.71%
- DSCR
- 1.57
- GRM
- 7.3
CMA / ARV
- ARV (on-the-fly)
- $211,680
- Comps found
- 2
Show comp detail 2 sales within ~0.75 mi
| Address | Dist | Beds/Ba | Sqft | Sold | Price | $/sf | Match |
|---|---|---|---|---|---|---|---|
| 16055 W Quinlin Trl | 0.39mi | 3/2.0 | 1,152 (+3%) | 4mo | $217,900 | $189 | 74 |
| 16045 W Quinlin Trl | 0.41mi | 3/2.0 | 1,248 (+11%) | 2mo | $80,000 | $64 | 60 |
Match score weights: distance 35% · size 25% · config 20% · recency 20%. Top-matched comps best support the ARV.
Projected returns pro-forma
-3.0% appreciation · 3.0% rent growth · sell at horizon
- IRR
- -1.9%
- Equity multiple
- 0.93×
- Total profit
- $-3,343
- Equity at exit
- $24,587
- IRR
- 7.8%
- Equity multiple
- 1.59×
- Total profit
- $27,240
- Equity at exit
- $14,258
Cash invested: $46,172 (down + closing). Projections, not guarantees.
Landlord ↔ Tenant lean methodology
- Overall (STATE)
- 87 Strongly Landlord-Friendly
- State Arizona
- 87 Strongly Landlord-Friendly · R+3
- County
- — inherits STATE
- City
- — inherits STATE
ZIP-level market 85735
- Home prices YoY
- -16.4%
- Active inventory
- 83
- Price-to-rent
- 7.3×
Monthly cashflow live
- Estimated rent
- $1,883 medium interval (Pro) →
- Mortgage (P&I)
- −$865
- Tax from tax record
- −$65 /mo · $783/yr
- Insurance
- −$69
- Flood insurance flood zone
- −$122 /mo · $1,468/yr
- HOA
- −$0
- Vacancy / Maint / Mgmt
- −$395
- Net cashflow
- $367
Break-even live
UW: 25.0% down · 7.5% · 30yr · 1.5% tax · 5.0% vac · 8.0% maint · 8.0% mgmt
Financing live
Cash to close
- Down payment
- $41,225
- Closing costs
- $4,947
- Reserves months
- —
- Total cash needed
- —
Loan-product check · same deal, 3 products live
Conventional
25% down · 7.5% · 30yr
- Down + closing
- —
- Monthly P&I
- —
- Monthly cashflow
- —
- DSCR
- —
- Eligible?
- —
Personal DTI + credit; lowest rate.
DSCR
20% down · 8.5% · 30yr
- Down + closing
- —
- Monthly P&I
- —
- Monthly cashflow
- —
- DSCR
- —
- Eligible?
- —
No personal income docs; deal must DSCR.
Hard money
10% down · 12.0% · 12mo
- Down + closing
- —
- Monthly P&I
- —
- Monthly cashflow
- —
- DSCR
- —
- Eligible?
- —
Short-term bridge; refi at stabilization.
Listing history 11 events
-
2026-06-18days on market $164,900 Active 14 DOM
-
2026-06-18price $164,900 Active 13 DOM
-
2026-06-17days on market $169,900 Active 13 DOM
-
2026-06-16days on market $169,900 Active 12 DOM
-
2026-06-15days on market $169,900 Active 11 DOM
-
2026-06-13days on market $169,900 Active 9 DOM
-
2026-06-10days on market $169,900 Active 6 DOM
-
2026-06-09days on market $169,900 Active 5 DOM
-
2026-06-08days on market $169,900 Active 4 DOM
-
2026-06-07remarks 602-char remark
-
2026-06-07$169,900 Active 3 DOM
ⓘ Source: listings_history table (triggers on properties + properties_extension) + one-shot
backfill from property_details.listing_events for pre-trigger history.
Tax reassessment forecast AZ · Resets to sale price
- Current annual tax
- $783 · $65/mo
- Projected year-2 tax
- $1,088 · $91/mo
- Expected delta
- +$306/yr (+$25/mo · 39.1%)
ⓘ Screening estimate from a state-policy table — verify with the county assessor before closing.
Climate risk First Street
- Flood 1/10 Low FEMA zone AO · 0% chance over 30 yrs
- Wildfire 6/10 Major
- Heat 8/10 Severe 7 d/yr ≥106°F today · 18 d/yr by 30 yrs out
- Wind 1/10 Low
- Air quality 1/10 Low 0 unhealthy d/yr today · 0 by 30 yrs out
Nearby sold comps map
Loading sold comps map…
Walkable amenities ~0.75 mi
Loading nearby amenities…
Taxation est. · year 1
- Rental income
- $22,599
- − Mortgage interest
- −$9,237
- − Property taxes
- −$783
- − Insurance
- −$2,292
- − Repairs & maintenance
- −$1,808
- − Management
- −$1,808
- − Depreciation
- −$4,797
- Taxable income
- $1,874
- Est. tax owed @ 24.0%
- −$450
- After-tax cash flow
- $3,952/yr
For passive investors: Depreciation is non-cash, so a rental often shows a tax loss while cash-flowing — sheltering income. Rental losses are passive: they offset passive income freely, and up to $25,000/yr can offset ordinary (W-2) income if you actively participate and your MAGI is under $100k (phasing out to $0 by $150k); unused losses carry forward. On sale, claimed depreciation is recaptured at up to 25%, and gains may owe capital-gains tax (a 1031 exchange can defer both). Figures are a year-1 estimate at your 24.0% rate — not tax advice; consult a CPA.
Schools (NCES district)
- District
- Altar Valley Elementary District (4418)
- NCES district ID
- 0404770
- Math proficiency
- 15% ▼ -13.00%
- Reading proficiency
- 19% ▼ -9.00%
- Median HH income
- $40,645
- Composite
- 14.52/100
- National rank
- #9420
- State rank
- #202 of 249 in AZ
Livability — Three Points
- Score
- 53/100
- State rank
- #286
- US rank
- #24371
Category grades
Schools grade is shown separately in the Schools card above.
Census & demographics
- Census place
- Three Points, AZ
- City population
- 10,893
- Population (ZIP)
- 10,893
Population outlook (Pima County) Hauer SSP2
- Today (2025)
- 1,066,056 people
- By 2030
- 1,086,684 · +1.9%
- By 2040
- 1,117,160 · +4.8%
- By 2050
- 1,149,778 · +7.9%
- By 2075
- 1,271,480 · +19.3%
- By 2100
- 1,321,160 · +23.9%
Race, ethnicity, and origin ACS 2023
- Neighborhood character
- Diverse neighborhood (Simpson 0.59)
- Race & ethnicity
- Hispanic / Latino 50% White 41% Two or more races 19% Native American 6%
- Hispanic origin (detail)
- Mexican 47%
- Common ancestry
- Lithuanian 2% Slovak 1% Romanian 1%
- Foreign-born
- 9% · Canada
- Languages at home
- 74% English-only · Spanish 25%
Political lean MEDSL · Pima
- 2024 margin
- D (+15.2) · D 57.0% · R 41.8% · Other 1.2%
- 2008→2024 swing
- +9.1pp toward D · 2008: 6.1pp · 2024: 15.2pp
- All cycles
- 2024: D+15.2 2020: D+18.7 2016: D+13.5 2012: D+5.8 2008: D+6.1
Not yet ingested
- Civics
- —
Market trends
- HPI YoY
- ▼ -59.03%
- Current HPI
- 301.1413
- Rent YoY
- —
- Metro
- —
- State GDP YoY
- ▲ 4.54%
- F500 in state
- 20
Industry mix (Fortune 500 HQ in AZ)
| Industry | F500 HQs | Revenue |
|---|---|---|
| Technology | 2 | $13B |
|
||
| Mining / Metals | 1 | $23B |
|
||
| Environmental Services | 1 | $16B |
|
||
| Metals / Steel | 1 | $14B |
|
||
| Technology Distribution | 1 | $9B |
|
||
| Homebuilding | 1 | $8B |
|
||
Price history
+749.5% since first listed32 events — show timeline
- 2026-06-03 Listed $169,900 MLSSAZ
- 2026-03-01 Listing Removed — MLSSAZ
- 2025-10-02 Price Changed $209,900 MLSSAZ
- 2025-09-10 Listed $219,900 MLSSAZ
- 2022-04-01 Sold (Public Records) $150,000 Public Records
- 2022-04-01 Sold (MLS) $150,000 MLSSAZ
- 2022-03-29 Pending — MLSSAZ
- 2022-03-28 Contingent — MLSSAZ
- 2022-01-22 Listed $150,000 MLSSAZ
- 2021-08-27 Price Changed $150,000 MLSSAZ
- 2021-08-27 Listing Removed — MLSSAZ
- 2021-04-23 Price Changed $140,000 MLSSAZ
- 2021-04-07 Price Changed $130,000 MLSSAZ
- 2021-03-22 Price Changed $130,100 MLSSAZ
- 2021-02-18 Listed $130,000 MLSSAZ
- 2017-11-01 Listing Removed — MLSSAZ
- 2017-09-04 Relisted — MLSSAZ
- 2017-08-01 Contingent — MLSSAZ
- 2017-07-24 Relisted — MLSSAZ
- 2017-06-14 Contingent — MLSSAZ
- 2017-06-09 Listed $75,500 MLSSAZ
- 2017-06-01 Listing Removed — MLSSAZ
- 2017-05-17 Price Changed $77,500 MLSSAZ
- 2017-01-31 Listed $79,500 MLSSAZ
- 2016-07-01 Listing Removed — MLSSAZ
- 2016-03-16 Price Changed $75,000 MLSSAZ
- 2016-03-02 Price Changed $79,500 MLSSAZ
- 2016-02-09 Listed $85,000 MLSSAZ
- 2016-01-01 Listing Removed — MLSSAZ
- 2015-10-21 Listed $75,000 MLSSAZ
- 2009-11-10 Sold (Public Records) $13,000 Public Records
- 2007-11-09 Sold (Public Records) $20,000 Public Records
Property tax history
+6.5%/yrLatest (2025): $783 · +4.4% YoY. Source: county tax records.
Cash-flow waterfall
monthlySold comps — $/sqft
last 12 mo · ≤1 miLoading sold comps…