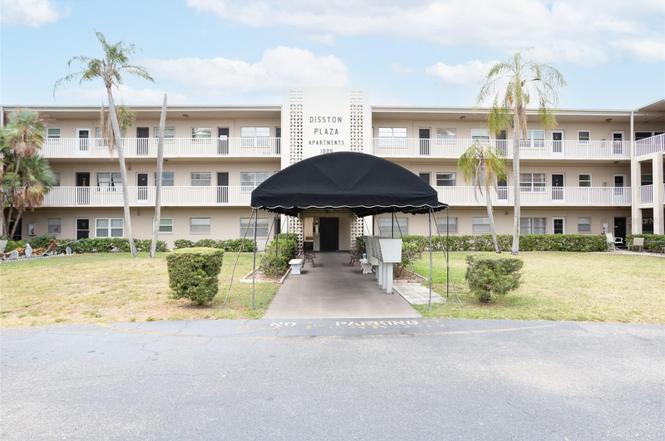
1000 49th St N #115 · St. Petersburg, FL
Flood risk 1/10 · Minimal
- FEMA flood zone
- X (unshaded)
- Chance of flooding over 30 yrs
- 0.0%
- Est. flood insurance / yr
- $507 – $1,088
Fire risk 1/10 · Minimal
- Est. fire insurance / yr
- $947 – $1,759
Heat risk 10/10 · Severe
- Hot days now (above 106°F)
- 5 days/yr
- Hot days in 30 yrs
- 18 days/yr
Wind risk 10/10 · Severe
- Chance of severe wind over 30 yrs
- 99.0%
Air-quality risk 4/10 · Minor
- Unhealthy air days now
- 4 days/yr
- Unhealthy air days in 30 yrs
- 4 days/yr
Risk factors via First Street. Map © Google.
Why this score? — see what drove the D grade
The composite is a weighted blend of 9 inputs, each scored 0–100. Each bar is that input's sub-score; the figure is the points it added to the 100-point composite (weight × sub-score).
- 1% rule +10.0/10.0
- Cash flow +9.2/30.0
- ARV discount +7.5/15.0
- Schools +4.3/10.0
- DSCR +2.6/10.0
- Livability +2.5/5.0
- Condition / age +2.5/5.0
- Rent growth +2.4/5.0
- Appreciation +0.0/10.0
$135,000
🖨 Deal sheet 📄 Offer letter ✓ Due diligence
Listing remarks
Discover the epitome of city living in this spacious two-bedroom, two-bathroom ground-floor corner unit condo nestled in the heart of Disston Plaza. Boasting a generous floor plan, this residence offers both comfort and style with modern upgrades and an unbeatable location. Inside, wood-like tile flooring flows throughout the living spaces, offering the warmth and look of wood with the durability and easy maintenance of tile. The recently updated kitchen features brand-new cabinets and sleek quartz countertops, creating a clean, contemporary feel. Even better, the seller is offering a credit so you can select your own appliances, allowing you to customize the kitchen to your taste. The conv
Key facts
- Quartz countertops
- Updated kitchen
- Brand new cabinets
Tags
Property features AI
Finance
- Other: Unfurnished; Unit located on floor 1
- Financial info: Total monthly fees $847 (total annual fees $10,164); Lease restrictions apply
- HOA & community: Has HOA (Association: MICHEAL SLAVEN Assn); Monthly condo fee of $727; Association amenities include laundry, maintenance, and storage; Association fees cover maintenance (structure and grounds), sewer, trash, and water; Association approval required; Community mailbox; Pets allowed
Exterior
- Parking: Carport (1 space)
- Utilities: Public water; Public sewer; Public utilities
- Home design: Condominium; One-level unit; Faces east
- Construction: Brick construction; Built-up roof; Slab foundation; Built as part of a multi-story building (3 stories total)
- Exterior features: Exterior lighting; Sidewalks; Paved road access
Interior
- Kitchen: Dishwasher
- Bedrooms: 2 bedrooms
- Flooring: Tile; Vinyl
- Bathrooms: 2 full bathrooms
- Heating & cooling: Central heating; Central air conditioning
- Interior features: Open floor plan; Living room/dining room combo
- Laundry & utility: Laundry room
Neighborhood map
What this means for you Summary
Snapshot
- This is a 2-bed/2.0-bath condo listed at $135k.
Deal economics
- At list price, monthly cash flow is $-102 ($-1k/yr) — negative.
- To cash-flow at today's rent, offer at most $117k (13.3% below list).
- Meets the 1% rule at list price ($2k rent vs $135k).
- Recommended offer: $117k (13.3% below list) — sets the bar for cash-flow.
- Cap rate 5.4% vs local median 2.6% in St. Petersburg — top-decile yield for the area; either an underpriced asset or a hidden risk that comps aren't pricing in. Stress-test before assuming the spread holds.
Location & tenants
- Location reads: area grade D — affects rentability + tenant quality, not the cash-flow math above.
- Pinellas (suburban): math 51% / reading 51% proficiency, ranked #31 of 73 in FL (top 42%) — acceptable for families but not a draw, mixed tenant base, ~2y average lease.
- Market conditions: Rents soft (-0.5%/yr); 313 active listings in the ZIP; 40 comparable units currently listed for rent nearby; rentals leasing fast (median 4d on market — plan ~1-2 weeks tenant-placement turnaround); solid renter incomes; 2,676 units permitted in Pinellas County in 2024 (1,422 in 5+ unit buildings).
- This rent runs 32% of the median local income ($79k/yr) — at the standard rent-burdened threshold; future hikes will face affordability resistance.
Forward outlook
- Local home prices are declining (-3.0%/yr); year-one equity from $933 of loan paydown is wiped out by about $4k of value loss. Plan a longer hold.
- Pinellas County population projected at +14% by 2050 — modest demand growth; plan on rents tracking national, not racing it.
Negotiation context
- It's been on market 132 days — a 12% lower offer ($119k) is reasonable based on typical stale-listing flexibility.
- 7 sale attempts since 15y ago with the ask held roughly flat each time — persistent listings suggest the price (not the market) is what's stuck; bring a comps-based counter.
- Current owner paid $25k; list at $135k implies a 440% gain — meaningful room to come down on a strong offer.
Risks & watch-outs
- Watch-outs: HOA is 40% of rent.
- Climate carrying-cost: severe wind risk, 99% chance of damaging wind over 30y; extreme-heat days projected 5→18/yr by 2055 (HVAC capex compounding) — expect insurance premiums to compound above CPI over the hold.
Questions for the listing agent
- What do current leases actually rent for vs. the listed asking? Can we see a recent rent roll and the last 12 months of T-12 income?
- It's been on market 132 days. Have you received any prior offers? Is the seller open to a 13% concession, seller financing, or rate buy-down credit?
- Built in 1967 — when were the roof, HVAC, electrical panel, plumbing, and water heater last replaced?
- What does the HOA fee cover, when was the last increase, and are there any pending special assessments or reserve-fund shortfalls?
- Any open or pending special assessments — roof, HVAC, plumbing, elevator, façade? What's the per-unit balance and payoff schedule, and is the seller paying it off at close or rolling it to the buyer?
- Why hasn't it sold? Are there any deal-killer items the seller is aware of (foundation, flood, title, zoning, code violations)?
- Is there a deadline driving the sale (1031 exchange, divorce, estate, relocation)? That informs how much negotiation room exists.
- The area grade is low — what's the realistic commute time and amenity access for the typical tenant pool here? Any planned neighborhood developments (good or bad) we should know about?
- What's the average days-on-market for RENTAL listings here right now (not sales)? A rising rental-DOM trend means longer vacancies and softer asking-rent achievability than the comps imply.
- What's the recent tenant-quality profile in this submarket — average credit score on applications, eviction rate, late-payment / NSF rate, and stable-employment percentage? A property-management company in the area should have these aggregated.
- How much new apartment / multifamily construction is in the pipeline within 1–3 miles? Heavy new supply (>2% of stock underway) typically softens rents 12–24 months out; light construction supports rent growth.
Investment metrics
- 1% rule
- 1.58% ✓
- Cap rate
- 5.39%
- Cash-on-cash
- -3.23%
- DSCR
- 0.86
- GRM
- 5.3
CMA / ARV
No comps found within radius.
Projected returns pro-forma
-3.0% appreciation · 0.0% rent growth · sell at horizon
- IRR
- -28.3%
- Equity multiple
- 0.10×
- Total profit
- $-34,037
- Equity at exit
- $20,129
- IRR
- -75.5%
- Equity multiple
- -0.58×
- Total profit
- $-59,822
- Equity at exit
- $11,672
Cash invested: $37,800 (down + closing). Projections, not guarantees.
Landlord ↔ Tenant lean methodology
- Overall (STATE)
- 87 Strongly Landlord-Friendly
- State Florida
- 87 Strongly Landlord-Friendly · R+3
- County
- — inherits STATE
- City
- — inherits STATE
ZIP-level market 33710
- Rents YoY
- -0.5%
- Active inventory
- 313
- Price-to-rent
- 5.3×
Monthly cashflow live
- Estimated rent
- $2,127 high interval (Pro) →
- Mortgage (P&I)
- −$708
- Tax from tax record
- −$171 /mo · $2,046/yr
- Insurance
- −$56
- HOA
- −$847
- Vacancy / Maint / Mgmt
- −$447
- Net cashflow
- $-102
Break-even live
UW: 25.0% down · 7.5% · 30yr · 1.5% tax · 5.0% vac · 8.0% maint · 8.0% mgmt
Financing live
Cash to close
- Down payment
- $33,750
- Closing costs
- $4,050
- Reserves months
- —
- Total cash needed
- —
Loan-product check · same deal, 3 products live
Conventional
25% down · 7.5% · 30yr
- Down + closing
- —
- Monthly P&I
- —
- Monthly cashflow
- —
- DSCR
- —
- Eligible?
- —
Personal DTI + credit; lowest rate.
DSCR
20% down · 8.5% · 30yr
- Down + closing
- —
- Monthly P&I
- —
- Monthly cashflow
- —
- DSCR
- —
- Eligible?
- —
No personal income docs; deal must DSCR.
Hard money
10% down · 12.0% · 12mo
- Down + closing
- —
- Monthly P&I
- —
- Monthly cashflow
- —
- DSCR
- —
- Eligible?
- —
Short-term bridge; refi at stabilization.
Rent comps 40 comps
| Address | Beds | Baths | Sqft | Rent | $/sqft | DOM | Units | Dist |
|---|---|---|---|---|---|---|---|---|
| 630 50th St N Saint Petersburg, FL | 2.0 | 1.0 | 1085 | $2,070 | $1.91 | 24d | 1 | 0.25mi |
| 4594 10th Ave N Saint Petersburg, FL | 3.0 | 2.0 | 1432 | $3,100 | $2.16 | 24d | 1 | 0.26mi |
| 1101 46th St N Saint Petersburg, FL | 2.0 | 1.0 | 1300 | $2,300 | $1.77 | 4d | 1 | 0.27mi |
| 4942 Oxford Ave N Saint Petersburg, FL | 2.0 | 1.0 | 776 | $1,700 | $2.19 | 24d | 1 | 0.31mi |
| 5330 11th Ave N Saint Petersburg, FL | 2.0 | 1.0 | 756 | $1,800 | $2.38 | 4d | 1 | 0.37mi |
| 5318 9th Ave N Saint Petersburg, FL | 3.0 | 2.0 | 1142 | $2,600 | $2.28 | 4d | 1 | 0.37mi |
| 4526 6th Ave N Saint Petersburg, FL | 2.0 | 1.0 | 888 | $1,950 | $2.20 | 4d | 1 | 0.44mi |
| 4148 11th Ave N Saint Petersburg, FL | 2.0 | 1.0 | 806 | $2,000 | $2.48 | 24d | 1 | 0.61mi |
| 5521 5th Ave N Saint Petersburg, FL | 2.0 | 1.0 | 952 | $1,750 | $1.84 | 3d | 1 | 0.62mi |
| 4227 5th Ave N Saint Petersburg, FL | 2.0 | 1.0 | 930 | $2,100 | $2.26 | 4d | 1 | 0.64mi |
| 430 55th St N Saint Petersburg, FL | 2.0 | 1.5 | 735 | $1,850 | $2.52 | 7d | 1 | 0.65mi |
| 4136 13th Ave N Saint Petersburg, FL | 3.0 | 2.0 | 1154 | $2,600 | $2.25 | 11d | 1 | 0.65mi |
| 5050 2nd Ave N Saint Petersburg, FL | 2.0 | 1.0 | 816 | $1,495 | $1.83 | 3d | 1 | 0.67mi |
| 5545 3rd Ave N Saint Petersburg, FL | 2.0 | 1.0 | 962 | $2,400 | $2.49 | 3d | 1 | 0.74mi |
| 5428 Burlington Ave N Saint Petersburg, FL | 2.0 | 1.0 | 726 | $2,150 | $2.96 | 24d | 1 | 0.74mi |
| 1803 42nd Way N Saint Petersburg, FL | 2.0 | 2.0 | 1421 | $4,200 | $2.96 | 24d | 1 | 0.75mi |
| 441 57th St N Saint Petersburg, FL | 2.0 | 1.0 | 1160 | $1,950 | $1.68 | 2d | 1 | 0.75mi |
| 600 40th St N Saint Petersburg, FL | 1.0–3.0 | 1.0–2.5 | 1187 | $1,598 | $1.35 | 4d | 12 | 0.78mi |
| 3901 5th Ave N Unit 3901 5th D St. Petersburg, FL | 2.0 | 1.0 | 825 | $1,595 | $1.93 | 7d | 1 | 0.87mi |
| 5034 2nd Ave S Unit A St. Petersburg, FL | 2.0 | 1.0 | 1062 | $1,950 | $1.84 | 4d | 1 | 0.91mi |
| 4218 24th Ave N Saint Petersburg, FL | 2.0 | 1.0 | 1121 | $1,925 | $1.72 | 4d | 1 | 0.93mi |
| 5055 3rd Ave S Saint Petersburg, FL | 3.0 | 2.0 | 1254 | $2,100 | $1.67 | 3d | 1 | 0.94mi |
| 5701 21st Ave N Saint Petersburg, FL | 1.0–2.0 | 1.0 | 775 | $1,899 | $2.45 | 7d | 3 | 0.95mi |
| 3700 9th Ave N Saint Petersburg, FL | 1.0–2.0 | 1.0–2.0 | 755 | $2,025 | $2.68 | 1d | 3 | 0.98mi |
| 5762 2nd Ave N Saint Petersburg, FL | 2.0 | 1.0 | 843 | $2,000 | $2.37 | 3d | 1 | 0.98mi |
| 1200 37th St N #409 Saint Petersburg, FL | 2.0 | 2.0 | 827 | $1,695 | $2.05 | 4d | 1 | 0.99mi |
| 5919 4th Ave N Saint Petersburg, FL | 2.0 | 1.0 | 1053 | $2,650 | $2.52 | 3d | 1 | 1.01mi |
| 5860 22nd Ave N Apt 5 St. Petersburg, FL | 2.0 | 1.0 | 800 | $1,300 | $1.62 | 24d | 1 | 1.01mi |
| 3938 2nd Ave N Saint Petersburg, FL | 2.0 | 1.0 | 1000 | $2,495 | $2.50 | 3d | 1 | 1.03mi |
| 5900 22nd Ave N Unit 1 St. Petersburg, FL | 3.0 | 2.0 | 1100 | $1,999 | $1.82 | 17d | 1 | 1.04mi |
| 5900 22nd Ave N Saint Petersburg, FL | 3.0 | 1.0 | 1100 | $1,950 | $1.77 | 4d | 1 | 1.04mi |
| 5900 22nd Ave N Unit 14 St. Petersburg, FL | 2.0 | 1.0 | 1000 | $1,650 | $1.65 | 14d | 1 | 1.04mi |
| 3844 Burlington Ave N Saint Petersburg, FL | 2.0 | 1.0 | 828 | $1,895 | $2.29 | 19d | 1 | 1.05mi |
| 3750 4th Ave N Saint Petersburg, FL | 2.0 | 1.0 | 881 | $2,100 | $2.38 | 24d | 1 | 1.06mi |
| 450 47th St S Saint Petersburg, FL | 3.0 | 1.0 | 960 | $2,950 | $3.07 | 3d | 1 | 1.07mi |
| 3823 2nd Ave N Saint Petersburg, FL | 2.0 | 1.0 | 944 | $2,300 | $2.44 | 3d | 1 | 1.08mi |
| 4948 5th Ave S Saint Petersburg, FL | 3.0 | 1.5 | 1379 | $2,450 | $1.78 | 3d | 1 | 1.09mi |
| 3601 6th Ave N Saint Petersburg, FL | 2.0 | 2.0 | 808 | $2,400 | $2.97 | 4d | 1 | 1.10mi |
| 1108 Winchester Rd N St Petersburg, FL | 3.0 | 1.0 | 1011 | $1,800 | $1.78 | 20d | 1 | 1.10mi |
| 5156 5th Ave S Saint Petersburg, FL | 3.0 | 1.0 | 1139 | $1,995 | $1.75 | 24d | 1 | 1.11mi |
HOA detail condo
- Monthly dues
- $847 · $10,164/yr
- Assessments
- None detected in remarks — confirm with the listing agent.
Listing history 32 events
-
2026-06-18days on market $135,000 Active 132 DOM
-
2026-06-17days on market $135,000 Active 131 DOM
-
2026-06-16days on market $135,000 Active 130 DOM
-
2026-06-15days on market $135,000 Active 129 DOM
-
2026-06-13days on market $135,000 Active 127 DOM
-
2026-06-09days on market $135,000 Active 123 DOM
-
2026-06-08days on market $135,000 Active 122 DOM
-
2026-06-07days on market $135,000 Active 121 DOM
-
2026-06-04days on market $135,000 Active 118 DOM
-
2026-06-03days on market $135,000 Active 117 DOM
-
2026-06-01days on market $135,000 Active 115 DOM
-
2026-05-31days on market $135,000 Active 114 DOM
-
2026-03-13price $135,000
-
2026-02-06$139,999 Active
-
2024-06-19$215,000 Active
-
2024-04-27historical
-
2024-04-23price $214,900
-
2024-04-14status Active
-
2024-04-14price $219,900
-
2024-02-26price $224,000
-
2023-10-27$229,999 Active
-
2023-10-15historical
-
2023-09-07price $220,000
-
2023-08-17$230,000 Active
-
2023-07-30historical
-
2023-03-28$230,000 Active
-
2016-12-27soldstatus $25,000
-
2011-07-07soldstatus $38,500
-
2011-06-29soldstatus $38,500
-
2011-06-01$44,900
-
2002-08-09soldstatus $46,800
-
2000-07-13soldstatus $30,000
ⓘ Source: listings_history table (triggers on properties + properties_extension) + one-shot
backfill from property_details.listing_events for pre-trigger history.
Tax reassessment forecast FL · Resets to sale price
- Current annual tax
- $2,046 · $171/mo
- Projected year-2 tax
- $2,046 · $171/mo
- Expected delta
- $0/yr ($0/mo · 0.0%)
ⓘ Screening estimate from a state-policy table — verify with the county assessor before closing.
Climate risk First Street
- Flood 1/10 Low FEMA zone X (unshaded) · 0% chance over 30 yrs
- Wildfire 1/10 Low
- Heat 10/10 Extreme 5 d/yr ≥106°F today · 18 d/yr by 30 yrs out
- Wind 10/10 Extreme 99% chance of damaging wind over 30 yrs
- Air quality 4/10 Moderate 4 unhealthy d/yr today · 4 by 30 yrs out
Nearby sold comps map
Loading sold comps map…
Walkable amenities ~0.75 mi
Loading nearby amenities…
Taxation est. · year 1
- Rental income
- $25,518
- − Mortgage interest
- −$7,562
- − Property taxes
- −$2,046
- − Insurance
- −$675
- − Repairs & maintenance
- −$2,041
- − Management
- −$2,041
- − HOA
- −$10,164
- − Depreciation
- −$3,927
- Taxable loss
- −$2,939
- Est. tax savings @ 24.0%
- +$705
- After-tax cash flow
- $-516/yr
For passive investors: Depreciation is non-cash, so a rental often shows a tax loss while cash-flowing — sheltering income. Rental losses are passive: they offset passive income freely, and up to $25,000/yr can offset ordinary (W-2) income if you actively participate and your MAGI is under $100k (phasing out to $0 by $150k); unused losses carry forward. On sale, claimed depreciation is recaptured at up to 25%, and gains may owe capital-gains tax (a 1031 exchange can defer both). Figures are a year-1 estimate at your 24.0% rate — not tax advice; consult a CPA.
Schools (NCES district)
- District
- Pinellas
- NCES district ID
- 1201560
- Math proficiency
- 51% ▼ -5.00%
- Reading proficiency
- 51% ▼ -3.00%
- Median HH income
- $46,270
- Composite
- 43.27/100
- National rank
- #3046
- State rank
- #31 of 73 in FL
Livability — St. Petersburg
No livability data for this city. (Only ~50 U.S. cities are tracked.)
Census & demographics
- Census place
- St. Petersburg, FL
- County
- Pinellas County · 939,478 people
- City population
- 249,151
- Metro
- Tampa-St. Petersburg-Clearwater, FL
- Population (ZIP)
- 33,796
- Household income
- $78,611
- Rent vs Own
- Severe rent burden
- 542.0
Population outlook (Pinellas County) Hauer SSP2
- Today (2025)
- 1,027,532 people
- By 2030
- 1,063,586 · +3.5%
- By 2040
- 1,125,020 · +9.5%
- By 2050
- 1,168,637 · +13.7%
- By 2075
- 1,265,188 · +23.1%
- By 2100
- 1,260,357 · +22.7%
Race, ethnicity, and origin ACS 2023
- Neighborhood character
- Predominantly White (77%)
- Race & ethnicity
- White 77% Two or more races 10% Hispanic / Latino 9% Asian 5% Black 4%
- Hispanic origin (detail)
- Mexican 1% Puerto Rican 2% Cuban 2%
- Common ancestry
- Lithuanian 3% Romanian 3% Slovak 2%
- Foreign-born
- 12% · Canada, Vietnam, China
- Languages at home
- 85% English-only · Spanish 7% Other Indo-European 2% Russian/Polish/Slavic 2%
Political lean MEDSL · Pinellas
- 2024 margin
- Lean R (+5.2) · D 46.9% · R 52.1%
- 2008→2024 swing
- -13.5pp toward R · 2008: 8.3pp · 2024: -5.2pp
- All cycles
- 2024: R+5.2 2020: D+0.2 2016: R+1.1 2012: D+5.6 2008: D+8.3
Not yet ingested
- Civics
- —
Market trends
- HPI YoY
- ▼ -547.31%
- Current HPI
- 405.0731
- Rent YoY
- ▼ -0.48%
- Metro
- Tampa-St. Petersburg-Clearwater, FL
- State GDP YoY
- ▲ 3.28%
- F500 in state
- 36
Industry mix (Fortune 500 HQ in FL)
| Industry | F500 HQs | Revenue |
|---|---|---|
| Industrial Technology | 2 | $29B |
|
||
| Insurance | 2 | $17B |
|
||
| Retail | 1 | $60B |
|
||
| Technology Distribution | 1 | $58B |
|
||
| Homebuilding | 1 | $35B |
|
||
| Technology Manufacturing | 1 | $35B |
|
||
Price history
+350.0% since first listed20 events — show timeline
- 2026-03-13 Price Changed $135,000 Stellar MLS as Distributed by MLS Grid
- 2026-02-06 Listed $139,999 Stellar MLS as Distributed by MLS Grid
- 2024-06-19 Listed $215,000 Stellar MLS as Distributed by MLS Grid
- 2024-04-27 Listing Removed — Stellar MLS as Distributed by MLS Grid
- 2024-04-23 Price Changed $214,900 Stellar MLS as Distributed by MLS Grid
- 2024-04-14 Relisted — Stellar MLS as Distributed by MLS Grid
- 2024-04-14 Price Changed $219,900 Stellar MLS as Distributed by MLS Grid
- 2024-02-26 Price Changed $224,000 Stellar MLS as Distributed by MLS Grid
- 2023-10-27 Listed $229,999 Stellar MLS as Distributed by MLS Grid
- 2023-10-15 Listing Removed — Stellar MLS as Distributed by MLS Grid
- 2023-09-07 Price Changed $220,000 Stellar MLS as Distributed by MLS Grid
- 2023-08-17 Listed $230,000 Stellar MLS as Distributed by MLS Grid
- 2023-07-30 Listing Removed — Stellar MLS as Distributed by MLS Grid
- 2023-03-28 Listed $230,000 Stellar MLS as Distributed by MLS Grid
- 2016-12-27 Sold (Public Records) $25,000 Public Records
- 2011-07-07 Sold (Public Records) $38,500 Public Records
- 2011-06-29 Sold (MLS) $38,500 Stellar MLS as Distributed by MLS Grid
- 2011-06-01 Listed $44,900 Stellar MLS as Distributed by MLS Grid
- 2002-08-09 Sold (Public Records) $46,800 Public Records
- 2000-07-13 Sold (Public Records) $30,000 Public Records
Property tax history
+9.4%/yrLatest (2025): $2,046 · +6.5% YoY. Source: county tax records.
Cash-flow waterfall
monthlySold comps — $/sqft
last 12 mo · ≤1 miLoading sold comps…