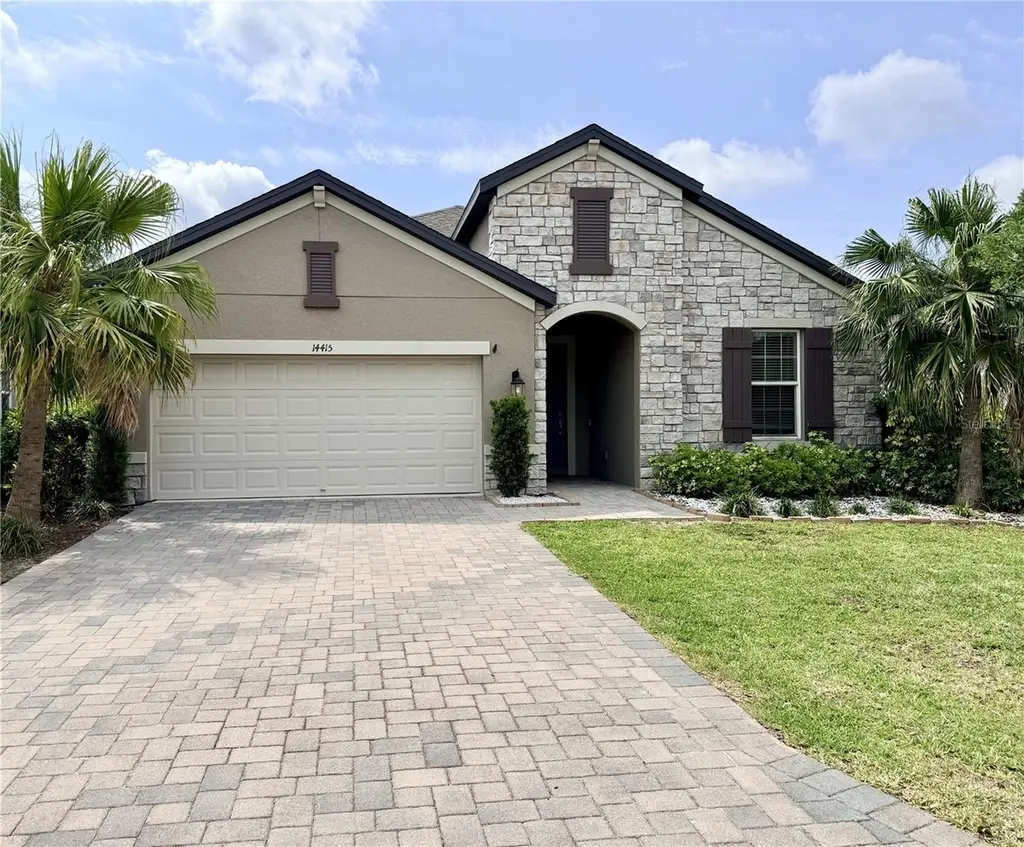
14415 20th St E · Lakewood Ranch, FL
Flood risk 5/10 · Moderate
- FEMA flood zone
- AE
- Chance of flooding over 30 yrs
- 0.22%
- Est. flood insurance / yr
- $1,737 – $8,500
Fire risk 4/10 · Minor
- Est. fire insurance / yr
- $947 – $1,759
Heat risk 10/10 · Severe
- Hot days now (above 107°F)
- 7 days/yr
- Hot days in 30 yrs
- 27 days/yr
Wind risk 10/10 · Severe
- Chance of severe wind over 30 yrs
- 99.0%
Air-quality risk 3/10 · Minor
- Unhealthy air days now
- 3 days/yr
- Unhealthy air days in 30 yrs
- 3 days/yr
Risk factors via First Street. Map © Google.
Why this score? — see what drove the C+ grade
The composite is a weighted blend of 9 inputs, each scored 0–100. Each bar is that input's sub-score; the figure is the points it added to the 100-point composite (weight × sub-score).
- Cash flow +23.2/30.0
- ARV discount +10.1/15.0
- DSCR +7.5/10.0
- 1% rule +6.2/10.0
- Schools +4.4/10.0
- Condition / age +4.0/5.0
- Livability +2.5/5.0
- Rent growth +2.3/5.0
- Appreciation +0.0/10.0
$435,000
🖨 Deal sheet 📄 Offer letter ✓ Due diligence
Listing remarks
PRICE REDUCED!! MOTIVATED SELLER!! BRING OFFERS!! Welcome to The Cove at Twin Rivers — one of Parrish's most sought-after communities! This stunning home, completed in 2022, offers 4 bedrooms, 3 full baths, and nearly 2200 sq ft of thoughtfully designed living space. Step inside to find an open, split-bedroom layout featuring gorgeous wood-look tile flooring throughout the main living areas, solid-wood cabinets, stone countertops, and a chef-inspired kitchen with a massive island and pantry. The dedicated dining space just off the kitchen flows effortlessly to both a spacious living room and a covered lanai through the glass sliders — perfect for viewing the serene, wooded area
Key facts
- Massive island
- Covered lanai
- 5,998 sq ft lot
Tags
Property features AI
Finance
- Other: Community features include community mailbox, deed restrictions, dog park, playground, and tennis courts; Pets allowed; No lease restrictions indicated
- HOA & community: Has HOA (Cove at Twin Rivers / Twin Rivers Assoc., Inc.); Quarterly association fees; Association fees cover private road and recreational facilities; Monthly equivalent HOA amount listed
Exterior
- Parking: Driveway; Attached garage with garage door opener; 2-car garage
- Security: Gated community
- Utilities: Public water; Public sewer; Electricity available; Cable available; Broadband/high-speed internet available
- Home design: Single family residence; One story; Faces northwest; Homesteaded
- Construction: Block construction; Shingle roof; Slab foundation; Built by M/I (Calusa B model)
- Exterior features: Covered front porch; Rear porch; Patio; Hurricane shutters; Landscaped yard; Paved areas; Flood zone
Interior
- Kitchen: Dishwasher; Disposal; Microwave; Range; Range hood; Refrigerator; Stone counters; Eat-in kitchen
- Bedrooms: 4 bedrooms
- Flooring: Carpet; Tile
- Bathrooms: 3 full bathrooms
- Heating & cooling: Central heating; Central air
- Interior features: Ceiling fans; Eat-in kitchen; Kitchen/family room combo; Open floorplan; Solid wood cabinets; Split bedroom layout; Stone counters; Thermostat; Tray ceilings; Walk-in closets; Window treatments; Inside utility
- Laundry & utility: Laundry room with washer and dryer (inside)
Neighborhood map
What this means for you Summary
Snapshot
- This is a 4-bed/3.0-bath single-family listed at $435k. Condition is rated good.
Deal economics
- At list price, monthly cash flow is $361 ($4k/yr) — positive.
- The deal already cash-flows at list — no discount required.
- Meets the 1% rule at list price ($5k rent vs $435k).
- Recommended offer: $422k (3.0% below list) — sets the bar for market timing.
- Cap rate 8.5% vs local median 3.3% in Lakewood Ranch — top-decile yield for the area; either an underpriced asset or a hidden risk that comps aren't pricing in. Stress-test before assuming the spread holds.
Location & tenants
- Location reads: area grade C — affects rentability + tenant quality, not the cash-flow math above.
- Manatee (suburban): math 54% / reading 50% proficiency, ranked #26 of 73 in FL (top 36%) — acceptable for families but not a draw, mixed tenant base, ~2y average lease.
- Zoned schools: Annie Lucy Williams Elementary School (math 80% / reading 73%, grade A, #185 of 2,144 statewide, top 9%, 798 students, 31% FRL); Parrish Community High School (math 47% / reading 57%, grade D+, #160 of 667 statewide, top 25%, 2,017 students, 32% FRL) — zoned schools average 32% FRL vs 51% district-wide (19 pts lower); this property's tenant base skews higher-income than the district average.
- Zoned-school proficiency averages 64% at this address vs 52% district-wide (+12 pts) — the actual schools serving this property are materially stronger than the Manatee average implies; a family-tenant draw the district grade alone would hide.
- Market conditions: Rents soft (-0.9%/yr); 2170 active listings in the ZIP; 2 comparable units currently listed for rent nearby; high-income renter base; 7,472 units permitted in Manatee County in 2024 (1,782 in 5+ unit buildings).
- At $4,854/mo this rent would consume 51% of the median local household income ($114k/yr) (locally 219% of renters already pay >50% of income on rent) — very limited rent-growth headroom before tenants either downsize or default.
Forward outlook
- Local home prices are declining (-3.0%/yr); year-one equity from $3k of loan paydown is wiped out by about $13k of value loss. Plan a longer hold.
- Manatee County population projected at +43% by 2050 — long-run rental-demand tailwind backs the buy-and-hold thesis.
Negotiation context
- It's been on market 44 days — a 3% lower offer ($422k) is reasonable based on typical stale-listing flexibility.
- 3 sale attempts since 4y ago with the ask held roughly flat each time — persistent listings suggest the price (not the market) is what's stuck; bring a comps-based counter.
Risks & watch-outs
- Watch-outs: flood insurance adds $427/mo.
- Climate carrying-cost: in FEMA flood zone AE (mandatory federal flood insurance); severe wind risk, 99% chance of damaging wind over 30y; extreme-heat days projected 7→27/yr by 2055 (HVAC capex compounding) — expect insurance premiums to compound above CPI over the hold.
Questions for the listing agent
- It's been on market 44 days. Have you received any prior offers? Is the seller open to a 3% concession, seller financing, or rate buy-down credit?
- What's the actual annual flood-insurance premium (NFIP or private), and is the property in a SFHA with mandatory coverage?
- What does the HOA fee cover, when was the last increase, and are there any pending special assessments or reserve-fund shortfalls?
- Is there a deadline driving the sale (1031 exchange, divorce, estate, relocation)? That informs how much negotiation room exists.
- What's the average days-on-market for RENTAL listings here right now (not sales)? A rising rental-DOM trend means longer vacancies and softer asking-rent achievability than the comps imply.
- What's the recent tenant-quality profile in this submarket — average credit score on applications, eviction rate, late-payment / NSF rate, and stable-employment percentage? A property-management company in the area should have these aggregated.
- How much new for-sale + rental construction is in the pipeline within 1–3 miles? Heavy new supply typically softens prices + rents 12–24 months out; constrained supply supports both.
Investment metrics
- 1% rule
- 1.12% ✓
- Cap rate
- 8.46%
- Cash-on-cash
- 7.75%
- DSCR
- 1.35
- GRM
- 7.5
CMA / ARV
- ARV (on-the-fly)
- $461,370
- Comps found
- 7
Show comp detail 7 sales within ~0.75 mi
| Address | Dist | Beds/Ba | Sqft | Sold | Price | $/sf | Match |
|---|---|---|---|---|---|---|---|
| 14514 20th St E | 0.07mi | 4/3.0 | 2,197 (0%) | 2mo | $450,000 | $205 | 96 |
| 14620 20th St E | 0.15mi | 4/3.0 | 2,197 (0%) | 3mo | $413,500 | $188 | 91 |
| 14519 Banks Ct | 0.32mi | 4/3.0 | 2,170 (-1%) | 1mo | $444,999 | $205 | 82 |
| 14314 17th Ct E | 0.21mi | 3/2.5 (-1) | 2,129 (-3%) | 5mo | $462,500 | $217 | 74 |
| 14404 20th St E | 0.04mi | 4/3.0 | 2,139 (-3%) | 24mo | $450,000 | $210 | 74 |
| 1825 Twin Rivers Trl | 0.20mi | 4/3.0 | 2,309 (+5%) | 10mo | $730,000 | $316 | 74 |
| 13805 22nd Ct E | 0.59mi | 4/3.0 | 2,446 (+11%) | 23mo | $660,000 | $270 | 34 |
Match score weights: distance 35% · size 25% · config 20% · recency 20%. Top-matched comps best support the ARV.
Projected returns pro-forma
-3.0% appreciation · 0.0% rent growth · sell at horizon
- IRR
- -14.6%
- Equity multiple
- 0.50×
- Total profit
- $-61,390
- Equity at exit
- $64,860
- IRR
- -12.8%
- Equity multiple
- 0.36×
- Total profit
- $-77,395
- Equity at exit
- $37,611
Cash invested: $121,800 (down + closing). Projections, not guarantees.
Landlord ↔ Tenant lean methodology
- Overall (STATE)
- 87 Strongly Landlord-Friendly
- State Florida
- 87 Strongly Landlord-Friendly · R+3
- County
- — inherits STATE
- City
- — inherits STATE
ZIP-level market 34219
- Home prices YoY
- -23.7%
- Rents YoY
- -0.9%
- Active inventory
- 2170
- Price-to-rent
- 7.5×
Monthly cashflow live
- Estimated rent
- $4,854 medium interval (Pro) →
- Mortgage (P&I)
- −$2,281
- Tax from tax record
- −$411 /mo · $4,929/yr
- Insurance
- −$181
- Flood insurance flood zone
- −$427 /mo · $5,118/yr
- HOA
- −$174
- Vacancy / Maint / Mgmt
- −$1,019
- Net cashflow
- $361
Break-even live
UW: 25.0% down · 7.5% · 30yr · 1.5% tax · 5.0% vac · 8.0% maint · 8.0% mgmt
Financing live
Cash to close
- Down payment
- $108,750
- Closing costs
- $13,050
- Reserves months
- —
- Total cash needed
- —
Loan-product check · same deal, 3 products live
Conventional
25% down · 7.5% · 30yr
- Down + closing
- —
- Monthly P&I
- —
- Monthly cashflow
- —
- DSCR
- —
- Eligible?
- —
Personal DTI + credit; lowest rate.
DSCR
20% down · 8.5% · 30yr
- Down + closing
- —
- Monthly P&I
- —
- Monthly cashflow
- —
- DSCR
- —
- Eligible?
- —
No personal income docs; deal must DSCR.
Hard money
10% down · 12.0% · 12mo
- Down + closing
- —
- Monthly P&I
- —
- Monthly cashflow
- —
- DSCR
- —
- Eligible?
- —
Short-term bridge; refi at stabilization.
Rent comps 2 comps
| Address | Beds | Baths | Sqft | Rent | $/sqft | DOM | Units | Dist |
|---|---|---|---|---|---|---|---|---|
| 1043 145th Street Cir NE Bradenton, FL | 3.0 | 3.0 | 2600 | $7,000 | $2.69 | 21d | 1 | 0.99mi |
| 16457 Woodside Gln Parrish, FL | 4.0 | 3.0 | 2748 | $3,800 | $1.38 | 23d | 1 | 1.37mi |
HOA detail
- Monthly dues
- $174 · $2,088/yr
Listing history 19 events
-
2026-06-18days on market $435,000 Active 44 DOM
-
2026-06-17days on market $435,000 Active 43 DOM
-
2026-06-16days on market $435,000 Active 42 DOM
-
2026-06-15days on market $435,000 Active 41 DOM
-
2026-06-13days on market $435,000 Active 39 DOM
-
2026-06-13days on market $435,000 Active 38 DOM
-
2026-06-10days on market $435,000 Active 36 DOM
-
2026-06-09days on market $435,000 Active 35 DOM
-
2026-06-08days on market $435,000 Active 34 DOM
-
2026-06-08pricedays on market $435,000 Active 33 DOM
-
2026-06-03days on market $438,500 Active 29 DOM
-
2026-06-02pricedays on market $438,500 Active 28 DOM
-
2026-06-01days on market $442,000 Active 27 DOM
-
2026-05-31days on market $442,000 Active 26 DOM
-
2026-05-05$442,000 Active
-
2024-10-23price $459,000
-
2024-09-26$465,000 Active
-
2022-03-18soldstatus $446,044
-
2022-03-18$446,044
ⓘ Source: listings_history table (triggers on properties + properties_extension) + one-shot
backfill from property_details.listing_events for pre-trigger history.
Tax reassessment forecast FL · Resets to sale price
- Current annual tax
- $4,929 · $411/mo
- Projected year-2 tax
- $4,929 · $411/mo
- Expected delta
- $0/yr ($0/mo · 0.0%)
ⓘ Screening estimate from a state-policy table — verify with the county assessor before closing.
Climate risk First Street
- Flood 5/10 Major FEMA zone AE · 22% chance over 30 yrs
- Wildfire 4/10 Moderate
- Heat 10/10 Extreme 7 d/yr ≥107°F today · 27 d/yr by 30 yrs out
- Wind 10/10 Extreme 99% chance of damaging wind over 30 yrs
- Air quality 3/10 Moderate 3 unhealthy d/yr today · 3 by 30 yrs out
Nearby sold comps map
Loading sold comps map…
Walkable amenities ~0.75 mi
Loading nearby amenities…
Taxation est. · year 1
- Rental income
- $58,242
- − Mortgage interest
- −$24,367
- − Property taxes
- −$4,929
- − Insurance
- −$7,294
- − Repairs & maintenance
- −$4,659
- − Management
- −$4,659
- − HOA
- −$2,088
- − Depreciation
- −$12,655
- Taxable loss
- −$2,409
- Est. tax savings @ 24.0%
- +$578
- After-tax cash flow
- $4,904/yr
For passive investors: Depreciation is non-cash, so a rental often shows a tax loss while cash-flowing — sheltering income. Rental losses are passive: they offset passive income freely, and up to $25,000/yr can offset ordinary (W-2) income if you actively participate and your MAGI is under $100k (phasing out to $0 by $150k); unused losses carry forward. On sale, claimed depreciation is recaptured at up to 25%, and gains may owe capital-gains tax (a 1031 exchange can defer both). Figures are a year-1 estimate at your 24.0% rate — not tax advice; consult a CPA.
Condition & rehab AI · 6 photos
This 2022-built home in The Cove at Twin Rivers is in good condition with a modern kitchen and bathrooms. It offers a good investment opportunity with potential for minor updates to enhance its curb appeal and value.
Value-add opportunities
- Both Painting the exterior and interior walls — Fresh paint can enhance curb appeal and interior aesthetics.
- Both Landscaping improvements — A well-maintained yard can increase both resale and rental value.
- Both Updating light fixtures — Modern light fixtures can improve the home's curb appeal and functionality.
Renovation cost estimate screening
Value-add ROI direction
- Both Painting the exterior and interior walls — Fresh paint can enhance curb appeal and interior aesthetics. ↑
- Both Landscaping improvements — A well-maintained yard can increase both resale and rental value. ↑
- Both Updating light fixtures — Modern light fixtures can improve the home's curb appeal and functionality. ↑
ⓘ Cost ranges are severity-bucket heuristics (US national rule-of-thumb). Get contractor quotes + a written scope before underwriting a rehab budget.
Schools (NCES district)
- District
- Manatee
- NCES district ID
- 1201230
- Math proficiency
- 54% ▼ -6.00%
- Reading proficiency
- 50% ▼ -2.00%
- Median HH income
- $49,607
- Composite
- 44.43/100
- National rank
- #2806
- State rank
- #26 of 73 in FL
Livability — Lakewood Ranch
No livability data for this city. (Only ~50 U.S. cities are tracked.)
Census & demographics
- County
- Manatee County · 416,364 people
- City population
- 52,177
- Metro
- North Port-Sarasota-Bradenton, FL
- Population (ZIP)
- 33,296
- Household income
- $113,773
- Rent vs Own
- Severe rent burden
- 219.0
Population outlook (Manatee County) Hauer SSP2
- Today (2025)
- 447,342 people
- By 2030
- 488,911 · +9.3%
- By 2040
- 567,934 · +27.0%
- By 2050
- 637,995 · +42.6%
- By 2075
- 781,970 · +74.8%
- By 2100
- 848,272 · +89.6%
Race, ethnicity, and origin ACS 2023
- Neighborhood character
- Predominantly White (75%)
- Race & ethnicity
- White 75% Hispanic / Latino 11% Two or more races 8% Black 8% Asian 2%
- Hispanic origin (detail)
- Mexican 2% Puerto Rican 3%
- Common ancestry
- Romanian 4% Hispanic 2% Russian 2%
- Foreign-born
- 10% · Canada, Dominican Republic, Jamaica
- Languages at home
- 88% English-only · Spanish 7% French/Haitian/Cajun 2% Other Asian/Pacific 1%
Political lean MEDSL · Manatee
- 2024 margin
- Strong R (+23.5) · D 37.9% · R 61.4%
- 2008→2024 swing
- -16.5pp toward R · 2008: -7.0pp · 2024: -23.5pp
- All cycles
- 2024: R+23.5 2020: R+16.1 2016: R+17.1 2012: R+12.5 2008: R+7.0
Not yet ingested
- Civics
- —
Market trends
- HPI YoY
- ▼ -84.45%
- Current HPI
- 271.7131
- Rent YoY
- ▼ -0.95%
- Metro
- North Port-Sarasota-Bradenton, FL
- State GDP YoY
- ▲ 3.28%
- F500 in state
- 36
Industry mix (Fortune 500 HQ in FL)
| Industry | F500 HQs | Revenue |
|---|---|---|
| Industrial Technology | 2 | $29B |
|
||
| Insurance | 2 | $17B |
|
||
| Retail | 1 | $60B |
|
||
| Technology Distribution | 1 | $58B |
|
||
| Homebuilding | 1 | $35B |
|
||
| Technology Manufacturing | 1 | $35B |
|
||
Price history
-0.9% since first listed5 events — show timeline
- 2026-05-05 Listed $442,000 Stellar MLS as Distributed by MLS Grid
- 2024-10-23 Price Changed $459,000 Stellar MLS as Distributed by MLS Grid
- 2024-09-26 Listed $465,000 Stellar MLS as Distributed by MLS Grid
- 2022-03-18 Listed $446,044 Stellar MLS as Distributed by MLS Grid
- 2022-03-18 Sold (MLS) $446,044 Stellar MLS as Distributed by MLS Grid
Property tax history
+49.2%/yrLatest (2025): $4,929 · -2.2% YoY. Source: county tax records.
Cash-flow waterfall
monthlySold comps — $/sqft
last 12 mo · ≤1 miLoading sold comps…