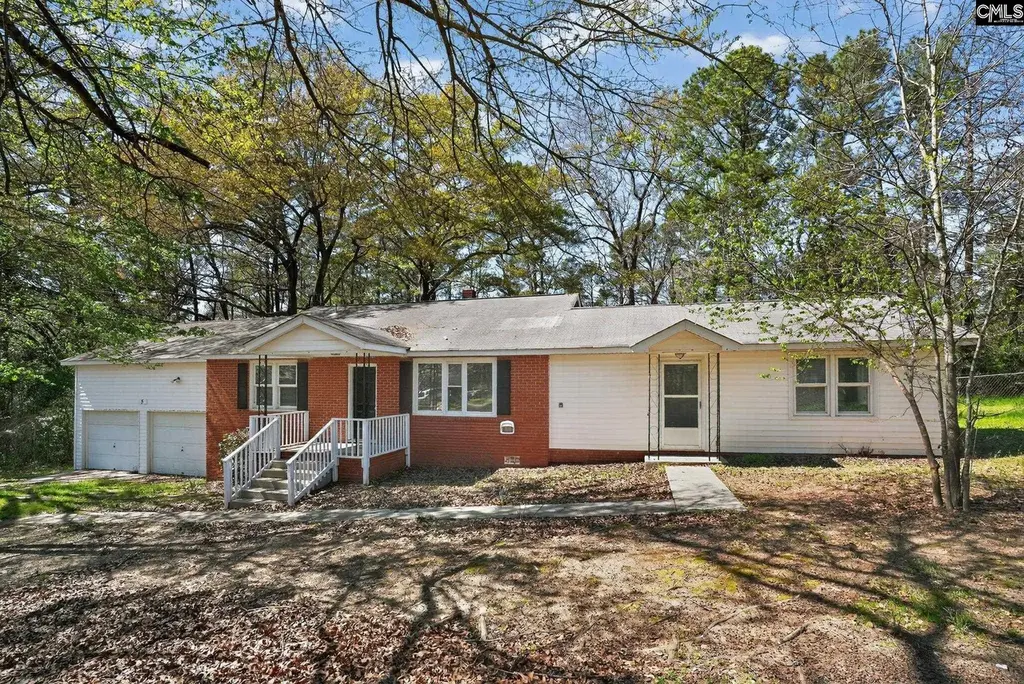
5 Larkin Ct · Blythewood, SC
Flood risk 1/10 · Minimal
- FEMA flood zone
- X (unshaded)
- Chance of flooding over 30 yrs
- 0.0%
- Est. flood insurance / yr
- $507 – $1,088
Fire risk 5/10 · Moderate
- Est. fire insurance / yr
- $783 – $1,453
Heat risk 6/10 · Moderate
- Hot days now (above 108°F)
- 7 days/yr
- Hot days in 30 yrs
- 16 days/yr
Wind risk 6/10 · Moderate
- Chance of severe wind over 30 yrs
- 56.0%
Air-quality risk 3/10 · Minor
- Unhealthy air days now
- 2 days/yr
- Unhealthy air days in 30 yrs
- 2 days/yr
Risk factors via First Street. Map © Google.
Why this score? — see what drove the D- grade
The composite is a weighted blend of 9 inputs, each scored 0–100. Each bar is that input's sub-score; the figure is the points it added to the 100-point composite (weight × sub-score).
- Cash flow +10.0/30.0
- ARV discount +7.5/15.0
- Livability +3.5/5.0
- Rent growth +3.1/5.0
- 1% rule +3.0/10.0
- DSCR +2.9/10.0
- Schools +2.6/10.0
- Condition / age +2.5/5.0
- Appreciation +0.0/10.0
$189,900
🖨 Deal sheet 📄 Offer letter ✓ Due diligence
Listing remarks
Welcome to this inviting home tucked away on a quiet cul-de-sac in Columbia! Located in Richland County, 5 Larkin Ct offers a great blend of comfort, convenience, and value. The home features a functional floor plan with bright living spaces, perfect for both relaxing and entertaining. The kitchen provides ample cabinet and counter space and flows easily into the dining and living areas, creating a warm and connected feel. The bedrooms are well-sized, offering flexibility for family, guests, or a home office, while the primary suite provides a peaceful retreat. Enjoy the outdoors with a spacious yard—ideal for gatherings, pets, or simply unwinding. The cul-de-sac location adds privacy
Key facts
- Cul-de-sac location
- Spacious yard
- 0.58 acre lot
Tags
Property features AI
Exterior
- Parking: Attached garage with 2 spaces (main level)
- Utilities: Public water; Public sewer
- Home design: Single-story home
- Construction: Slab foundation
- Exterior features: Deck; Brick exterior above foundation; Paved road access
Interior
- Kitchen: Granite and tile countertops; Vinyl flooring in the kitchen
- Bedrooms: Primary bedroom on the main level
- Flooring: Vinyl flooring (kitchen)
- Bathrooms: Two full bathrooms
- Heating & cooling: Central heating; Central air conditioning
- Interior features: Dishwasher; Refrigerator; Free-standing range
- Laundry & utility: Laundry in utility room
Neighborhood map
What this means for you Summary
Snapshot
- This is a 3-bed/2.0-bath single-family listed at $190k.
Deal economics
- At list price, monthly cash flow is $-113 ($-1k/yr) — negative.
- To cash-flow at today's rent, offer at most $170k (10.5% below list).
- To meet the 1% rule (rent ≥ 1% of price), the offer needs to be $152k (19.7% below list).
- Recommended offer: $152k (19.7% below list) — sets the bar for 1% rule.
Location & tenants
- Location reads 70/100 on livability (#58 in SC) — a middle-class / working-renter tenant base. Strengths: crime A+, employment A+, housing A+; Watch: amenities F, commute F, health & safety F.
- Richland 01 (urban): math 26% / reading 36% proficiency, ranked #54 of 80 in SC (top 68%) — families likely to look elsewhere, expect single-tenant / working-renter base with shorter leases; 64% free/reduced lunch — lower-income household profile, screen leases tightly.
- Zoned schools: Forest Heights Elementary (math 12% / reading 12%, grade F, #572 of 597 statewide, top 97%, 441 students, 100% FRL); Eau Claire High (math 22% / reading 84%, grade C-, #139 of 196 statewide, top 71%, 627 students, 100% FRL) — zoned schools average 100% FRL vs 64% district-wide (36 pts higher); higher-poverty schools than district average — tighter screening recommended.
- Market conditions: Rents rising (+2.5%/yr); 238 active listings in the ZIP; 1 comparable units currently listed for rent nearby; 3,472 units permitted in Richland County in 2024 (1,096 in 5+ unit buildings).
- This rent runs 40% of the median local income ($46k/yr) — at the standard rent-burdened threshold; future hikes will face affordability resistance.
Forward outlook
- Local home prices are declining (-3.0%/yr); year-one equity from $1k of loan paydown is wiped out by about $6k of value loss. Plan a longer hold.
- Richland County population projected at +30% by 2050 — long-run rental-demand tailwind backs the buy-and-hold thesis.
Negotiation context
- It's been on market 61 days — a 6% lower offer ($179k) is reasonable based on typical stale-listing flexibility.
- 2 sale attempts since 11y ago; this cycle's ask has dropped $15k (7%) from the opening price — seller is motivated, your offer sets the floor, not the list.
- Current owner paid $73k; list at $190k implies a 160% gain — meaningful room to come down on a strong offer.
Risks & watch-outs
- Climate carrying-cost: major wind risk, 56% chance of damaging wind over 30y; moderate wildfire risk; extreme-heat days projected 7→16/yr by 2055 (HVAC capex compounding) — expect insurance premiums to compound above CPI over the hold.
Questions for the listing agent
- What do current leases actually rent for vs. the listed asking? Can we see a recent rent roll and the last 12 months of T-12 income?
- It's been on market 61 days. Have you received any prior offers? Is the seller open to a 20% concession, seller financing, or rate buy-down credit?
- Why hasn't it sold? Are there any deal-killer items the seller is aware of (foundation, flood, title, zoning, code violations)?
- Is there a deadline driving the sale (1031 exchange, divorce, estate, relocation)? That informs how much negotiation room exists.
- Schools are B-rated — typically a magnet for longer-tenancy family renters. What's the average tenant stay here, and is there a school-zone premium baked into asking?
- The area grade is low — what's the realistic commute time and amenity access for the typical tenant pool here? Any planned neighborhood developments (good or bad) we should know about?
- What's the average days-on-market for RENTAL listings here right now (not sales)? A rising rental-DOM trend means longer vacancies and softer asking-rent achievability than the comps imply.
- What's the recent tenant-quality profile in this submarket — average credit score on applications, eviction rate, late-payment / NSF rate, and stable-employment percentage? A property-management company in the area should have these aggregated.
- How much new for-sale + rental construction is in the pipeline within 1–3 miles? Heavy new supply typically softens prices + rents 12–24 months out; constrained supply supports both.
Investment metrics
- 1% rule
- 0.80% ✗
- Cap rate
- 5.58%
- Cash-on-cash
- -2.55%
- DSCR
- 0.89
- GRM
- 10.4
CMA / ARV
No comps found within radius.
Projected returns pro-forma
-3.0% appreciation · 2.5% rent growth · sell at horizon
- IRR
- -21.1%
- Equity multiple
- 0.27×
- Total profit
- $-38,706
- Equity at exit
- $28,315
- IRR
- -15.7%
- Equity multiple
- 0.14×
- Total profit
- $-45,965
- Equity at exit
- $16,419
Cash invested: $53,172 (down + closing). Projections, not guarantees.
Landlord ↔ Tenant lean methodology
- Overall (STATE)
- 90 Strongly Landlord-Friendly
- State South Carolina
- 90 Strongly Landlord-Friendly · R+6
- County
- — inherits STATE
- City
- — inherits STATE
ZIP-level market 29203
- Home prices YoY
- -31.6%
- Rents YoY
- 2.5%
- Active inventory
- 238
- Price-to-rent
- 10.4×
Monthly cashflow live
- Estimated rent
- $1,524 medium interval (Pro) →
- Mortgage (P&I)
- −$996
- Tax from tax record
- −$242 /mo · $2,907/yr
- Insurance
- −$79
- HOA
- −$0
- Vacancy / Maint / Mgmt
- −$320
- Net cashflow
- $-113
Break-even live
UW: 25.0% down · 7.5% · 30yr · 1.5% tax · 5.0% vac · 8.0% maint · 8.0% mgmt
Financing live
Cash to close
- Down payment
- $47,475
- Closing costs
- $5,697
- Reserves months
- —
- Total cash needed
- —
Loan-product check · same deal, 3 products live
Conventional
25% down · 7.5% · 30yr
- Down + closing
- —
- Monthly P&I
- —
- Monthly cashflow
- —
- DSCR
- —
- Eligible?
- —
Personal DTI + credit; lowest rate.
DSCR
20% down · 8.5% · 30yr
- Down + closing
- —
- Monthly P&I
- —
- Monthly cashflow
- —
- DSCR
- —
- Eligible?
- —
No personal income docs; deal must DSCR.
Hard money
10% down · 12.0% · 12mo
- Down + closing
- —
- Monthly P&I
- —
- Monthly cashflow
- —
- DSCR
- —
- Eligible?
- —
Short-term bridge; refi at stabilization.
Rent comps 1 comps
| Address | Beds | Baths | Sqft | Rent | $/sqft | DOM | Units | Dist |
|---|---|---|---|---|---|---|---|---|
| 1 Larkin Ct Columbia, SC | 3.0 | 2.0 | 1248 | $1,195 | $0.96 | 23d | 1 | 0.11mi |
Listing history 16 events
-
2026-06-18days on market $189,900 Active 61 DOM
-
2026-06-17days on market $189,900 Active 60 DOM
-
2026-06-16days on market $189,900 Active 59 DOM
-
2026-06-15pricedays on market $189,900 Active 58 DOM
-
2026-06-14days on market $204,900 Active 56 DOM
-
2026-06-10days on market $204,900 Active 53 DOM
-
2026-06-09days on market $204,900 Active 52 DOM
-
2026-06-08statusdays on market $204,900 Active 51 DOM
-
2026-05-15status Pending
-
2026-04-30historical Active - Contingent
-
2026-03-26$204,900 Active
-
2015-01-07soldstatus $73,000
-
2015-01-06soldstatus $73,000
-
2015-01-03$73,000
-
2005-05-13soldstatus $73,000
-
2005-05-13soldstatus $73,000
ⓘ Source: listings_history table (triggers on properties + properties_extension) + one-shot
backfill from property_details.listing_events for pre-trigger history.
Tax reassessment forecast SC · Resets to sale price
- Current annual tax
- $2,907 · $242/mo
- Projected year-2 tax
- $2,907 · $242/mo
- Expected delta
- $0/yr ($0/mo · 0.0%)
ⓘ Screening estimate from a state-policy table — verify with the county assessor before closing.
Climate risk First Street
- Flood 1/10 Low FEMA zone X (unshaded) · 0% chance over 30 yrs
- Wildfire 5/10 Major
- Heat 6/10 Major 7 d/yr ≥108°F today · 16 d/yr by 30 yrs out
- Wind 6/10 Major 56% chance of damaging wind over 30 yrs
- Air quality 3/10 Moderate 2 unhealthy d/yr today · 2 by 30 yrs out
Nearby sold comps map
Loading sold comps map…
Walkable amenities ~0.75 mi
Loading nearby amenities…
Taxation est. · year 1
- Rental income
- $18,292
- − Mortgage interest
- −$10,637
- − Property taxes
- −$2,907
- − Insurance
- −$950
- − Repairs & maintenance
- −$1,463
- − Management
- −$1,463
- − Depreciation
- −$5,524
- Taxable loss
- −$4,653
- Est. tax savings @ 24.0%
- +$1,117
- After-tax cash flow
- $-239/yr
For passive investors: Depreciation is non-cash, so a rental often shows a tax loss while cash-flowing — sheltering income. Rental losses are passive: they offset passive income freely, and up to $25,000/yr can offset ordinary (W-2) income if you actively participate and your MAGI is under $100k (phasing out to $0 by $150k); unused losses carry forward. On sale, claimed depreciation is recaptured at up to 25%, and gains may owe capital-gains tax (a 1031 exchange can defer both). Figures are a year-1 estimate at your 24.0% rate — not tax advice; consult a CPA.
Schools (NCES district)
- District
- Richland 01
- NCES district ID
- 4503360
- Math proficiency
- 26% ▼ -7.00%
- Reading proficiency
- 36% ▼ -5.00%
- Median HH income
- $38,931
- Composite
- 25.94/100
- National rank
- #7335
- State rank
- #54 of 80 in SC
Livability — Blythewood
- Score
- 70/100
- State rank
- #58
- US rank
- #7406
Category grades
Schools grade is shown separately in the Schools card above.
Census & demographics
- County
- Richland County · 389,530 people
- City population
- 30,454
- Metro
- Columbia, SC
- Population (ZIP)
- 40,653
- Household income
- $46,054
- Rent vs Own
- Severe rent burden
- 1980.0
Population outlook (Richland County) Hauer SSP2
- Today (2025)
- 459,667 people
- By 2030
- 487,524 · +6.1%
- By 2040
- 542,035 · +17.9%
- By 2050
- 595,371 · +29.5%
- By 2075
- 732,998 · +59.5%
- By 2100
- 820,415 · +78.5%
Race, ethnicity, and origin ACS 2023
- Neighborhood character
- Predominantly Black (80%)
- Race & ethnicity
- Black 80% White 13% Hispanic / Latino 5% Two or more races 2%
- Common ancestry
- Serbian 1%
- Foreign-born
- 3% · Canada
- Languages at home
- 93% English-only · Spanish 5%
Political lean MEDSL · Richland
- 2024 margin
- Solid D (+34.6) · D 66.4% · R 31.8% · Other 1.8%
- 2008→2024 swing
- +5.7pp toward D · 2008: 28.9pp · 2024: 34.6pp
- All cycles
- 2024: D+34.6 2020: D+38.3 2016: D+32.9 2012: D+33.3 2008: D+28.9
Not yet ingested
- Civics
- —
Market trends
- HPI YoY
- ▼ -77.52%
- Current HPI
- 168.2114
- Rent YoY
- ▲ 2.50%
- Metro
- Columbia, SC
- State GDP YoY
- ▲ 4.51%
- F500 in state
- 2
Industry mix (Fortune 500 HQ in SC)
| Industry | F500 HQs | Revenue |
|---|---|---|
| Packaging | 1 | $7B |
|
||
Price history
+180.7% since first listed8 events — show timeline
- 2026-05-15 Pending — Consolidated MLS
- 2026-04-30 Contingent — Consolidated MLS
- 2026-03-26 Listed $204,900 Consolidated MLS
- 2015-01-07 Sold (Public Records) $73,000 Public Records
- 2015-01-06 Sold (MLS) $73,000 Charleston Trident MLS
- 2015-01-03 Listed $73,000 Charleston Trident MLS
- 2005-05-13 Sold (Public Records) $73,000 Public Records
- 2005-05-13 Sold (Public Records) $73,000 Public Records
Property tax history
+10.8%/yrLatest (2025): $2,907 · +2.5% YoY. Source: county tax records.
Cash-flow waterfall
monthlySold comps — $/sqft
last 12 mo · ≤1 miLoading sold comps…