106 Arbolado Blvd · Gun Barrel City, TX
Flood risk No data
- FEMA flood zone
- —
- Chance of flooding over 30 yrs
- —
- Est. flood insurance / yr
- —
Fire risk No data
- Est. fire insurance / yr
- —
Heat risk No data
- Hot days now (above threshold)
- —
- Hot days in 30 yrs
- —
Wind risk No data
- Chance of severe wind over 30 yrs
- —
Air-quality risk No data
- Unhealthy air days now
- —
- Unhealthy air days in 30 yrs
- —
Risk factors via First Street. Map © Google.
Why this score? — see what drove the C grade
The composite is a weighted blend of 9 inputs, each scored 0–100. Each bar is that input's sub-score; the figure is the points it added to the 100-point composite (weight × sub-score).
- Cash flow +22.1/30.0
- ARV discount +12.6/15.0
- DSCR +7.1/10.0
- 1% rule +5.6/10.0
- Schools +3.8/10.0
- Livability +3.4/5.0
- Condition / age +2.0/5.0
- Rent growth +1.1/5.0
- Appreciation +0.0/10.0
$153,900
🖨 Deal sheet 📄 Offer letter ✓ Due diligence
Listing remarks
@1/4 acre lot with additional 1/4 corner, available. All new install aug. 2023.18x76,owner pays half closing, and HOA trans. fee $750 earn. at colonial title
Key facts
- Built 2024
- Listed 23 days
Neighborhood map
What this means for you Summary
Snapshot
- This is a 3-bed/2.0-bath manufactured listed at $154k. Condition is rated fair.
Deal economics
- At list price, monthly cash flow is $248 ($3k/yr) — positive.
- The deal already cash-flows at list — no discount required.
- Meets the 1% rule at list price ($2k rent vs $154k).
- Recommended offer: $152k (1.5% below list) — sets the bar for market timing.
- Cap rate 8.2% vs local median 3.3% in Gun Barrel City — top-decile yield for the area; either an underpriced asset or a hidden risk that comps aren't pricing in. Stress-test before assuming the spread holds.
Location & tenants
- Location reads 67/100 on livability (#519 in TX) — a middle-class / working-renter tenant base. Strengths: cost of living A+, housing A+, health & safety B+; Watch: employment D+, amenities F, commute F.
- Mabank ISD (town): math 47% / reading 44% proficiency, ranked #273 of 826 in TX (top 33%) — families likely to look elsewhere, expect single-tenant / working-renter base with shorter leases.
- Market conditions: Rents falling (-5.8%/yr); 694 active listings in the ZIP; 10 comparable units currently listed for rent nearby; rentals lingering (median 44d on market — plan ~5-8 weeks vacancy on turnover, expect pricing pressure); 70% of comp listings sitting > 30 days — soft ceiling on asking rent; 263 units permitted in Henderson County in 2024 (0 in 5+ unit buildings).
- This rent runs 32% of the median local income ($61k/yr) — at the standard rent-burdened threshold; future hikes will face affordability resistance.
Forward outlook
- Local home prices are declining (-3.0%/yr); year-one equity from $1k of loan paydown is wiped out by about $5k of value loss. Plan a longer hold.
Negotiation context
- It's been on market 24 days — a 2% lower offer ($152k) is reasonable based on typical stale-listing flexibility.
- 2 sale attempts with the ask held roughly flat each time — persistent listings suggest the price (not the market) is what's stuck; bring a comps-based counter.
Questions for the listing agent
- Have any recent inspections been done? Can we get a copy of the seller's disclosures and any deferred-maintenance estimates?
- Is there a deadline driving the sale (1031 exchange, divorce, estate, relocation)? That informs how much negotiation room exists.
- What's the average days-on-market for RENTAL listings here right now (not sales)? A rising rental-DOM trend means longer vacancies and softer asking-rent achievability than the comps imply.
- What's the recent tenant-quality profile in this submarket — average credit score on applications, eviction rate, late-payment / NSF rate, and stable-employment percentage? A property-management company in the area should have these aggregated.
- How much new for-sale + rental construction is in the pipeline within 1–3 miles? Heavy new supply typically softens prices + rents 12–24 months out; constrained supply supports both.
Investment metrics
- 1% rule
- 1.06% ✓
- Cap rate
- 8.23%
- Cash-on-cash
- 6.91%
- DSCR
- 1.31
- GRM
- 7.8
CMA / ARV
- ARV (on-the-fly)
- $173,736
- Comps found
- 4
Show comp detail 4 sales within ~0.75 mi
| Address | Dist | Beds/Ba | Sqft | Sold | Price | $/sf | Match |
|---|---|---|---|---|---|---|---|
| 153 Tres Lagos Blvd | 0.36mi | 3/2.0 | 1,456 (+6%) | 9mo | $189,500 | $130 | 65 |
| 129 Tara Trace Cir | 0.35mi | 3/2.0 | 1,168 (-15%) | 8mo | $131,000 | $112 | 53 |
| 135 Butler Trl | 0.10mi | 3/2.0 | 1,568 (+15%) | 23mo | $199,900 | $127 | 52 |
| 105 Grande Ln | 0.71mi | 3/2.0 | 1,498 (+10%) | 22mo | $178,000 | $119 | 33 |
Match score weights: distance 35% · size 25% · config 20% · recency 20%. Top-matched comps best support the ARV.
Projected returns pro-forma
-3.0% appreciation · 0.0% rent growth · sell at horizon
- IRR
- -9.1%
- Equity multiple
- 0.68×
- Total profit
- $-13,926
- Equity at exit
- $22,947
- IRR
- -4.2%
- Equity multiple
- 0.76×
- Total profit
- $-10,282
- Equity at exit
- $13,306
Cash invested: $43,092 (down + closing). Projections, not guarantees.
Landlord ↔ Tenant lean methodology
- Overall (STATE)
- 87 Strongly Landlord-Friendly
- State Texas
- 87 Strongly Landlord-Friendly · R+5
- County
- — inherits STATE
- City
- — inherits STATE
ZIP-level market 75156
- Rents YoY
- -5.8%
- Active inventory
- 694
- Price-to-rent
- 7.8×
Monthly cashflow live
- Estimated rent
- $1,639 high interval (Pro) →
- Mortgage (P&I)
- −$807
- Tax from tax record
- −$175 /mo · $2,104/yr
- Insurance
- −$64
- HOA
- −$0
- Vacancy / Maint / Mgmt
- −$344
- Net cashflow
- $248
Break-even live
UW: 25.0% down · 7.5% · 30yr · 1.5% tax · 5.0% vac · 8.0% maint · 8.0% mgmt
Financing live
Cash to close
- Down payment
- $38,475
- Closing costs
- $4,617
- Reserves months
- —
- Total cash needed
- —
Loan-product check · same deal, 3 products live
Conventional
25% down · 7.5% · 30yr
- Down + closing
- —
- Monthly P&I
- —
- Monthly cashflow
- —
- DSCR
- —
- Eligible?
- —
Personal DTI + credit; lowest rate.
DSCR
20% down · 8.5% · 30yr
- Down + closing
- —
- Monthly P&I
- —
- Monthly cashflow
- —
- DSCR
- —
- Eligible?
- —
No personal income docs; deal must DSCR.
Hard money
10% down · 12.0% · 12mo
- Down + closing
- —
- Monthly P&I
- —
- Monthly cashflow
- —
- DSCR
- —
- Eligible?
- —
Short-term bridge; refi at stabilization.
Rent comps 10 comps
| Address | Beds | Baths | Sqft | Rent | $/sqft | DOM | Units | Dist |
|---|---|---|---|---|---|---|---|---|
| 602 Legendary Ln Gun Barrel City, TX | 3.0 | 2.0 | 1452 | $1,600 | $1.10 | 43d | 1 | 0.16mi |
| 367 Box Rd Gun Barrel City, TX | 3.0 | 2.0 | 1216 | $1,600 | $1.32 | 43d | 1 | 0.91mi |
| 138 Loon Bay Dr Gun Barrel City, TX | 3.0 | 2.0 | 1298 | $1,235 | $0.95 | 12d | 1 | 0.95mi |
| 140 Loon Bay Dr Gun Barrel City, TX | 3.0 | 2.0 | 1298 | $1,480 | $1.14 | 43d | 1 | 0.95mi |
| 158 Westview Dr Gun Barrel City, TX | 3.0 | 2.0 | 1298 | $1,314 | $1.01 | 6d | 1 | 1.02mi |
| 149 Sunset Bay Dr Gun Barrel City, TX | 3.0 | 2.0 | 1298 | $1,300 | $1.00 | 24d | 1 | 1.03mi |
| 1319 W Main St Unit 1 Gun Barrel City, TX | 3.0 | 2.5 | 1545 | $1,950 | $1.26 | 43d | 1 | 1.08mi |
| 1319 W Main St #16 Gun Barrel City, TX | 3.0 | 2.5 | 1545 | $1,695 | $1.10 | 43d | 1 | 1.13mi |
| 851 Welch Ln Gun Barrel City, TX | 3.0 | 2.0 | 1745 | $2,200 | $1.26 | 43d | 1 | 1.40mi |
| 112 Queenswood Dr Mabank, TX | 4.0 | 2.0 | 1376 | $1,595 | $1.16 | 43d | 1 | 1.46mi |
Listing history 20 events
-
2026-06-19days on market $153,900 Active 24 DOM
-
2026-06-18days on market $153,900 Active 23 DOM
-
2026-06-17days on market $153,900 Active 22 DOM
-
2026-06-16days on market $153,900 Active 21 DOM
-
2026-06-15days on market $153,900 Active 20 DOM
-
2026-06-14days on market $153,900 Active 18 DOM
-
2026-06-12days on market $153,900 Active 17 DOM
-
2026-06-09days on market $153,900 Active 14 DOM
-
2026-06-08days on market $153,900 Active 13 DOM
-
2026-06-07days on market $153,900 Active 12 DOM
-
2026-06-05days on market $153,900 Active 9 DOM
-
2026-06-03days on market $153,900 Active 8 DOM
-
2026-06-02days on market $153,900 Active 7 DOM
-
2026-06-01days on market $153,900 Active 6 DOM
-
2026-05-31days on market $153,900 Active 5 DOM
-
2026-05-30days on market $153,900 Active 4 DOM
-
2026-05-26$153,900 Active
-
2025-12-31historical
-
2025-11-07price $179,000
-
2025-10-15$183,999 Active
ⓘ Source: listings_history table (triggers on properties + properties_extension) + one-shot
backfill from property_details.listing_events for pre-trigger history.
Tax reassessment forecast TX · Resets to sale price
- Current annual tax
- $2,104 · $175/mo
- Projected year-2 tax
- $2,816 · $235/mo
- Expected delta
- +$712/yr (+$59/mo · 33.8%)
ⓘ Screening estimate from a state-policy table — verify with the county assessor before closing.
Nearby sold comps map
Loading sold comps map…
Walkable amenities ~0.75 mi
Loading nearby amenities…
Taxation est. · year 1
- Rental income
- $19,665
- − Mortgage interest
- −$8,621
- − Property taxes
- −$2,104
- − Insurance
- −$770
- − Repairs & maintenance
- −$1,573
- − Management
- −$1,573
- − Depreciation
- −$4,477
- Taxable income
- $547
- Est. tax owed @ 24.0%
- −$131
- After-tax cash flow
- $2,846/yr
For passive investors: Depreciation is non-cash, so a rental often shows a tax loss while cash-flowing — sheltering income. Rental losses are passive: they offset passive income freely, and up to $25,000/yr can offset ordinary (W-2) income if you actively participate and your MAGI is under $100k (phasing out to $0 by $150k); unused losses carry forward. On sale, claimed depreciation is recaptured at up to 25%, and gains may owe capital-gains tax (a 1031 exchange can defer both). Figures are a year-1 estimate at your 24.0% rate — not tax advice; consult a CPA.
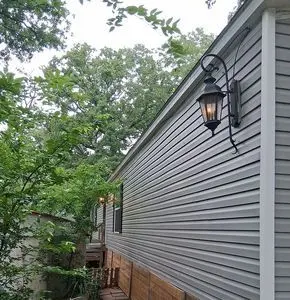
Condition & rehab AI · 1 photo
The home requires moderate renovations, focusing on landscaping and exterior painting to enhance its curb appeal and value.
Repairs flagged
- Minor Landscaping — Overgrown grass and shrubs need trimming
- Minor Exterior lighting — Light fixture appears old and may need replacement
Value-add opportunities
- Both Landscaping — Aesthetic improvements can enhance curb appeal and property value
- Both Exterior painting — Fresh paint can improve the home's appearance and value
Renovation cost estimate screening
| Repair item | Severity | Est. cost |
|---|---|---|
| Landscaping · Overgrown grass and shrubs need trimming | Minor | $500–3,000 |
| Exterior lighting · Light fixture appears old and may need replacement | Minor | $500–3,000 |
| Total estimated repair cost · 2 items | $1,000–6,000 |
Value-add ROI direction
- Both Landscaping — Aesthetic improvements can enhance curb appeal and property value ↑
- Both Exterior painting — Fresh paint can improve the home's appearance and value ↑
ⓘ Cost ranges are severity-bucket heuristics (US national rule-of-thumb). Get contractor quotes + a written scope before underwriting a rehab budget.
Schools (NCES district)
- District
- Mabank ISD
- NCES district ID
- 4828680
- Math proficiency
- 47% ▼ -19.00%
- Reading proficiency
- 44% ▼ -11.00%
- Median HH income
- $40,321
- Composite
- 38.15/100
- National rank
- #4267
- State rank
- #273 of 826 in TX
Livability — Gun Barrel City
- Score
- 67/100
- State rank
- #519
- US rank
- #10212
Category grades
Schools grade is shown separately in the Schools card above.
Census & demographics
- Census place
- Gun Barrel City, TX
- County
- Henderson County · 34,977 people
- Metro
- Athens, TX
- Population (ZIP)
- 16,333
- Household income
- $60,867
- Rent vs Own
- Severe rent burden
- 400.0
Population outlook (Henderson County) Hauer SSP2
- Today (2025)
- 80,471 people
- By 2030
- 80,608 · +0.2%
- By 2040
- 80,087 · -0.5%
- By 2050
- 78,208 · -2.8%
- By 2075
- 72,423 · -10.0%
- By 2100
- 61,012 · -24.2%
Race, ethnicity, and origin ACS 2023
- Neighborhood character
- Predominantly White (85%)
- Race & ethnicity
- White 85% Hispanic / Latino 7% Two or more races 7% Black 1%
- Hispanic origin (detail)
- Mexican 5%
- Common ancestry
- Slovak 3% Serbian 2% European 2%
- Foreign-born
- 4% · Canada, Jamaica
- Languages at home
- 94% English-only · Spanish 4% Other Indo-European 1%
Political lean MEDSL · Henderson
- 2024 margin
- Solid R (+63.5) · D 18.0% · R 81.4%
- 2008→2024 swing
- -18.8pp toward R · 2008: -44.6pp · 2024: -63.5pp
- All cycles
- 2024: R+63.5 2020: R+60.2 2016: R+60.0 2012: R+54.8 2008: R+44.6
Not yet ingested
- Civics
- —
Market trends
- HPI YoY
- ▼ -216.77%
- Current HPI
- 199.8108
- Rent YoY
- ▼ -5.76%
- Metro
- Athens, TX
- State GDP YoY
- ▲ 3.95%
- F500 in state
- 110
Industry mix (Fortune 500 HQ in TX)
| Industry | F500 HQs | Revenue |
|---|---|---|
| Energy | 16 | $1,198B |
|
||
| Technology | 5 | $198B |
|
||
| Engineering / Construction | 4 | $72B |
|
||
| Energy Services | 3 | $60B |
|
||
| Utilities | 3 | $41B |
|
||
| Healthcare | 2 | $330B |
|
||
Price history
-16.4% since first listed4 events — show timeline
- 2026-05-26 Listed $153,900 FSBO.com
- 2025-12-31 Listing Removed — NTREIS
- 2025-11-07 Price Changed $179,000 NTREIS
- 2025-10-15 Listed $183,999 NTREIS
Property tax history
+17.0%/yrLatest (2025): $2,104 · +17.0% YoY. Source: county tax records.
Cash-flow waterfall
monthlySold comps — $/sqft
last 12 mo · ≤1 miLoading sold comps…