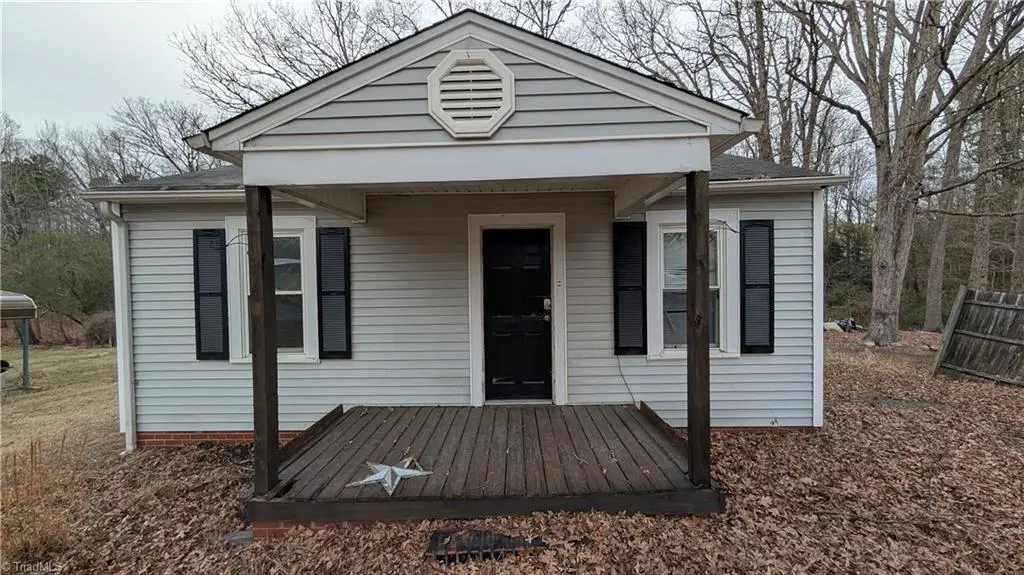
1910 Old Farmer Rd · Asheboro, NC
Flood risk 1/10 · Minimal
- FEMA flood zone
- X (unshaded)
- Chance of flooding over 30 yrs
- 0.0%
- Est. flood insurance / yr
- $507 – $1,088
Fire risk 2/10 · Minimal
- Est. fire insurance / yr
- $906 – $1,684
Heat risk 5/10 · Moderate
- Hot days now (above 102°F)
- 7 days/yr
- Hot days in 30 yrs
- 17 days/yr
Wind risk 6/10 · Moderate
- Chance of severe wind over 30 yrs
- 27.0%
Air-quality risk 2/10 · Minimal
- Unhealthy air days now
- 1 days/yr
- Unhealthy air days in 30 yrs
- 1 days/yr
Risk factors via First Street. Map © Google.
Why this score? — see what drove the D grade
The composite is a weighted blend of 9 inputs, each scored 0–100. Each bar is that input's sub-score; the figure is the points it added to the 100-point composite (weight × sub-score).
- Cash flow +20.5/30.0
- DSCR +6.5/10.0
- 1% rule +4.5/10.0
- Livability +3.6/5.0
- Schools +2.6/10.0
- Rent growth +2.5/5.0
- Condition / age +2.5/5.0
- ARV discount +0.0/15.0
- Appreciation +0.0/10.0
$96,900
🖨 Deal sheet 📄 Offer letter ✓ Due diligence
Listing remarks
Located close to everything, this home is ready for you. Bring your Rocking Chair and relax on the covered front porch. Large back yard for entertaining or outdoor activities. This home has a lot of potential. Bring your personal touch and make it yours today. There is no HVAC, so no heat or AC in the home.
Key facts
- Covered front porch
- Large back yard
- 0.37 acre lot
Tags
Property features AI
Finance
- HOA & community: No homeowners association
Exterior
- Parking: Driveway
- Utilities: Public sewer; Electric water heater
- Home design: Single-story house; Stick/site-built residential property; Built in 1955; Existing structure
- Construction: Vinyl siding; Crawl space foundation
- Exterior features: Public water; Public maintained road; Lot located in Parrish-Ross subdivision; Lot number 23 on a 0.37-acre lot
Interior
- Bathrooms: 1 full bathroom
- Heating & cooling: Electric heating; No central cooling
- Interior features: Primary bedroom on main level
- Laundry & utility: Electric water heater
Neighborhood map
What this means for you Summary
Snapshot
- This is a 2-bed/1.0-bath single-family listed at $97k.
Deal economics
- At list price, monthly cash flow is $127 ($2k/yr) — positive.
- The deal already cash-flows at list — no discount required.
- To meet the 1% rule (rent ≥ 1% of price), the offer needs to be $92k (4.6% below list).
- Recommended offer: $92k (4.6% below list) — sets the bar for 1% rule.
- Cap rate 7.9% vs local median 2.9% in Asheboro — top-decile yield for the area; either an underpriced asset or a hidden risk that comps aren't pricing in. Stress-test before assuming the spread holds.
Location & tenants
- Location reads 72/100 on livability (#85 in NC) — a middle-class / working-renter tenant base. Strengths: cost of living A+, health & safety A+, housing A; Watch: schools F, crime F, amenities F.
- Asheboro City Schools (town): math 29% / reading 33% proficiency, ranked #145 of 178 in NC (top 82%) — families likely to look elsewhere, expect single-tenant / working-renter base with shorter leases; 64% free/reduced lunch — lower-income household profile, screen leases tightly.
- Market conditions: 159 active listings in the ZIP; 3 comparable units currently listed for rent nearby; rentals at typical pace (median 14d on market — plan ~3-4 weeks tenant-placement turnaround); 789 units permitted in Randolph County in 2024 (168 in 5+ unit buildings).
- This rent is only 17% of the median local income ($65k/yr) — well below the 30% rent-burden line; pricing power to push rent on renewal without tenant pushback.
Forward outlook
- Local home prices are declining (-3.0%/yr); year-one equity from $670 of loan paydown is wiped out by about $3k of value loss. Plan a longer hold.
- Randolph County population projected to shrink 10% by 2050 — rents likely to lag national; underwrite the cash flow, not the appreciation.
Negotiation context
- Only 4 days on market — expect competitive offers; lowballing is unlikely to land.
- Current owner paid $51k; list at $97k implies a 90% gain — meaningful room to come down on a strong offer.
Risks & watch-outs
- Watch-outs: built in 1955 — expect roof / HVAC / electrical / plumbing capex.
- Climate carrying-cost: major wind risk, 27% chance of damaging wind over 30y; extreme-heat days projected 7→17/yr by 2055 (HVAC capex compounding) — expect insurance premiums to compound above CPI over the hold.
Questions for the listing agent
- Built in 1955 — when were the roof, HVAC, electrical panel, plumbing, and water heater last replaced?
- Is there a deadline driving the sale (1031 exchange, divorce, estate, relocation)? That informs how much negotiation room exists.
- Schools are F-rated, which usually means shorter tenancies and higher turnover. Who's the typical renter profile here, and what's been the actual vacancy rate?
- Crime grade is F in this area — have there been break-ins, vandalism, or insurance claims at this property in the last 3 years? What carrier currently insures it and at what premium?
- The area grade is low — what's the realistic commute time and amenity access for the typical tenant pool here? Any planned neighborhood developments (good or bad) we should know about?
- What's the average days-on-market for RENTAL listings here right now (not sales)? A rising rental-DOM trend means longer vacancies and softer asking-rent achievability than the comps imply.
- What's the recent tenant-quality profile in this submarket — average credit score on applications, eviction rate, late-payment / NSF rate, and stable-employment percentage? A property-management company in the area should have these aggregated.
- How much new for-sale + rental construction is in the pipeline within 1–3 miles? Heavy new supply typically softens prices + rents 12–24 months out; constrained supply supports both.
Investment metrics
- 1% rule
- 0.95% ✗
- Cap rate
- 7.87%
- Cash-on-cash
- 5.64%
- DSCR
- 1.25
- GRM
- 8.7
CMA / ARV
- ARV (on-the-fly)
- $80,712
- Comps found
- 1
Show comp detail 1 sale within ~0.75 mi
| Address | Dist | Beds/Ba | Sqft | Sold | Price | $/sf | Match |
|---|---|---|---|---|---|---|---|
| 936 Uwharrie St | 0.71mi | 1/1.0 (-1) | 660 (-7%) | 16mo | $75,000 | $114 | 37 |
Match score weights: distance 35% · size 25% · config 20% · recency 20%. Top-matched comps best support the ARV.
Projected returns pro-forma
-3.0% appreciation · 3.0% rent growth · sell at horizon
- IRR
- -7.6%
- Equity multiple
- 0.72×
- Total profit
- $-7,610
- Equity at exit
- $14,448
- IRR
- 1.9%
- Equity multiple
- 1.14×
- Total profit
- $3,719
- Equity at exit
- $8,378
Cash invested: $27,132 (down + closing). Projections, not guarantees.
Landlord ↔ Tenant lean methodology
- Overall (STATE)
- 85 Strongly Landlord-Friendly
- State North Carolina
- 85 Strongly Landlord-Friendly · R+3
- County
- — inherits STATE
- City
- — inherits STATE
ZIP-level market 27205
- Home prices YoY
- -24.4%
- Active inventory
- 159
- Price-to-rent
- 8.7×
Monthly cashflow live
- Estimated rent
- $924 medium interval (Pro) →
- Mortgage (P&I)
- −$508
- Tax from tax record
- −$54 /mo · $652/yr
- Insurance
- −$40
- HOA
- −$0
- Vacancy / Maint / Mgmt
- −$194
- Net cashflow
- $127
Break-even live
UW: 25.0% down · 7.5% · 30yr · 1.5% tax · 5.0% vac · 8.0% maint · 8.0% mgmt
Financing live
Cash to close
- Down payment
- $24,225
- Closing costs
- $2,907
- Reserves months
- —
- Total cash needed
- —
Loan-product check · same deal, 3 products live
Conventional
25% down · 7.5% · 30yr
- Down + closing
- —
- Monthly P&I
- —
- Monthly cashflow
- —
- DSCR
- —
- Eligible?
- —
Personal DTI + credit; lowest rate.
DSCR
20% down · 8.5% · 30yr
- Down + closing
- —
- Monthly P&I
- —
- Monthly cashflow
- —
- DSCR
- —
- Eligible?
- —
No personal income docs; deal must DSCR.
Hard money
10% down · 12.0% · 12mo
- Down + closing
- —
- Monthly P&I
- —
- Monthly cashflow
- —
- DSCR
- —
- Eligible?
- —
Short-term bridge; refi at stabilization.
Rent comps 3 comps
| Address | Beds | Baths | Sqft | Rent | $/sqft | DOM | Units | Dist |
|---|---|---|---|---|---|---|---|---|
| 508 Uwharrie St Asheboro, NC | 1.0 | 1.0 | 600 | $775 | $1.29 | 14d | 2 | 0.83mi |
| 421 Oak Leaf Rd Asheboro, NC | 1.0 | 1.0 | 750 | $1,115 | $1.49 | 14d | 3 | 1.21mi |
| 732 Hammer Ave Unit 806-B Asheboro, NC | 1.0 | 1.0 | 580 | $725 | $1.25 | 23d | 1 | 1.29mi |
Listing history 7 events
-
2026-06-02status $96,900 Pending 4 DOM
-
2026-06-01days on market $96,900 Active 4 DOM
-
2026-05-31days on market $96,900 Active 3 DOM
-
2026-05-31days on market $96,900 Active 2 DOM
-
2026-05-27$96,900 Active
-
2009-10-28soldstatus $51,000
-
1999-07-19soldstatus $51,000
ⓘ Source: listings_history table (triggers on properties + properties_extension) + one-shot
backfill from property_details.listing_events for pre-trigger history.
Tax reassessment forecast NC · Resets to sale price
- Current annual tax
- $652 · $54/mo
- Projected year-2 tax
- $795 · $66/mo
- Expected delta
- +$143/yr (+$12/mo · 21.9%)
ⓘ Screening estimate from a state-policy table — verify with the county assessor before closing.
Climate risk First Street
- Flood 1/10 Low FEMA zone X (unshaded) · 0% chance over 30 yrs
- Wildfire 2/10 Low
- Heat 5/10 Major 7 d/yr ≥102°F today · 17 d/yr by 30 yrs out
- Wind 6/10 Major 27% chance of damaging wind over 30 yrs
- Air quality 2/10 Low 1 unhealthy d/yr today · 1 by 30 yrs out
Nearby sold comps map
Loading sold comps map…
Walkable amenities ~0.75 mi
Loading nearby amenities…
Taxation est. · year 1
- Rental income
- $11,094
- − Mortgage interest
- −$5,428
- − Property taxes
- −$652
- − Insurance
- −$484
- − Repairs & maintenance
- −$888
- − Management
- −$888
- − Depreciation
- −$2,819
- Taxable loss
- −$64
- Est. tax savings @ 24.0%
- +$15
- After-tax cash flow
- $1,545/yr
For passive investors: Depreciation is non-cash, so a rental often shows a tax loss while cash-flowing — sheltering income. Rental losses are passive: they offset passive income freely, and up to $25,000/yr can offset ordinary (W-2) income if you actively participate and your MAGI is under $100k (phasing out to $0 by $150k); unused losses carry forward. On sale, claimed depreciation is recaptured at up to 25%, and gains may owe capital-gains tax (a 1031 exchange can defer both). Figures are a year-1 estimate at your 24.0% rate — not tax advice; consult a CPA.
Schools (NCES district)
- District
- Asheboro City Schools
- NCES district ID
- 3700240
- Math proficiency
- 29% ▼ -7.00%
- Reading proficiency
- 33% ▼ -4.00%
- Median HH income
- $35,167
- Composite
- 25.6/100
- National rank
- #7419
- State rank
- #145 of 178 in NC
Livability — Asheboro
- Score
- 72/100
- State rank
- #85
- US rank
- #5921
Category grades
Schools grade is shown separately in the Schools card above.
Census & demographics
- County
- Randolph County · 81,617 people
- City population
- 60,171
- Metro
- Greensboro-High Point, NC
- Population (ZIP)
- 36,947
- Household income
- $65,167
- Rent vs Own
- Severe rent burden
- 515.0
Population outlook (Randolph County) Hauer SSP2
- Today (2025)
- 142,640 people
- By 2030
- 140,911 · -1.2%
- By 2040
- 135,692 · -4.9%
- By 2050
- 128,575 · -9.9%
- By 2075
- 111,507 · -21.8%
- By 2100
- 93,376 · -34.5%
Race, ethnicity, and origin ACS 2023
- Neighborhood character
- Predominantly White (77%)
- Race & ethnicity
- White 77% Hispanic / Latino 15% Two or more races 7% Black 5%
- Hispanic origin (detail)
- Mexican 11%
- Common ancestry
- Serbian 3% Slovak 3% Romanian 2%
- Foreign-born
- 7% · Canada, Jamaica
- Languages at home
- 85% English-only · Spanish 13% Other Indo-European 1%
Political lean MEDSL · Randolph
- 2024 margin
- Solid R (+57.2) · D 21.0% · R 78.3%
- 2008→2024 swing
- -15.0pp toward R · 2008: -42.3pp · 2024: -57.2pp
- All cycles
- 2024: R+57.2 2020: R+56.3 2016: R+56.7 2012: R+50.2 2008: R+42.3
Not yet ingested
- Civics
- —
Market trends
- HPI YoY
- ▼ -75.63%
- Current HPI
- 234.5927
- Rent YoY
- —
- Metro
- Greensboro-High Point, NC
- State GDP YoY
- ▲ 3.28%
- F500 in state
- 26
Industry mix (Fortune 500 HQ in NC)
| Industry | F500 HQs | Revenue |
|---|---|---|
| Financial Services | 2 | $213B |
|
||
| Retail | 2 | $95B |
|
||
| Industrial Conglomerate | 1 | $38B |
|
||
| Metals / Steel | 1 | $35B |
|
||
| Utilities | 1 | $30B |
|
||
| Industrial Machinery | 1 | $19B |
|
||
Price history
+90.0% since first listed3 events — show timeline
- 2026-05-27 Listed $96,900 Triad MLS
- 2009-10-28 Sold (Public Records) $51,000 Public Records
- 1999-07-19 Sold (Public Records) $51,000 Public Records
Property tax history
+4.4%/yrLatest (2025): $652 · +1.3% YoY. Source: county tax records.
Cash-flow waterfall
monthlySold comps — $/sqft
last 12 mo · ≤1 miLoading sold comps…