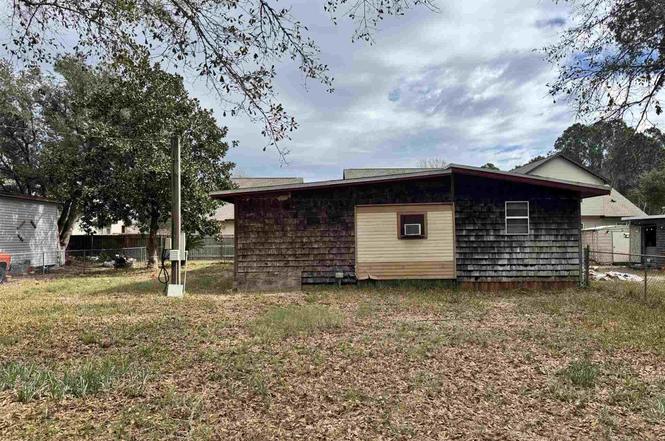
2206 Janet St · Navarre, FL
Flood risk 1/10 · Minimal
- FEMA flood zone
- X (unshaded)
- Chance of flooding over 30 yrs
- 0.0%
- Est. flood insurance / yr
- $507 – $1,088
Fire risk 5/10 · Moderate
- Est. fire insurance / yr
- $947 – $1,759
Heat risk 10/10 · Severe
- Hot days now (above 104°F)
- 7 days/yr
- Hot days in 30 yrs
- 23 days/yr
Wind risk 9/10 · Severe
- Chance of severe wind over 30 yrs
- 99.0%
Air-quality risk 2/10 · Minimal
- Unhealthy air days now
- 1 days/yr
- Unhealthy air days in 30 yrs
- 2 days/yr
Risk factors via First Street. Map © Google.
Why this score? — see what drove the B grade
The composite is a weighted blend of 9 inputs, each scored 0–100. Each bar is that input's sub-score; the figure is the points it added to the 100-point composite (weight × sub-score).
- Cash flow +30.0/30.0
- 1% rule +10.0/10.0
- DSCR +10.0/10.0
- ARV discount +7.5/15.0
- Schools +5.3/10.0
- Livability +3.5/5.0
- Rent growth +3.2/5.0
- Condition / age +2.5/5.0
- Appreciation +0.0/10.0
$64,002
🖨 Deal sheet 📄 Offer letter ✓ Due diligence
Listing remarks
* * ATTN Investors, Builders and Developers * * Property is priced well below market value. This property is considered to be a tear down in order to make way for new construction which is dominating the area. For that reason no home inspections will be allowed and any buyers should due their due diligence prior to making an offer. Sellers terms are listed below and are not negotiable. SELLER: JAWCO HOMES LLC PRICE: $64,002.00 $5500 EMD 0 DAY INSPECTION CLOSING DATE 10 DAYS POST PROBATE SELLER CHOOSES TITLE NON NEGOTIABLE CAN NOT ASSIGN
Key facts
- 0.38 acre lot
- Built 1962
- Listed 21 days
Neighborhood map
What this means for you Summary
Snapshot
- This is a 3-bed/1.0-bath manufactured listed at $64k.
Deal economics
- At list price, monthly cash flow is $1k ($15k/yr) — positive.
- The deal already cash-flows at list — no discount required.
- Meets the 1% rule at list price ($2k rent vs $64k).
- Recommended offer: $63k (1.5% below list) — sets the bar for market timing.
- Cap rate 29.3% vs local median 4.2% in Navarre — top-decile yield for the area; either an underpriced asset or a hidden risk that comps aren't pricing in. Stress-test before assuming the spread holds.
Location & tenants
- Location reads 70/100 on livability (#435 in FL) — a middle-class / working-renter tenant base. Strengths: housing A+, employment A, schools A-; Watch: health & safety C-, amenities F, commute F.
- Santa Rosa (suburban): math 63% / reading 60% proficiency, ranked #8 of 73 in FL (top 11%) — acceptable for families but not a draw, mixed tenant base, ~2y average lease.
- Market conditions: Rents rising (+2.7%/yr); 768 active listings in the ZIP; 23 comparable units currently listed for rent nearby; rentals at typical pace (median 24d on market — plan ~3-4 weeks tenant-placement turnaround); solid renter incomes; 1,983 units permitted in Santa Rosa County in 2024 (128 in 5+ unit buildings).
Forward outlook
- Local home prices are declining (-3.0%/yr); year-one equity from $442 of loan paydown is wiped out by about $2k of value loss. Plan a longer hold.
- Santa Rosa County population projected at +31% by 2050 — long-run rental-demand tailwind backs the buy-and-hold thesis.
- At projected returns (-3.0% appreciation + 2.7% rent growth), your $18k cash investment doubles in ~2 years — after that, you're playing with house money.
Negotiation context
- It's been on market 21 days — a 2% lower offer ($63k) is reasonable based on typical stale-listing flexibility.
- Current owner paid $16k; list at $64k implies a 300% gain — meaningful room to come down on a strong offer.
Risks & watch-outs
- Climate carrying-cost: severe wind risk, 99% chance of damaging wind over 30y; moderate wildfire risk; extreme-heat days projected 7→23/yr by 2055 (HVAC capex compounding) — expect insurance premiums to compound above CPI over the hold.
Questions for the listing agent
- Built in 1962 — when were the roof, HVAC, electrical panel, plumbing, and water heater last replaced?
- Is there a deadline driving the sale (1031 exchange, divorce, estate, relocation)? That informs how much negotiation room exists.
- Schools are A-rated — typically a magnet for longer-tenancy family renters. What's the average tenant stay here, and is there a school-zone premium baked into asking?
- What's the average days-on-market for RENTAL listings here right now (not sales)? A rising rental-DOM trend means longer vacancies and softer asking-rent achievability than the comps imply.
- What's the recent tenant-quality profile in this submarket — average credit score on applications, eviction rate, late-payment / NSF rate, and stable-employment percentage? A property-management company in the area should have these aggregated.
- How much new for-sale + rental construction is in the pipeline within 1–3 miles? Heavy new supply typically softens prices + rents 12–24 months out; constrained supply supports both.
Investment metrics
- 1% rule
- 3.35% ✓
- Cap rate
- 29.28%
- Cash-on-cash
- 82.09%
- DSCR
- 4.65
- GRM
- 2.5
CMA / ARV
- ARV (on-the-fly)
- $164,352
- Comps found
- 2
Show comp detail 2 sales within ~0.75 mi
| Address | Dist | Beds/Ba | Sqft | Sold | Price | $/sf | Match |
|---|---|---|---|---|---|---|---|
| 2244 Jeannie St | 0.18mi | 3/2.0 | 1,404 (+9%) | 2mo | $179,500 | $128 | 70 |
| 2240 Crescent Wood Rd | 0.37mi | 3/2.0 | 1,152 (-10%) | 5mo | $78,000 | $68 | 57 |
Match score weights: distance 35% · size 25% · config 20% · recency 20%. Top-matched comps best support the ARV.
Projected returns pro-forma
-3.0% appreciation · 2.74% rent growth · sell at horizon
- IRR
- 82.1%
- Equity multiple
- 4.75×
- Total profit
- $67,194
- Equity at exit
- $9,543
- IRR
- 85.4%
- Equity multiple
- 9.76×
- Total profit
- $156,961
- Equity at exit
- $5,534
Cash invested: $17,921 (down + closing). Projections, not guarantees.
Landlord ↔ Tenant lean methodology
- Overall (STATE)
- 87 Strongly Landlord-Friendly
- State Florida
- 87 Strongly Landlord-Friendly · R+3
- County
- — inherits STATE
- City
- — inherits STATE
ZIP-level market 32566
- Home prices YoY
- -26.2%
- Rents YoY
- 2.7%
- Active inventory
- 768
- Price-to-rent
- 2.5×
Monthly cashflow live
- Estimated rent
- $2,146 high interval (Pro) →
- Mortgage (P&I)
- −$336
- Tax from tax record
- −$107 /mo · $1,282/yr
- Insurance
- −$27
- HOA
- −$0
- Vacancy / Maint / Mgmt
- −$451
- Net cashflow
- $1,226
Break-even live
UW: 25.0% down · 7.5% · 30yr · 1.5% tax · 5.0% vac · 8.0% maint · 8.0% mgmt
Financing live
Cash to close
- Down payment
- $16,000
- Closing costs
- $1,920
- Reserves months
- —
- Total cash needed
- —
Loan-product check · same deal, 3 products live
Conventional
25% down · 7.5% · 30yr
- Down + closing
- —
- Monthly P&I
- —
- Monthly cashflow
- —
- DSCR
- —
- Eligible?
- —
Personal DTI + credit; lowest rate.
DSCR
20% down · 8.5% · 30yr
- Down + closing
- —
- Monthly P&I
- —
- Monthly cashflow
- —
- DSCR
- —
- Eligible?
- —
No personal income docs; deal must DSCR.
Hard money
10% down · 12.0% · 12mo
- Down + closing
- —
- Monthly P&I
- —
- Monthly cashflow
- —
- DSCR
- —
- Eligible?
- —
Short-term bridge; refi at stabilization.
Rent comps 23 comps
| Address | Beds | Baths | Sqft | Rent | $/sqft | DOM | Units | Dist |
|---|---|---|---|---|---|---|---|---|
| 2244 Hadleigh Hills Ct Navarre, FL | 3.0 | 2.5 | 1664 | $1,995 | $1.20 | 23d | 1 | 0.06mi |
| 2170 Tom St Navarre, FL | 3.0 | 2.0 | 1400 | $1,750 | $1.25 | 23d | 1 | 0.15mi |
| 2189 Jeannie St Navarre, FL | 2.0 | 2.0 | 1000 | $1,650 | $1.65 | 23d | 1 | 0.20mi |
| 2281 Tom St Navarre, FL | 3.0 | 2.0 | 1604 | $2,295 | $1.43 | 23d | 1 | 0.20mi |
| 2107 Nina St Navarre, FL | 3.0 | 2.0 | 1738 | $2,400 | $1.38 | 14d | 1 | 0.25mi |
| 2127 Tom St Unit 2127 Navarre, FL | 3.0 | 2.5 | 1400 | $1,750 | $1.25 | 23d | 1 | 0.26mi |
| 2123 Tom St Navarre, FL | 3.0 | 2.0 | 1400 | $1,900 | $1.36 | 23d | 1 | 0.27mi |
| 2164 Wind Trace Rd N Navarre, FL | 3.0 | 2.0 | 1463 | $2,040 | $1.39 | 14d | 1 | 0.43mi |
| 2164 Wind Trace Rd N Navarre, FL | 3.0 | 2.0 | 1463 | $2,040 | $1.39 | 23d | 1 | 0.43mi |
| 2154 Whispering Pines Blvd Unit 3 Navarre, FL | 2.0 | 2.0 | 1100 | $1,600 | $1.45 | 23d | 1 | 0.46mi |
| 2154 Whispering Pines Blvd Unit 3 Navarre, FL | 2.0 | 2.0 | 1100 | $1,600 | $1.45 | 14d | 1 | 0.46mi |
| 2040 Falconhurst Pl Unit 2040 Navarre, FL | 3.0 | 2.0 | 990 | $2,800 | $2.83 | 23d | 1 | 0.46mi |
| 9946 Mariposa St Navarre, FL | 3.0 | 2.0 | 1706 | $2,770 | $1.62 | 14d | 1 | 0.47mi |
| 9946 Mariposa St Navarre, FL | 3.0 | 2.0 | 1706 | $2,770 | $1.62 | 23d | 1 | 0.47mi |
| 2109 Bellemeade Cir Navarre, FL | 3.0 | 2.0 | 1658 | $1,900 | $1.15 | 23d | 1 | 0.47mi |
| 2109 Bellemeade Cir Navarre, FL | 3.0 | 2.0 | 1658 | $1,900 | $1.15 | 14d | 1 | 0.47mi |
| 9523 Parker Place Dr Navarre, FL | 3.0 | 2.0 | 1700 | $1,850 | $1.09 | 23d | 1 | 0.63mi |
| 2212 Peachwood Ct Navarre, FL | 3.0 | 2.0 | 1750 | $2,200 | $1.26 | 23d | 1 | 0.64mi |
| 2225 Prytania Cir Navarre, FL | 3.0 | 2.0 | 1529 | $2,150 | $1.41 | 23d | 1 | 1.03mi |
| 2225 Prytania Cir Navarre, FL | 3.0 | 2.0 | 1529 | $2,150 | $1.41 | 14d | 1 | 1.03mi |
| 114 Ridgewood Ave Mary Esther, FL | 3.0 | 2.0 | 1120 | $1,870 | $1.67 | 43d | 1 | 1.31mi |
| 311 Evergreen Dr Mary Esther, FL | 3.0 | 2.0 | 1284 | $1,895 | $1.48 | 21d | 1 | 1.40mi |
| 306 Evergreen Dr Mary Esther, FL | 4.0 | 2.0 | 1741 | $2,250 | $1.29 | 43d | 1 | 1.42mi |
Listing history 3 events
-
2026-02-15status Pending
-
2026-01-24$64,002 Active
-
1986-03-01soldstatus $16,000
ⓘ Source: listings_history table (triggers on properties + properties_extension) + one-shot
backfill from property_details.listing_events for pre-trigger history.
Tax reassessment forecast FL · Resets to sale price
- Current annual tax
- $1,282 · $107/mo
- Projected year-2 tax
- $1,282 · $107/mo
- Expected delta
- $0/yr ($0/mo · 0.0%)
ⓘ Screening estimate from a state-policy table — verify with the county assessor before closing.
Climate risk First Street
- Flood 1/10 Low FEMA zone X (unshaded) · 0% chance over 30 yrs
- Wildfire 5/10 Major
- Heat 10/10 Extreme 7 d/yr ≥104°F today · 23 d/yr by 30 yrs out
- Wind 9/10 Extreme 99% chance of damaging wind over 30 yrs
- Air quality 2/10 Low 1 unhealthy d/yr today · 2 by 30 yrs out
Nearby sold comps map
Loading sold comps map…
Walkable amenities ~0.75 mi
Loading nearby amenities…
Taxation est. · year 1
- Rental income
- $25,747
- − Mortgage interest
- −$3,585
- − Property taxes
- −$1,282
- − Insurance
- −$320
- − Repairs & maintenance
- −$2,060
- − Management
- −$2,060
- − Depreciation
- −$1,862
- Taxable income
- $14,578
- Est. tax owed @ 24.0%
- −$3,499
- After-tax cash flow
- $11,212/yr
For passive investors: Depreciation is non-cash, so a rental often shows a tax loss while cash-flowing — sheltering income. Rental losses are passive: they offset passive income freely, and up to $25,000/yr can offset ordinary (W-2) income if you actively participate and your MAGI is under $100k (phasing out to $0 by $150k); unused losses carry forward. On sale, claimed depreciation is recaptured at up to 25%, and gains may owe capital-gains tax (a 1031 exchange can defer both). Figures are a year-1 estimate at your 24.0% rate — not tax advice; consult a CPA.
Schools (NCES district)
- District
- Santa Rosa
- NCES district ID
- 1201650
- Math proficiency
- 63% ▼ -6.00%
- Reading proficiency
- 60% ▼ -5.00%
- Median HH income
- $58,161
- Composite
- 53.12/100
- National rank
- #1511
- State rank
- #8 of 73 in FL
Livability — Navarre
- Score
- 70/100
- State rank
- #435
- US rank
- #7790
Category grades
Schools grade is shown separately in the Schools card above.
Census & demographics
- Census place
- Navarre, FL
- County
- Santa Rosa County · 194,764 people
- City population
- 43,883
- Metro
- Pensacola-Ferry Pass-Brent, FL
- Population (ZIP)
- 43,883
- Household income
- $105,551
- Rent vs Own
- Severe rent burden
- 608.0
Population outlook (Santa Rosa County) Hauer SSP2
- Today (2025)
- 195,978 people
- By 2030
- 209,782 · +7.0%
- By 2040
- 235,293 · +20.1%
- By 2050
- 256,408 · +30.8%
- By 2075
- 298,074 · +52.1%
- By 2100
- 303,216 · +54.7%
Race, ethnicity, and origin ACS 2023
- Neighborhood character
- Predominantly White (75%)
- Race & ethnicity
- White 75% Two or more races 9% Hispanic / Latino 9% Black 6% Asian 3%
- Hispanic origin (detail)
- Mexican 3% Puerto Rican 2%
- Common ancestry
- Scotch-Irish 3% Lithuanian 3% Romanian 2%
- Foreign-born
- 6% · Canada, Jamaica, Vietnam
- Languages at home
- 92% English-only · Spanish 4% German/W. Germanic 1% Tagalog/Filipino 1%
Political lean MEDSL · Santa Rosa
- 2024 margin
- Solid R (+51.0) · D 24.1% · R 75.0%
- 2008→2024 swing
- -3.0pp toward R · 2008: -47.9pp · 2024: -51.0pp
- All cycles
- 2024: R+51.0 2020: R+46.5 2016: R+53.5 2012: R+52.6 2008: R+47.9
Not yet ingested
- Civics
- —
Market trends
- HPI YoY
- ▼ -105.87%
- Current HPI
- 298.6821
- Rent YoY
- ▲ 2.74%
- Metro
- Pensacola-Ferry Pass-Brent, FL
- State GDP YoY
- ▲ 3.28%
- F500 in state
- 36
Industry mix (Fortune 500 HQ in FL)
| Industry | F500 HQs | Revenue |
|---|---|---|
| Industrial Technology | 2 | $29B |
|
||
| Insurance | 2 | $17B |
|
||
| Retail | 1 | $60B |
|
||
| Technology Distribution | 1 | $58B |
|
||
| Homebuilding | 1 | $35B |
|
||
| Technology Manufacturing | 1 | $35B |
|
||
Price history
+300.0% since first listed3 events — show timeline
- 2026-02-15 Pending — PARMLS
- 2026-01-24 Listed $64,002 PARMLS
- 1986-03-01 Sold (Public Records) $16,000 Public Records
Property tax history
+31.5%/yrLatest (2025): $1,282 · +7.4% YoY. Source: county tax records.
Cash-flow waterfall
monthlySold comps — $/sqft
last 12 mo · ≤1 miLoading sold comps…