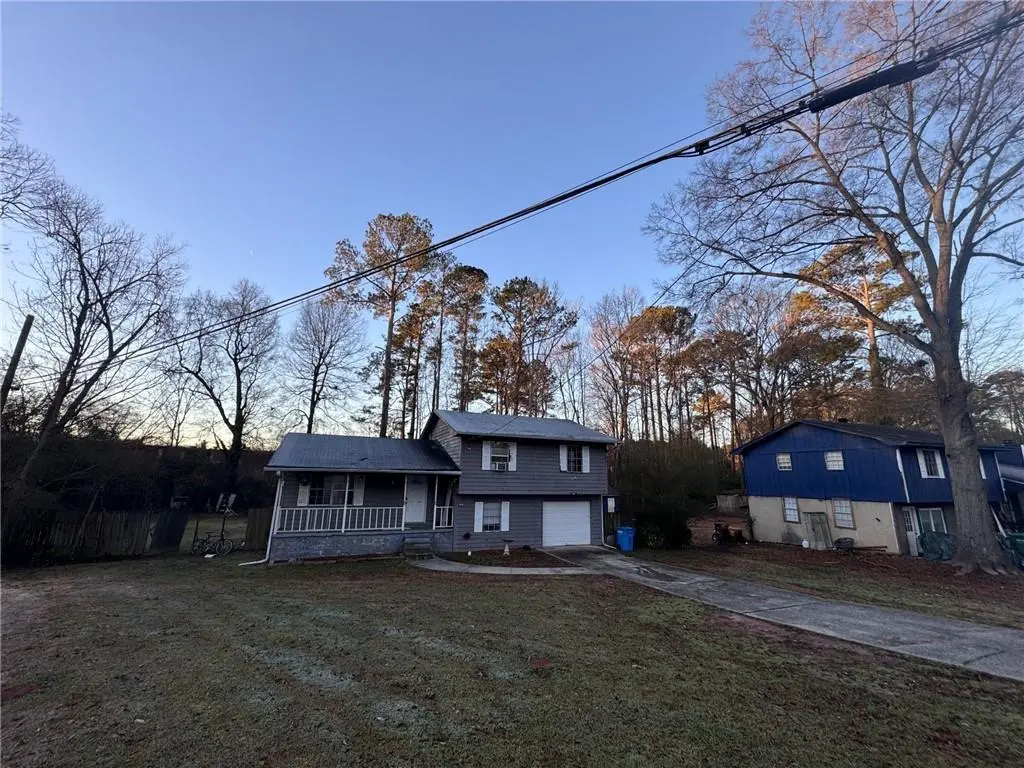
55 Porter Cir · Hampton, GA
Flood risk 7/10 · Major
- FEMA flood zone
- X (unshaded)
- Chance of flooding over 30 yrs
- 0.99%
- Est. flood insurance / yr
- $507 – $1,088
Fire risk 3/10 · Minor
- Est. fire insurance / yr
- $963 – $1,789
Heat risk 6/10 · Moderate
- Hot days now (above 105°F)
- 7 days/yr
- Hot days in 30 yrs
- 18 days/yr
Wind risk 6/10 · Moderate
- Chance of severe wind over 30 yrs
- 27.0%
Air-quality risk 4/10 · Minor
- Unhealthy air days now
- 4 days/yr
- Unhealthy air days in 30 yrs
- 5 days/yr
Risk factors via First Street. Map © Google.
Why this score? — see what drove the C+ grade
The composite is a weighted blend of 9 inputs, each scored 0–100. Each bar is that input's sub-score; the figure is the points it added to the 100-point composite (weight × sub-score).
- Cash flow +22.1/30.0
- ARV discount +15.0/15.0
- DSCR +7.1/10.0
- 1% rule +6.0/10.0
- Livability +3.2/5.0
- Rent growth +3.1/5.0
- Schools +2.6/10.0
- Condition / age +2.5/5.0
- Appreciation +0.0/10.0
$182,900
🖨 Deal sheet 📄 Offer letter ✓ Due diligence
Listing remarks
Spacious 5 Bedroom, 3 Bath Home Offering Room to Grow! This home features a large family room, eat-in kitchen, and generously sized bedrooms, including a comfortable owner’s suite. With flexible living spaces, there’s plenty of room for a private home office, guest suite, media room, or playroom. Step outside to the back deck overlooking a fenced backyard—perfect for relaxing or entertaining. Conveniently located close to dining, parks, and everyday amenities.
Key facts
- Large family room
- Eat-in kitchen
- Back deck
Tags
Property features AI
Exterior
- Parking: One garage space; Garage parking; On-street parking; Parking pad; Open parking available
- Utilities: Public water; Public sewer; Electric service available; Natural gas available; Cable available; Phone service available
- Home design: Multi/split levels
- Construction: Wood siding construction; Composition roof; Property is a resale
- Exterior features: Front porch; Deck; Wood fencing enclosing backyard; Fenced yard; Outbuilding on property
Interior
- Kitchen: Dishwasher; Electric cooktop; Electric oven; Microwave; Refrigerator; Kitchen features: Other
- Bedrooms: Three bedrooms on upper level; Two bedrooms on lower level; Bedroom features: Other
- Flooring: Flooring: Other
- Bathrooms: Three full bathrooms (two on upper level, one on lower level); Master bathroom features: Other
- Heating & cooling: Central heating; Forced air heating; Window cooling units
- Interior features: Entrance foyer; High-speed internet available; Disappearing attic stairs; Partial basement
- Laundry & utility: Laundry located in basement; Electric water heater
Neighborhood map
What this means for you Summary
Snapshot
- This is a 3-bed/3.0-bath single-family listed at $183k.
Deal economics
- At list price, monthly cash flow is $229 ($3k/yr) — positive.
- The deal already cash-flows at list — no discount required.
- Meets the 1% rule at list price ($2k rent vs $183k).
- Recommended offer: $180k (1.5% below list) — sets the bar for market timing.
- Cap rate 8.2% vs local median 4.5% in Hampton — top-decile yield for the area; either an underpriced asset or a hidden risk that comps aren't pricing in. Stress-test before assuming the spread holds.
Location & tenants
- Location reads 65/100 on livability (#213 in GA) — a middle-class / working-renter tenant base. Strengths: cost of living A+, housing A+, crime A-; Watch: schools F, amenities F, commute F.
- Henry County (rural): math 24% / reading 33% proficiency, ranked #89 of 174 in GA (top 51%) — low school quality limits family demand, transient renter base, plan for 1-2y turnover.
- Market conditions: Rents rising (+2.2%/yr); 547 active listings in the ZIP; 13 comparable units currently listed for rent nearby; rentals at typical pace (median 21d on market — plan ~3-4 weeks tenant-placement turnaround); solid renter incomes; 1,989 units permitted in Henry County in 2024 (92 in 5+ unit buildings).
Forward outlook
- Local home prices are declining (-3.0%/yr); year-one equity from $1k of loan paydown is wiped out by about $5k of value loss. Plan a longer hold.
- Henry County population projected at +29% by 2050 — long-run rental-demand tailwind backs the buy-and-hold thesis.
Negotiation context
- It's been on market 25 days — a 2% lower offer ($180k) is reasonable based on typical stale-listing flexibility.
- 7 sale attempts since 19y ago with the ask held roughly flat each time — persistent listings suggest the price (not the market) is what's stuck; bring a comps-based counter.
Risks & watch-outs
- Watch-outs: flood insurance adds $66/mo.
- Climate carrying-cost: major flood risk; major wind risk, 27% chance of damaging wind over 30y; extreme-heat days projected 7→18/yr by 2055 (HVAC capex compounding) — expect insurance premiums to compound above CPI over the hold.
Questions for the listing agent
- Built in 1974 — when were the roof, HVAC, electrical panel, plumbing, and water heater last replaced?
- What's the actual annual flood-insurance premium (NFIP or private), and is the property in a SFHA with mandatory coverage?
- Is there a deadline driving the sale (1031 exchange, divorce, estate, relocation)? That informs how much negotiation room exists.
- Schools are F-rated, which usually means shorter tenancies and higher turnover. Who's the typical renter profile here, and what's been the actual vacancy rate?
- What's the average days-on-market for RENTAL listings here right now (not sales)? A rising rental-DOM trend means longer vacancies and softer asking-rent achievability than the comps imply.
- What's the recent tenant-quality profile in this submarket — average credit score on applications, eviction rate, late-payment / NSF rate, and stable-employment percentage? A property-management company in the area should have these aggregated.
- How much new for-sale + rental construction is in the pipeline within 1–3 miles? Heavy new supply typically softens prices + rents 12–24 months out; constrained supply supports both.
Investment metrics
- 1% rule
- 1.10% ✓
- Cap rate
- 8.23%
- Cash-on-cash
- 6.93%
- DSCR
- 1.31
- GRM
- 7.6
CMA / ARV
- ARV (median comp)
- $268,127
- List price
- $182,900
- Delta
- -31.79%
- Verdict
- UNDERPRICED
- Comps
- 20 within 1.0 mi
Show comp detail 12 sales within ~0.75 mi
| Address | Dist | Beds/Ba | Sqft | Sold | Price | $/sf | Match |
|---|---|---|---|---|---|---|---|
| 2012 Elm Grove Ln | 0.32mi | 3/2.0 | 1,589 (-1%) | 4mo | $256,000 | $161 | 76 |
| 25 Georgia Ave | 0.42mi | 3/2.0 | 1,518 (-5%) | 1mo | $195,000 | $128 | 67 |
| 15 Porter Cir | 0.07mi | 3/2.0 | 1,796 (+12%) | 11mo | $246,500 | $137 | 64 |
| 1902 Elm Park Dr | 0.45mi | 3/2.5 | 1,668 (+4%) | 11mo | $269,900 | $162 | 61 |
| 2 Cindy Ct | 0.67mi | 3/2.0 | 1,568 (-2%) | 2mo | $258,000 | $165 | 60 |
| 1904 Elm Park Dr | 0.44mi | 3/2.5 | 1,420 (-11%) | 5mo | $225,000 | $158 | 55 |
| 25 Mcdonough St | 0.66mi | 3/2.0 | 1,507 (-6%) | 7mo | $289,000 | $192 | 50 |
| 16 Jeriana Dr | 0.66mi | 4/2.0 (+1) | 1,681 (+5%) | 8mo | $195,000 | $116 | 45 |
| 19 Mcdonough St | 0.61mi | 3/2.0 | 1,806 (+13%) | 4mo | $209,900 | $116 | 43 |
| 6 Derrick St | 0.65mi | 3/2.0 | 1,389 (-13%) | 1mo | $108,000 | $78 | 43 |
| 106 June Ct | 0.50mi | 3/2.0 | 1,398 (-13%) | 11mo | $270,000 | $193 | 42 |
| 5 Jeriana Dr | 0.70mi | 4/2.0 (+1) | 1,718 (+7%) | 7mo | $270,000 | $157 | 40 |
Match score weights: distance 35% · size 25% · config 20% · recency 20%. Top-matched comps best support the ARV.
Projected returns pro-forma
-3.0% appreciation · 2.2% rent growth · sell at horizon
- IRR
- -8.9%
- Equity multiple
- 0.68×
- Total profit
- $-16,551
- Equity at exit
- $27,271
- IRR
- -0.5%
- Equity multiple
- 0.97×
- Total profit
- $-1,729
- Equity at exit
- $15,814
Cash invested: $51,212 (down + closing). Projections, not guarantees.
Landlord ↔ Tenant lean methodology
- Overall (STATE)
- 90 Strongly Landlord-Friendly
- State Georgia
- 90 Strongly Landlord-Friendly · R+3
- County
- — inherits STATE
- City
- — inherits STATE
ZIP-level market 30228
- Home prices YoY
- -24.3%
- Rents YoY
- 2.2%
- Active inventory
- 547
- Price-to-rent
- 7.6×
Monthly cashflow live
- Estimated rent
- $2,008 high interval (Pro) →
- Mortgage (P&I)
- −$959
- Tax from tax record
- −$255 /mo · $3,062/yr
- Insurance
- −$76
- Flood insurance flood zone
- −$66 /mo · $798/yr
- HOA
- −$0
- Vacancy / Maint / Mgmt
- −$422
- Net cashflow
- $229
Break-even live
UW: 25.0% down · 7.5% · 30yr · 1.5% tax · 5.0% vac · 8.0% maint · 8.0% mgmt
Financing live
Cash to close
- Down payment
- $45,725
- Closing costs
- $5,487
- Reserves months
- —
- Total cash needed
- —
Loan-product check · same deal, 3 products live
Conventional
25% down · 7.5% · 30yr
- Down + closing
- —
- Monthly P&I
- —
- Monthly cashflow
- —
- DSCR
- —
- Eligible?
- —
Personal DTI + credit; lowest rate.
DSCR
20% down · 8.5% · 30yr
- Down + closing
- —
- Monthly P&I
- —
- Monthly cashflow
- —
- DSCR
- —
- Eligible?
- —
No personal income docs; deal must DSCR.
Hard money
10% down · 12.0% · 12mo
- Down + closing
- —
- Monthly P&I
- —
- Monthly cashflow
- —
- DSCR
- —
- Eligible?
- —
Short-term bridge; refi at stabilization.
Rent comps 13 comps
| Address | Beds | Baths | Sqft | Rent | $/sqft | DOM | Units | Dist |
|---|---|---|---|---|---|---|---|---|
| 9 W Main St Hampton, GA | 3.0 | 2.0 | 1560 | $1,713 | $1.10 | 24d | 1 | 0.33mi |
| 1905 Elm Park Dr Hampton, GA | 3.0 | 2.5 | 1739 | $1,905 | $1.10 | 1d | 1 | 0.43mi |
| 20 Windpher Rdg Hampton, GA | 3.0 | 2.0 | 1694 | $2,090 | $1.23 | 43d | 1 | 0.83mi |
| 104 Dana Dr Hampton, GA | 3.0 | 2.0 | 1460 | $1,945 | $1.33 | 5d | 1 | 0.90mi |
| 1299 N Hampton Dr Hampton, GA | 3.0 | 2.0 | 1232 | $1,790 | $1.45 | 5d | 1 | 0.96mi |
| 925 Revere Way Hampton, GA | 4.0 | 2.5 | 2159 | $1,995 | $0.92 | 24d | 1 | 0.99mi |
| 1323 N Hampton Dr Hampton, GA | 3.0 | 2.0 | 1208 | $1,794 | $1.49 | 43d | 1 | 1.00mi |
| 1514 N Hampton Ct Hampton, GA | 3.0 | 2.0 | 1208 | $1,700 | $1.41 | 12d | 1 | 1.01mi |
| 1330 N Hampton Dr Hampton, GA | 3.0 | 2.0 | 1228 | $1,685 | $1.37 | 12d | 1 | 1.01mi |
| 637 Lynchburg St Hampton, GA | 4.0 | 2.5 | 1867 | $2,100 | $1.12 | 24d | 1 | 1.08mi |
| 2074 Boatswain Dr Hampton, GA | 3.0 | 2.5 | 1490 | $1,965 | $1.32 | 20d | 1 | 1.13mi |
| 100 Cottage Way Hampton, GA | 2.0–3.0 | 2.0–3.0 | 1243 | $2,439 | $1.96 | 1d | 19 | 1.20mi |
| 816 Marcus Ln Hampton, GA | 3.0 | 2.5 | 2084 | $1,889 | $0.91 | 43d | 1 | 1.27mi |
Listing history 34 events
-
2026-06-09days on market $182,900 Active 25 DOM
-
2026-06-08days on market $182,900 Active 24 DOM
-
2026-06-07days on market $182,900 Active 23 DOM
-
2026-06-04days on market $182,900 Active 20 DOM
-
2026-06-03days on market $182,900 Active 19 DOM
-
2026-06-02days on market $182,900 Active 18 DOM
-
2026-06-01days on market $182,900 Active 17 DOM
-
2026-05-31days on market $182,900 Active 16 DOM
-
2026-05-15$182,900 Active 482-char remark
-
2026-05-14$182,900 New 464-char remark
-
2026-05-02historical
-
2026-05-01price $185,900
-
2026-04-14price $189,900
-
2026-02-27price $192,900
-
2026-02-01$197,900 New
-
2025-09-02soldstatus $160,000
-
2025-08-26soldstatus $160,000 Sold
-
2025-08-01status Under Contract
-
2025-07-30status Back On Market
-
2025-07-29status Under Contract
-
2025-07-22status Price Change
-
2025-07-22price $199,000
-
2025-07-14status Under Contract
-
2025-06-30$215,000 New
-
2024-08-28historical
-
2024-06-08price $192,999
-
2024-04-18$200,000 New
-
2020-04-07soldstatus $62,600
-
2007-04-06soldstatus $75,184
-
2007-03-05$74,900
-
2003-12-22soldstatus $104,000
-
2000-08-17soldstatus $75,000
-
1994-06-01soldstatus $64,000
-
1974-09-01soldstatus $32,700
ⓘ Source: listings_history table (triggers on properties + properties_extension) + one-shot
backfill from property_details.listing_events for pre-trigger history.
Tax reassessment forecast GA · Resets to sale price
- Current annual tax
- $3,062 · $255/mo
- Projected year-2 tax
- $3,062 · $255/mo
- Expected delta
- $0/yr ($0/mo · 0.0%)
ⓘ Screening estimate from a state-policy table — verify with the county assessor before closing.
Climate risk First Street
- Flood 7/10 Severe FEMA zone X (unshaded) · 99% chance over 30 yrs
- Wildfire 3/10 Moderate
- Heat 6/10 Major 7 d/yr ≥105°F today · 18 d/yr by 30 yrs out
- Wind 6/10 Major 27% chance of damaging wind over 30 yrs
- Air quality 4/10 Moderate 4 unhealthy d/yr today · 5 by 30 yrs out
Nearby sold comps map
Loading sold comps map…
Walkable amenities ~0.75 mi
Loading nearby amenities…
Taxation est. · year 1
- Rental income
- $24,095
- − Mortgage interest
- −$10,245
- − Property taxes
- −$3,062
- − Insurance
- −$1,712
- − Repairs & maintenance
- −$1,928
- − Management
- −$1,928
- − Depreciation
- −$5,321
- Taxable loss
- −$100
- Est. tax savings @ 24.0%
- +$24
- After-tax cash flow
- $2,775/yr
For passive investors: Depreciation is non-cash, so a rental often shows a tax loss while cash-flowing — sheltering income. Rental losses are passive: they offset passive income freely, and up to $25,000/yr can offset ordinary (W-2) income if you actively participate and your MAGI is under $100k (phasing out to $0 by $150k); unused losses carry forward. On sale, claimed depreciation is recaptured at up to 25%, and gains may owe capital-gains tax (a 1031 exchange can defer both). Figures are a year-1 estimate at your 24.0% rate — not tax advice; consult a CPA.
Schools (NCES district)
- District
- Henry County
- NCES district ID
- 1302820
- Math proficiency
- 24% ▼ -9.00%
- Reading proficiency
- 33% ▼ -7.00%
- Median HH income
- $62,594
- Composite
- 26.13/100
- National rank
- #7279
- State rank
- #89 of 174 in GA
Livability — Hampton
- Score
- 65/100
- State rank
- #213
- US rank
- #12664
Category grades
Schools grade is shown separately in the Schools card above.
Census & demographics
- Census place
- Hampton, GA
- County
- Henry County · 316,359 people
- City population
- 52,402
- Metro
- Atlanta-Sandy Springs-Alpharetta, GA
- Population (ZIP)
- 52,402
- Household income
- $82,619
- Rent vs Own
- Severe rent burden
- 1285.0
Population outlook (Henry County) Hauer SSP2
- Today (2025)
- 249,041 people
- By 2030
- 264,369 · +6.2%
- By 2040
- 294,459 · +18.2%
- By 2050
- 322,249 · +29.4%
- By 2075
- 392,310 · +57.5%
- By 2100
- 437,836 · +75.8%
Race, ethnicity, and origin ACS 2023
- Neighborhood character
- Majority Black (63%)
- Race & ethnicity
- Black 63% White 23% Hispanic / Latino 8% Two or more races 6% Asian 2%
- Hispanic origin (detail)
- Mexican 5% Puerto Rican 1%
- Common ancestry
- Hispanic 4% Lithuanian 1% Italian 1%
- Foreign-born
- 9% · Canada, Vietnam, Jamaica
- Languages at home
- 89% English-only · Spanish 6% French/Haitian/Cajun 2% Vietnamese 1%
Political lean MEDSL · Henry
- 2024 margin
- Strong D (+29.7) · D 64.5% · R 34.9%
- 2008→2024 swing
- +37.1pp toward D · 2008: -7.5pp · 2024: 29.7pp
- All cycles
- 2024: D+29.7 2020: D+20.5 2016: D+4.3 2012: R+3.2 2008: R+7.5
Not yet ingested
- Civics
- —
Market trends
- HPI YoY
- ▼ -71.11%
- Current HPI
- 222.0357
- Rent YoY
- ▲ 2.20%
- Metro
- Atlanta-Sandy Springs-Alpharetta, GA
- State GDP YoY
- ▲ 2.66%
- F500 in state
- 28
Industry mix (Fortune 500 HQ in GA)
| Industry | F500 HQs | Revenue |
|---|---|---|
| Paper / Packaging | 2 | $29B |
|
||
| Retail | 1 | $160B |
|
||
| Transportation / Logistics | 1 | $91B |
|
||
| Airlines | 1 | $62B |
|
||
| Consumer Goods | 1 | $47B |
|
||
| Utilities | 1 | $25B |
|
||
Price history
+459.3% since first listed26 events — show timeline
- 2026-06-09 Listing Removed — GAMLS
- 2026-05-14 Listed $182,900 GAMLS
- 2026-05-02 Listing Removed — GAMLS
- 2026-05-01 Price Changed $185,900 GAMLS
- 2026-04-14 Price Changed $189,900 GAMLS
- 2026-02-27 Price Changed $192,900 GAMLS
- 2026-02-01 Listed $197,900 GAMLS
- 2025-09-02 Sold (Public Records) $160,000 Public Records
- 2025-08-26 Sold (MLS) $160,000 GAMLS
- 2025-08-01 Pending — GAMLS
- 2025-07-30 Relisted — GAMLS
- 2025-07-29 Pending — GAMLS
- 2025-07-22 Relisted — GAMLS
- 2025-07-22 Price Changed $199,000 GAMLS
- 2025-07-14 Pending — GAMLS
- 2025-06-30 Listed $215,000 GAMLS
- 2024-08-28 Listing Removed — GAMLS
- 2024-06-08 Price Changed $192,999 GAMLS
- 2024-04-18 Listed $200,000 GAMLS
- 2020-04-07 Sold (Public Records) $62,600 Public Records
- 2007-04-06 Sold (MLS) $75,184 FMLS
- 2007-03-05 Listed $74,900 FMLS
- 2003-12-22 Sold (Public Records) $104,000 Public Records
- 2000-08-17 Sold (Public Records) $75,000 Public Records
- 1994-06-01 Sold (Public Records) $64,000 Public Records
- 1974-09-01 Sold (Public Records) $32,700 Public Records
Property tax history
+5.1%/yrLatest (2025): $3,062 · +2.9% YoY. Source: county tax records.
Cash-flow waterfall
monthlySold comps — $/sqft
last 12 mo · ≤1 miLoading sold comps…