 🏷️ Likely Rental
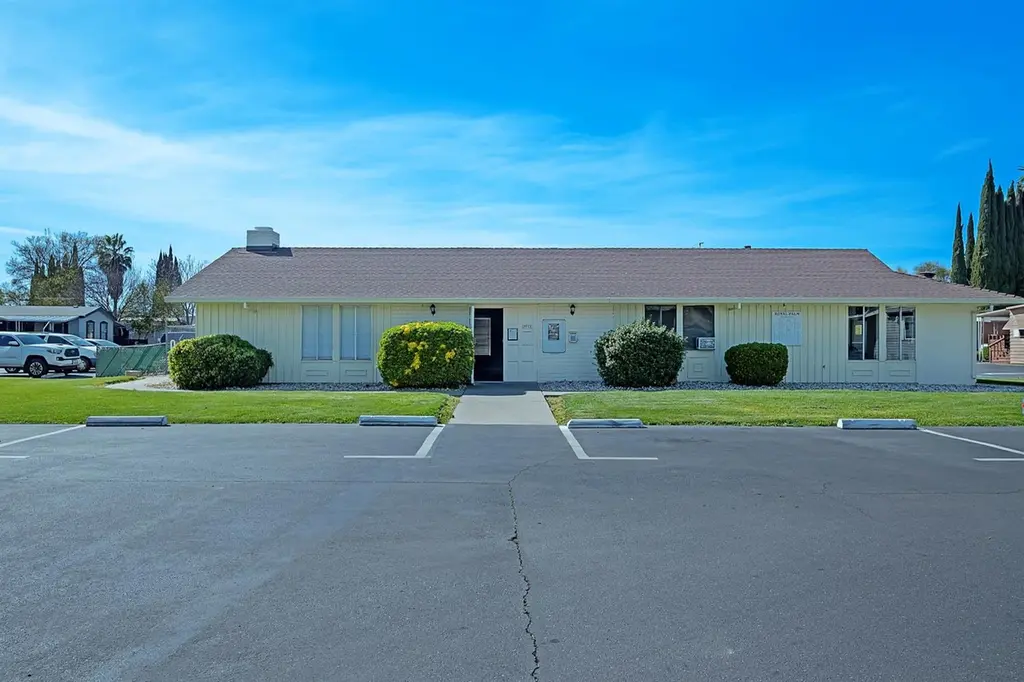
840 Bourn Dr #7 · Woodland, CA
Flood risk 9/10 · Severe
- FEMA flood zone
- X (unshaded)
- Chance of flooding over 30 yrs
- 0.99%
- Est. flood insurance / yr
- $507 – $1,088
Fire risk 4/10 · Minor
- Est. fire insurance / yr
- $659 – $1,223
Heat risk 7/10 · Major
- Hot days now (above 104°F)
- 7 days/yr
- Hot days in 30 yrs
- 14 days/yr
Wind risk 1/10 · Minimal
- Chance of severe wind over 30 yrs
- —
Air-quality risk 10/10 · Severe
- Unhealthy air days now
- 28 days/yr
- Unhealthy air days in 30 yrs
- 29 days/yr
Risk factors via First Street. Map © Google.
Why this score? — see what drove the D+ grade
The composite is a weighted blend of 9 inputs, each scored 0–100. Each bar is that input's sub-score; the figure is the points it added to the 100-point composite (weight × sub-score).
- Cash flow +15.0/30.0
- ARV discount +7.5/15.0
- 1% rule +5.0/10.0
- DSCR +5.0/10.0
- Schools +4.0/10.0
- Rent growth +3.9/5.0
- Livability +3.4/5.0
- Condition / age +2.5/5.0
- Appreciation +0.0/10.0
$40,000
🖨 Deal sheet (PDF) 📄 Offer letter ✓ Due diligence
Listing remarks
840 Bourn Dr. , Space 7 Royal Palm Mobile Home Park Woodland, CA 95776 Investor or owner-occupant opportunity in the established Royal Palm Mobile Home Park. This double-wide is being sold as-is and is priced to reflect its current condition ideal for a buyer looking to remove and replace with a newer manufactured home. Done right, this path can deliver an updated residence at a fraction of the cost of purchasing a move-in-ready space within the park. Community amenities include a pool and on-site management. Space rent is $580/mo and to be verified by buyer. Bring your contractor and your vision.
Key facts
- Community amenities
- Pool
- On-site management
Tags
Neighborhood map
What this means for you Summary
Snapshot
- This is a 2-bed/2.0-bath manufactured listed at $40k.
Deal economics
- At list price, monthly cash flow is $2k ($19k/yr) — positive.
- The deal already cash-flows at list — no discount required.
- Meets the 1% rule at list price ($2k rent vs $40k).
- Recommended offer: $39k (1.5% below list) — sets the bar for market timing.
- Cap rate 56.1% vs local median 3.4% in Woodland — top-decile yield for the area; either an underpriced asset or a hidden risk that comps aren't pricing in. Stress-test before assuming the spread holds.
Location & tenants
- Location reads 67/100 on livability (#314 in CA) — a middle-class / working-renter tenant base. Strengths: employment A, housing A; Watch: amenities C-, cost of living F.
- Woodland Joint Unified (suburban): math 34% / reading 58% proficiency, ranked #171 of 517 in CA (top 33%) — families likely to look elsewhere, expect single-tenant / working-renter base with shorter leases.
- Zoned schools: Ramon S. Tafoya Elementary (784 students, 76% FRL); Douglass Middle (808 students, 76% FRL); Pioneer High (math 40% / reading 62%, grade D+, #319 of 1,170 statewide, top 28%, 1,635 students, 71% FRL) — zoned schools average 74% FRL vs 54% district-wide (20 pts higher); higher-poverty schools than district average — tighter screening recommended.
- Market conditions: Rents rising fast (+5.4%/yr); 99 active listings in the ZIP; 8 comparable units currently listed for rent nearby; rentals leasing fast (median 6d on market — plan ~1-2 weeks tenant-placement turnaround); solid renter incomes; 721 units permitted in Yolo County in 2024 (260 in 5+ unit buildings).
Forward outlook
- Local home prices are declining (-3.0%/yr); year-one equity from $277 of loan paydown is wiped out by about $1k of value loss. Plan a longer hold.
- Yolo County population projected at +31% by 2050 — long-run rental-demand tailwind backs the buy-and-hold thesis.
- At projected returns (-3.0% appreciation + 5.4% rent growth), your $11k cash investment doubles in ~1 year — after that, you're playing with house money.
Negotiation context
- It's been on market 17 days — a 2% lower offer ($39k) is reasonable based on typical stale-listing flexibility.
Risks & watch-outs
- Watch-outs: flood insurance adds $66/mo.
- Climate carrying-cost: severe flood risk; extreme-heat days projected 7→14/yr by 2055 (HVAC capex compounding) — expect insurance premiums to compound above CPI over the hold.
Questions for the listing agent
- Built in 1965 — when were the roof, HVAC, electrical panel, plumbing, and water heater last replaced?
- What's the actual annual flood-insurance premium (NFIP or private), and is the property in a SFHA with mandatory coverage?
- Is there a deadline driving the sale (1031 exchange, divorce, estate, relocation)? That informs how much negotiation room exists.
- Schools are F-rated, which usually means shorter tenancies and higher turnover. Who's the typical renter profile here, and what's been the actual vacancy rate?
- The area grade is low — what's the realistic commute time and amenity access for the typical tenant pool here? Any planned neighborhood developments (good or bad) we should know about?
- What's the average days-on-market for RENTAL listings here right now (not sales)? A rising rental-DOM trend means longer vacancies and softer asking-rent achievability than the comps imply.
- What's the recent tenant-quality profile in this submarket — average credit score on applications, eviction rate, late-payment / NSF rate, and stable-employment percentage? A property-management company in the area should have these aggregated.
- How much new for-sale + rental construction is in the pipeline within 1–3 miles? Heavy new supply typically softens prices + rents 12–24 months out; constrained supply supports both.
Investment metrics
- 1% rule
- 6.13% ✓
- Cap rate
- 56.11%
- Cash-on-cash
- 177.92%
- DSCR
- 8.92
- GRM
- 1.4
CMA / ARV
- ARV (median comp)
- $128,077
- List price
- $40,000
- Delta
- -68.77%
- Verdict
- UNDERPRICED
- Comps
- 5 within 1.0 mi
Show comp detail 2 sales within ~0.75 mi
| Address | Dist | Beds/Ba | Sqft | Sold | Price | $/sf | Match |
|---|---|---|---|---|---|---|---|
| 840 Bourn Dr #7 | 0.00mi | 2/2.0 | 1,000 (0%) | 0mo | $54,000 | $54 | 100 |
| 840 Bourn Dr | 0.00mi | 3/2.0 (+1) | 1,080 (+8%) | 14mo | $199,000 | $184 | 70 |
Match score weights: distance 35% · size 25% · config 20% · recency 20%. Top-matched comps best support the ARV.
Projected returns pro-forma
-3.0% appreciation · 5.4% rent growth · sell at horizon
- IRR
- —
- Equity multiple
- 10.03×
- Total profit
- $101,189
- Equity at exit
- $5,964
- IRR
- —
- Equity multiple
- 22.90×
- Total profit
- $245,298
- Equity at exit
- $3,458
Cash invested: $11,200 (down + closing). Projections, not guarantees.
Landlord ↔ Tenant lean methodology
- Overall (STATE)
- 18 Strongly Tenant-Friendly
- State California
- 18 Strongly Tenant-Friendly · D+13
- County
- — inherits STATE
- City
- — inherits STATE
ZIP-level market 95776
- Home prices YoY
- -30.2%
- Rents YoY
- 5.4%
- Active inventory
- 99
- Price-to-rent
- 1.4×
Monthly cashflow live
- Estimated rent
- $2,452 high interval (Pro) →
- Mortgage (P&I)
- −$210
- Tax est. 1.5%
- −$50 /mo · $600/yr
- Insurance
- −$17
- Flood insurance flood zone
- −$66 /mo · $798/yr
- HOA
- −$0
- Vacancy / Maint / Mgmt
- −$515
- Net cashflow
- $1,594
Break-even live
Sensitivity live
| Price | -10% $1,622 | -5% $1,608 | +0% $1,594 | +5% $1,580 | +10% $1,566 |
|---|---|---|---|---|---|
| Rent | -10% $1,400 | -5% $1,497 | +0% $1,594 | +5% $1,691 | +10% $1,788 |
| Rate | -1.0pp $1,614 | -0.5pp $1,604 | base $1,594 | +0.5pp $1,584 | +1.0pp $1,573 |
UW: 25.0% down · 7.5% · 30yr · 1.5% tax · 5.0% vac · 8.0% maint · 8.0% mgmt
Financing live
Cash to close
- Down payment
- $10,000
- Closing costs
- $1,200
- Reserves months
- —
- Total cash needed
- —
Loan-product check · same deal, 3 products live
Conventional
25% down · 7.5% · 30yr
- Down + closing
- —
- Monthly P&I
- —
- Monthly cashflow
- —
- DSCR
- —
- Eligible?
- —
Personal DTI + credit; lowest rate.
DSCR
20% down · 8.5% · 30yr
- Down + closing
- —
- Monthly P&I
- —
- Monthly cashflow
- —
- DSCR
- —
- Eligible?
- —
No personal income docs; deal must DSCR.
Hard money
10% down · 12.0% · 12mo
- Down + closing
- —
- Monthly P&I
- —
- Monthly cashflow
- —
- DSCR
- —
- Eligible?
- —
Short-term bridge; refi at stabilization.
Rent comps 8 comps
| Address | Beds | Baths | Sqft | Rent | $/sqft | DOM | Units | Dist |
|---|---|---|---|---|---|---|---|---|
| 1080 Barnes Cir Woodland, CA | 3.0 | 2.0 | 1242 | $2,700 | $2.17 | 6d | 1 | 0.47mi |
| 575 Matmor Rd Woodland, CA | 1.0–2.0 | 1.0–2.0 | 840 | $2,151 | $2.56 | 0d | 6 | 0.51mi |
| 1180 Matmor Rd Woodland, CA | 2.0 | 1.0–2.0 | 893 | $1,850 | $2.07 | 4d | 3 | 0.55mi |
| 1455 Hoover Ct Woodland, CA | 3.0 | 2.0 | 1100 | $2,700 | $2.45 | 19d | 1 | 0.65mi |
| 547 Johnston St Woodland, CA | 2.0 | 1.0 | 750 | $1,950 | $2.60 | 25d | 1 | 0.79mi |
| 1975 Maxwell Ave Woodland, CA | 1.0–2.0 | 1.0–2.0 | 924 | $2,322 | $2.51 | 0d | 6 | 1.03mi |
| 1737 6th St Woodland, CA | 1.0–2.0 | 1.0 | 675 | $2,034 | $3.01 | 5d | 8 | 1.26mi |
| 135 3rd St Woodland, CA | 1.0 | 1.0 | 726 | $1,600 | $2.20 | 13d | 1 | 1.43mi |
Climate risk First Street
- Flood 9/10 Extreme FEMA zone X (unshaded) · 99% chance over 30 yrs
- Wildfire 4/10 Moderate
- Heat 7/10 Severe 7 d/yr ≥104°F today · 14 d/yr by 30 yrs out
- Wind 1/10 Low
- Air quality 10/10 Extreme 28 unhealthy d/yr today · 29 by 30 yrs out
Nearby sold comps map
Loading sold comps map…
Walkable amenities ~0.75 mi
Loading nearby amenities…
Taxation est. · year 1
- Rental income
- $29,423
- − Mortgage interest
- −$2,241
- − Property taxes
- −$600
- − Insurance
- −$998
- − Repairs & maintenance
- −$2,354
- − Management
- −$2,354
- − Depreciation
- −$1,164
- Taxable income
- $19,713
- Est. tax owed @ 24.0%
- −$4,731
- After-tax cash flow
- $14,398/yr
For passive investors: Depreciation is non-cash, so a rental often shows a tax loss while cash-flowing — sheltering income. Rental losses are passive: they offset passive income freely, and up to $25,000/yr can offset ordinary (W-2) income if you actively participate and your MAGI is under $100k (phasing out to $0 by $150k); unused losses carry forward. On sale, claimed depreciation is recaptured at up to 25%, and gains may owe capital-gains tax (a 1031 exchange can defer both). Figures are a year-1 estimate at your 24.0% rate — not tax advice; consult a CPA.
Schools (NCES district)
- District
- Woodland Joint Unified
- NCES district ID
- 0643080
- Math proficiency
- 34% ▲ 6.00%
- Reading proficiency
- 58% ▲ 15.00%
- Median HH income
- $57,556
- Composite
- 40.1/100
- National rank
- #3803
- State rank
- #171 of 517 in CA
Livability — Woodland
- Score
- 67/100
- State rank
- #314
- US rank
- #10682
Category grades
Schools grade is shown separately in the Schools card above.
Census & demographics
- Census place
- Woodland, CA
- County
- Yolo County · 212,115 people
- City population
- 66,420
- Metro
- Sacramento-Roseville-Folsom, CA
- Population (ZIP)
- 28,718
- Household income
- $106,698
- Rent vs Own
- Severe rent burden
- 654.0
Population outlook (Yolo County) Hauer SSP2
- Today (2025)
- 242,183 people
- By 2030
- 257,662 · +6.4%
- By 2040
- 288,050 · +18.9%
- By 2050
- 318,202 · +31.4%
- By 2075
- 392,736 · +62.2%
- By 2100
- 438,150 · +80.9%
Race, ethnicity, and origin ACS 2023
- Neighborhood character
- Diverse neighborhood (Simpson 0.67)
- Race & ethnicity
- Hispanic / Latino 46% White 32% Two or more races 20% Asian 13% Black 2%
- Hispanic origin (detail)
- Mexican 43%
- Common ancestry
- Italian 3% Scotch-Irish 2% Lithuanian 1%
- Foreign-born
- 25% · Canada, China, South Korea
- Languages at home
- 57% English-only · Spanish 31% Other Indo-European 7% Chinese 2%
Political lean MEDSL · Yolo
- 2024 margin
- Solid D (+36.2) · D 66.3% · R 30.1% · Other 3.6%
- 2008→2024 swing
- 0.0pp no change · 2008: 36.2pp · 2024: 36.2pp
- All cycles
- 2024: D+36.2 2020: D+41.4 2016: D+42.0 2012: D+33.2 2008: D+36.2
Not yet ingested
- Civics
- —
Market trends
- HPI YoY
- ▼ -119.41%
- Current HPI
- 276.202
- Rent YoY
- ▲ 5.40%
- Metro
- Sacramento-Roseville-Folsom, CA
- State GDP YoY
- ▲ 3.21%
- F500 in state
- 116
Industry mix (Fortune 500 HQ in CA)
| Industry | F500 HQs | Revenue |
|---|---|---|
| Technology | 27 | $1,492B |
|
||
| Financial Services | 3 | $174B |
|
||
| Retail | 3 | $44B |
|
||
| Insurance | 3 | $26B |
|
||
| Media / Entertainment | 2 | $115B |
|
||
| Pharmaceuticals / Biotech | 2 | $62B |
|
||
Cash-flow waterfall
monthlySold comps — $/sqft
last 12 mo · ≤1 miLoading sold comps…