7945 Eastdale Rd · Dundalk, MD
Flood risk 1/10 · Minimal
- FEMA flood zone
- X (unshaded)
- Chance of flooding over 30 yrs
- 0.0%
- Est. flood insurance / yr
- $507 – $1,088
Fire risk 1/10 · Minimal
- Est. fire insurance / yr
- $755 – $1,403
Heat risk 8/10 · Major
- Hot days now (above 103°F)
- 7 days/yr
- Hot days in 30 yrs
- 15 days/yr
Wind risk 6/10 · Moderate
- Chance of severe wind over 30 yrs
- 27.0%
Air-quality risk 5/10 · Moderate
- Unhealthy air days now
- 6 days/yr
- Unhealthy air days in 30 yrs
- 8 days/yr
Risk factors via First Street. Map © Google.
Why this score? — see what drove the D grade
The composite is a weighted blend of 9 inputs, each scored 0–100. Each bar is that input's sub-score; the figure is the points it added to the 100-point composite (weight × sub-score).
- Cash flow +18.7/30.0
- DSCR +5.9/10.0
- 1% rule +4.6/10.0
- Livability +4.2/5.0
- Rent growth +2.8/5.0
- Condition / age +2.5/5.0
- Schools +2.3/10.0
- ARV discount +0.0/15.0
- Appreciation +0.0/10.0
$205,000
🖨 Deal sheet 📄 Offer letter ✓ Due diligence
Listing remarks
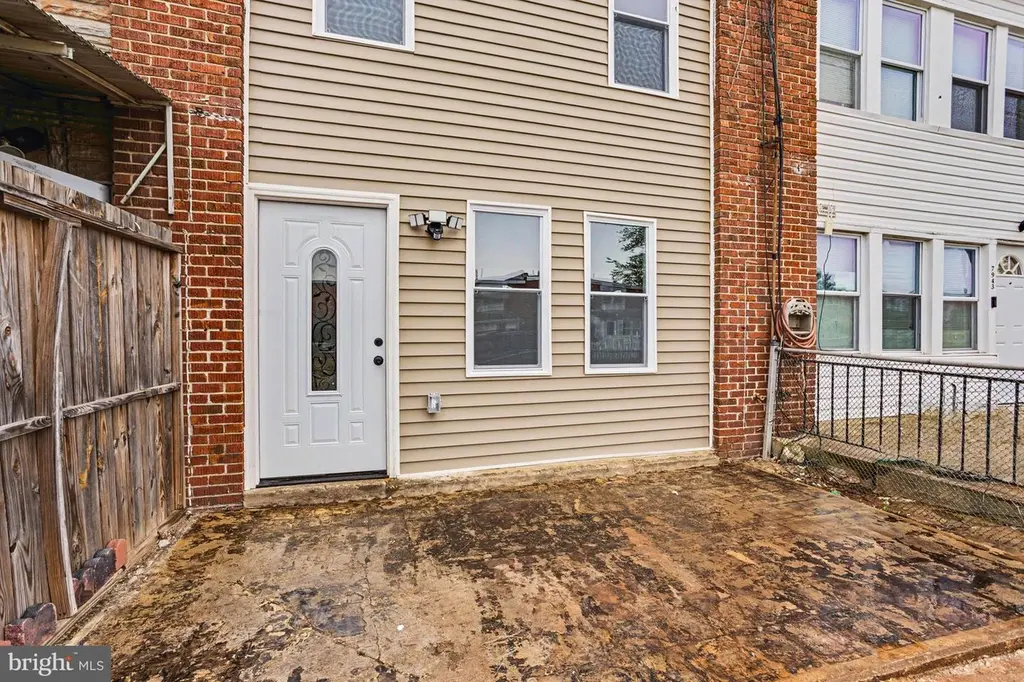
Welcome to 7945 Eastdale — a beautifully renovated 3-bedroom, 1.5-bath home where modern updates and thoughtful design come together seamlessly. Completely transformed from top to bottom, this move-in ready property offers peace of mind with all-new electrical, plumbing, HVAC, and energy-efficient windows. The stunning new kitchen features stylish finishes, brand-new appliances, and plenty of space for cooking and entertaining. A newly added main-level half bath adds convenience and functionality for guests and everyday living. Throughout the home, you’ll find fresh finishes and updated systems that blend comfort, style, and efficiency. Whether you’re a first-time buyer or
Key facts
- Built 1956
- Listed 37 days
Property features AI
Finance
- Other: Above-grade finished area reported by assessor
- Financial info: Ground rent amount $87 (semi-annual); Ownership interest: Ground Rent
Exterior
- Parking: On-street parking
- Utilities: Public water; Public sewer; Natural gas service
- Home design: Interior townhouse/rowhouse; Brick construction
- Construction: Estimated year built; Block foundation
- Exterior features: Ground rent exists (paid semi-annually)
Interior
- Bedrooms: Three bedrooms on the upper level
- Bathrooms: One full bathroom (upper level); One half bathroom on the main level
- Heating & cooling: Forced air heating; Central air conditioning (electric); Natural gas hot water
- Interior features: No basement; Living area reported by assessor
Neighborhood map
What this means for you Summary
Snapshot
- This is a 3-bed/1.0-bath townhouse listed at $205k.
Deal economics
- At list price, monthly cash flow is $201 ($2k/yr) — positive.
- The deal already cash-flows at list — no discount required.
- To meet the 1% rule (rent ≥ 1% of price), the offer needs to be $198k (3.5% below list).
- Recommended offer: $198k (3.5% below list) — sets the bar for 1% rule.
- Cap rate 7.5% vs local median 6.2% in Dundalk — meaningfully above typical; check what's discounted (condition, days-on-market, listing class) to confirm the premium yield is real.
Location & tenants
- Location reads 85/100 on livability (#16 in MD, #510 nationally) — a professional / high-income tenant draw. Strengths: amenities A+, commute A+, housing A+; Watch: crime F.
- Baltimore County Public Schools (suburban): math 15% / reading 34% proficiency, ranked #11 of 24 in MD (top 46%) — low school quality limits family demand, transient renter base, plan for 1-2y turnover.
- Market conditions: Rents rising (+1.3%/yr); 391 active listings in the ZIP; 34 comparable units currently listed for rent nearby; rentals at typical pace (median 24d on market — plan ~3-4 weeks tenant-placement turnaround); solid renter incomes; 1,511 units permitted in Baltimore County in 2024 (643 in 5+ unit buildings).
Forward outlook
- Local home prices are declining (-3.0%/yr); year-one equity from $1k of loan paydown is wiped out by about $6k of value loss. Plan a longer hold.
- Baltimore County population projected at +12% by 2050 — modest demand growth; plan on rents tracking national, not racing it.
Negotiation context
- It's been on market 37 days — a 3% lower offer ($199k) is reasonable based on typical stale-listing flexibility.
- 2 sale attempts since 24y ago with the ask held roughly flat each time — persistent listings suggest the price (not the market) is what's stuck; bring a comps-based counter.
- Current owner paid $124k; list at $205k implies a 65% gain — meaningful room to come down on a strong offer.
Risks & watch-outs
- Watch-outs: built in 1956 — expect roof / HVAC / electrical / plumbing capex.
- Climate carrying-cost: major wind risk, 27% chance of damaging wind over 30y; extreme-heat days projected 7→15/yr by 2055 (HVAC capex compounding) — expect insurance premiums to compound above CPI over the hold.
Questions for the listing agent
- It's been on market 37 days. Have you received any prior offers? Is the seller open to a 4% concession, seller financing, or rate buy-down credit?
- Built in 1956 — when were the roof, HVAC, electrical panel, plumbing, and water heater last replaced?
- Is there a deadline driving the sale (1031 exchange, divorce, estate, relocation)? That informs how much negotiation room exists.
- Schools are A-rated — typically a magnet for longer-tenancy family renters. What's the average tenant stay here, and is there a school-zone premium baked into asking?
- Crime grade is F in this area — have there been break-ins, vandalism, or insurance claims at this property in the last 3 years? What carrier currently insures it and at what premium?
- The area grade is low — what's the realistic commute time and amenity access for the typical tenant pool here? Any planned neighborhood developments (good or bad) we should know about?
- What's the average days-on-market for RENTAL listings here right now (not sales)? A rising rental-DOM trend means longer vacancies and softer asking-rent achievability than the comps imply.
- What's the recent tenant-quality profile in this submarket — average credit score on applications, eviction rate, late-payment / NSF rate, and stable-employment percentage? A property-management company in the area should have these aggregated.
- How much new for-sale + rental construction is in the pipeline within 1–3 miles? Heavy new supply typically softens prices + rents 12–24 months out; constrained supply supports both.
Investment metrics
- 1% rule
- 0.96% ✗
- Cap rate
- 7.47%
- Cash-on-cash
- 4.21%
- DSCR
- 1.19
- GRM
- 8.6
CMA / ARV
- ARV (median comp)
- $172,616
- List price
- $205,000
- Delta
- 18.76%
- Verdict
- OVERPRICED
- Comps
- 20 within 1.0 mi
Show comp detail 12 sales within ~0.75 mi
| Address | Dist | Beds/Ba | Sqft | Sold | Price | $/sf | Match |
|---|---|---|---|---|---|---|---|
| 8048 Eastdale Rd | 0.13mi | 3/1.0 | 1,024 (0%) | 1mo | $135,000 | $132 | 93 |
| 7944 Lansdale Rd | 0.13mi | 3/1.0 | 1,024 (0%) | 4mo | $137,200 | $134 | 90 |
| 7911 Bank St | 0.22mi | 3/1.0 | 1,080 (+6%) | 5mo | $140,000 | $130 | 76 |
| 7901 Wynbrook Rd | 0.09mi | 3/1.5 | 1,080 (+6%) | 10mo | $215,000 | $199 | 76 |
| 7820 Wynbrook Rd | 0.17mi | 3/2.0 | 896 (-12%) | 3mo | $151,200 | $169 | 65 |
| 8022 Lansdale Rd | 0.16mi | 2/2.0 (-1) | 1,120 (+9%) | 9mo | $189,000 | $169 | 60 |
| 7304 Stratton Way | 0.55mi | 3/1.5 | 1,080 (+6%) | 5mo | $215,000 | $199 | 59 |
| 7806 Eastdale Rd | 0.20mi | 2/1.0 (-1) | 896 (-12%) | 10mo | $165,000 | $184 | 57 |
| 7279 Gough St | 0.61mi | 2/1.5 (-1) | 996 (-3%) | 4mo | $137,800 | $138 | 57 |
| 7169 Eastbrook Ave | 0.63mi | 3/2.0 | 996 (-3%) | 7mo | $230,000 | $231 | 56 |
| 7756 Wynbrook Rd | 0.23mi | 2/1.0 (-1) | 1,171 (+14%) | 9mo | $169,900 | $145 | 53 |
| 7230 Conley St | 0.70mi | 3/1.5 | 1,144 (+12%) | 7mo | $180,000 | $157 | 40 |
Match score weights: distance 35% · size 25% · config 20% · recency 20%. Top-matched comps best support the ARV.
Projected returns pro-forma
-3.0% appreciation · 1.31% rent growth · sell at horizon
- IRR
- -11.6%
- Equity multiple
- 0.59×
- Total profit
- $-23,706
- Equity at exit
- $30,566
- IRR
- -5.0%
- Equity multiple
- 0.70×
- Total profit
- $-17,266
- Equity at exit
- $17,725
Cash invested: $57,400 (down + closing). Projections, not guarantees.
Landlord ↔ Tenant lean methodology
- Overall (STATE)
- 27 Tenant-Leaning
- State Maryland
- 27 Tenant-Leaning · D+14
- County
- — inherits STATE
- City
- — inherits STATE
ZIP-level market 21224
- Rents YoY
- 1.3%
- Active inventory
- 391
- Price-to-rent
- 8.6×
Monthly cashflow live
- Estimated rent
- $1,978 high interval (Pro) →
- Mortgage (P&I)
- −$1,075
- Tax from tax record
- −$201 /mo · $2,407/yr
- Insurance
- −$85
- HOA
- −$0
- Vacancy / Maint / Mgmt
- −$415
- Net cashflow
- $201
Break-even live
UW: 25.0% down · 7.5% · 30yr · 1.5% tax · 5.0% vac · 8.0% maint · 8.0% mgmt
Financing live
Cash to close
- Down payment
- $51,250
- Closing costs
- $6,150
- Reserves months
- —
- Total cash needed
- —
Loan-product check · same deal, 3 products live
Conventional
25% down · 7.5% · 30yr
- Down + closing
- —
- Monthly P&I
- —
- Monthly cashflow
- —
- DSCR
- —
- Eligible?
- —
Personal DTI + credit; lowest rate.
DSCR
20% down · 8.5% · 30yr
- Down + closing
- —
- Monthly P&I
- —
- Monthly cashflow
- —
- DSCR
- —
- Eligible?
- —
No personal income docs; deal must DSCR.
Hard money
10% down · 12.0% · 12mo
- Down + closing
- —
- Monthly P&I
- —
- Monthly cashflow
- —
- DSCR
- —
- Eligible?
- —
Short-term bridge; refi at stabilization.
Rent comps 34 comps
| Address | Beds | Baths | Sqft | Rent | $/sqft | DOM | Units | Dist |
|---|---|---|---|---|---|---|---|---|
| 7948 Eastdale Rd Baltimore, MD | 3.0 | 1.0 | 1024 | $1,700 | $1.66 | 43d | 1 | 0.05mi |
| 7915 Eastdale Rd Baltimore, MD | 2.0 | 1.0 | 896 | $1,500 | $1.67 | 43d | 1 | 0.06mi |
| 7951 E Baltimore St Baltimore, MD | 3.0 | 1.0 | 1024 | $1,750 | $1.71 | 2d | 1 | 0.07mi |
| 8036 Lansdale Rd Unit 1 Baltimore, MD | 3.0 | 1.0 | 1024 | $1,775 | $1.73 | 5d | 1 | 0.13mi |
| 7911 Bank St Baltimore, MD | 3.0 | 1.0 | 1080 | $1,749 | $1.62 | 43d | 1 | 0.20mi |
| 309 52nd St Unit A Baltimore, MD | 2.0 | 1.0 | 722 | $1,350 | $1.87 | 23d | 1 | 0.21mi |
| 7716 Wynbrook Rd Baltimore, MD | 2.0 | 1.0 | 1232 | $1,800 | $1.46 | 43d | 1 | 0.31mi |
| 505 Northpoint Rd Baltimore, MD | 3.0 | 2.0 | 1300 | $2,195 | $1.69 | 11d | 1 | 0.44mi |
| 608 Northpoint Rd Baltimore, MD | 3.0 | 1.5 | 1148 | $1,895 | $1.65 | 23d | 1 | 0.47mi |
| 7325 Conley St Baltimore, MD | 3.0 | 2.0 | 1290 | $1,950 | $1.51 | 17d | 1 | 0.57mi |
| 7319 Conley St Baltimore, MD | 3.0 | 2.0 | 1080 | $1,950 | $1.81 | 17d | 1 | 0.58mi |
| 7517 Belmont Ave Baltimore, MD | 2.0 | 1.0 | 720 | $1,800 | $2.50 | 17d | 1 | 0.60mi |
| 901 Elton Ave Baltimore, MD | 4.0 | 2.0 | 1056 | $2,800 | $2.65 | 43d | 1 | 0.62mi |
| 7261 Bridgewood Dr Baltimore, MD | 3.0 | 2.0 | 896 | $2,495 | $2.78 | 23d | 1 | 0.63mi |
| 932 Elton Ave Baltimore, MD | 3.0 | 2.0 | 1024 | $1,950 | $1.90 | 17d | 1 | 0.68mi |
| 7230 Conley St Unit 1 Baltimore, MD | 3.0 | 1.5 | 1144 | $2,100 | $1.84 | 23d | 1 | 0.70mi |
| 7230 Conley St Unit 1 Baltimore, MD | 3.0 | 1.5 | 1144 | $2,100 | $1.84 | 3d | 1 | 0.70mi |
| 7136 Eastbrook Ave Baltimore, MD | 4.0 | 2.0 | 996 | $2,200 | $2.21 | 5d | 1 | 0.71mi |
| 944 Dalton Ave Baltimore, MD | 3.0 | 2.0 | 1024 | $2,100 | $2.05 | 10d | 1 | 0.71mi |
| 7219 Conley St Baltimore, MD | 4.0 | 1.5 | 1440 | $1,950 | $1.35 | 14d | 1 | 0.72mi |
| 7058 Eastbrook Ave Baltimore, MD | 3.0 | 2.0 | 1228 | $1,700 | $1.38 | 11d | 1 | 0.80mi |
| 7124 Gough St Baltimore, MD | 2.0 | 1.5 | 1096 | $1,700 | $1.55 | 21d | 1 | 0.86mi |
| 7444 Berkshire Rd Baltimore, MD | 3.0 | 1.5 | 1228 | $1,850 | $1.51 | 5d | 1 | 0.89mi |
| 530 47th St Baltimore, MD | 3.0 | 1.0 | 1424 | $1,750 | $1.23 | 23d | 1 | 1.04mi |
| 7520 Durwood Rd Dundalk, MD | 3.0 | 1.0 | 1110 | $2,100 | $1.89 | 43d | 1 | 1.04mi |
| 6905 Bank St Baltimore, MD | 2.0 | 1.5 | 784 | $1,650 | $2.10 | 43d | 1 | 1.08mi |
| 6802 Conley St Baltimore, MD | 2.0 | 1.5 | 939 | $1,750 | $1.86 | 21d | 1 | 1.08mi |
| 7484 Rabon Ave Dundalk, MD | 3.0 | 1.5 | 1499 | $2,000 | $1.33 | 43d | 1 | 1.11mi |
| 849 Loalan Ave Dundalk, MD | 3.0 | 1.5 | 1024 | $1,850 | $1.81 | 14d | 1 | 1.20mi |
| 630 47th St Unit B Baltimore, MD | 2.0 | 1.0 | 750 | $1,200 | $1.60 | 43d | 1 | 1.22mi |
| 628 47th St Apt RW2 Baltimore, MD | 2.0 | 1.0 | 750 | $1,200 | $1.60 | 10d | 1 | 1.22mi |
| 334 Kane St Baltimore, MD | 2.0 | 2.0 | 1050 | $1,675 | $1.60 | 23d | 1 | 1.39mi |
| 340 Potomac Ave Rosedale, MD | 2.0 | 2.5 | 1500 | $1,995 | $1.33 | 43d | 1 | 1.39mi |
| 6710 Hudson St Baltimore, MD | 4.0 | 4.0 | 1156 | $3,500 | $3.03 | 23d | 1 | 1.44mi |
Listing history 19 events
-
2026-06-18days on market $205,000 Active 37 DOM
-
2026-06-17days on market $205,000 Active 36 DOM
-
2026-06-16days on market $205,000 Active 35 DOM
-
2026-06-15days on market $205,000 Active 34 DOM
-
2026-06-13days on market $205,000 Active 32 DOM
-
2026-06-09days on market $205,000 Active 28 DOM
-
2026-06-08days on market $205,000 Active 27 DOM
-
2026-06-07pricedays on market $205,000 Active 26 DOM
-
2026-06-04days on market $210,000 Active 23 DOM
-
2026-06-03days on market $210,000 Active 22 DOM
-
2026-06-02days on market $210,000 Active 21 DOM
-
2026-06-01days on market $210,000 Active 20 DOM
-
2026-05-31days on market $210,000 Active 19 DOM
-
2026-05-13$210,000 Active 896-char remark
-
2026-05-12historical $210,000 896-char remark
-
2025-05-28soldstatus $124,000
-
2003-03-27soldstatus $44,000
-
2003-01-27historical
-
2002-11-25$48,000
ⓘ Source: listings_history table (triggers on properties + properties_extension) + one-shot
backfill from property_details.listing_events for pre-trigger history.
Tax reassessment forecast MD · Partial reset (capped growth)
- Current annual tax
- $2,407 · $201/mo
- Projected year-2 tax
- $2,407 · $201/mo
- Expected delta
- $0/yr ($0/mo · 0.0%)
ⓘ Screening estimate from a state-policy table — verify with the county assessor before closing.
Climate risk First Street
- Flood 1/10 Low FEMA zone X (unshaded) · 0% chance over 30 yrs
- Wildfire 1/10 Low
- Heat 8/10 Severe 7 d/yr ≥103°F today · 15 d/yr by 30 yrs out
- Wind 6/10 Major 27% chance of damaging wind over 30 yrs
- Air quality 5/10 Major 6 unhealthy d/yr today · 8 by 30 yrs out
Nearby sold comps map
Loading sold comps map…
Walkable amenities ~0.75 mi
Loading nearby amenities…
Taxation est. · year 1
- Rental income
- $23,733
- − Mortgage interest
- −$11,483
- − Property taxes
- −$2,407
- − Insurance
- −$1,025
- − Repairs & maintenance
- −$1,899
- − Management
- −$1,899
- − Depreciation
- −$5,964
- Taxable loss
- −$943
- Est. tax savings @ 24.0%
- +$226
- After-tax cash flow
- $2,643/yr
For passive investors: Depreciation is non-cash, so a rental often shows a tax loss while cash-flowing — sheltering income. Rental losses are passive: they offset passive income freely, and up to $25,000/yr can offset ordinary (W-2) income if you actively participate and your MAGI is under $100k (phasing out to $0 by $150k); unused losses carry forward. On sale, claimed depreciation is recaptured at up to 25%, and gains may owe capital-gains tax (a 1031 exchange can defer both). Figures are a year-1 estimate at your 24.0% rate — not tax advice; consult a CPA.
Schools (NCES district)
- District
- Baltimore County Public Schools
- NCES district ID
- 2400120
- Math proficiency
- 15% ▼ -16.00%
- Reading proficiency
- 34% ▼ -5.00%
- Median HH income
- $66,746
- Composite
- 23.17/100
- National rank
- #7948
- State rank
- #11 of 24 in MD
Livability — Dundalk
- Score
- 85/100
- State rank
- #16
- US rank
- #510
Category grades
Schools grade is shown separately in the Schools card above.
Census & demographics
- Census place
- Dundalk, MD
- County
- Baltimore City · 558,601 people
- City population
- 588,727
- Metro
- Baltimore-Columbia-Towson, MD
- Population (ZIP)
- 47,465
- Household income
- $89,017
- Rent vs Own
- Severe rent burden
- 1786.0
Population outlook (Baltimore County) Hauer SSP2
- Today (2025)
- 885,518 people
- By 2030
- 909,272 · +2.7%
- By 2040
- 951,547 · +7.5%
- By 2050
- 990,955 · +11.9%
- By 2075
- 1,086,411 · +22.7%
- By 2100
- 1,135,078 · +28.2%
Race, ethnicity, and origin ACS 2023
- Neighborhood character
- Diverse neighborhood (Simpson 0.62)
- Race & ethnicity
- White 55% Hispanic / Latino 21% Black 16% Two or more races 7% Asian 4%
- Hispanic origin (detail)
- Mexican 4% Puerto Rican 2% Dominican 1%
- Common ancestry
- Romanian 5% Lithuanian 2% Italian 1%
- Foreign-born
- 17% · Canada, China, Vietnam
- Languages at home
- 76% English-only · Spanish 18% Other Indo-European 2% Russian/Polish/Slavic 1%
Political lean MEDSL · Baltimore
- 2024 margin
- Strong D (+24.5) · D 61.0% · R 36.5% · Other 2.5%
- 2008→2024 swing
- +9.9pp toward D · 2008: 14.6pp · 2024: 24.5pp
- All cycles
- 2024: D+24.5 2020: D+27.0 2016: D+17.4 2012: D+16.4 2008: D+14.6
Not yet ingested
- Civics
- —
Market trends
- HPI YoY
- ▼ -332.23%
- Current HPI
- 241.284
- Rent YoY
- ▲ 1.31%
- Metro
- Baltimore-Columbia-Towson, MD
- State GDP YoY
- ▲ 2.97%
- F500 in state
- 12
Industry mix (Fortune 500 HQ in MD)
| Industry | F500 HQs | Revenue |
|---|---|---|
| Aerospace / Defense | 1 | $71B |
|
||
| Utilities | 1 | $25B |
|
||
| Hotels | 1 | $24B |
|
||
| Consumer Goods | 1 | $7B |
|
||
| Real Estate | 1 | $6B |
|
||
| Chemicals | 1 | $2B |
|
||
Price history
+327.1% since first listed7 events — show timeline
- 2026-06-07 Price Changed $205,000 BRIGHT MLS
- 2026-05-13 Listed $210,000 BRIGHT MLS
- 2026-05-12 Coming Soon $210,000 BRIGHT MLS
- 2025-05-28 Sold (Public Records) $124,000 Public Records
- 2003-03-27 Sold (MLS) $44,000 MRIS
- 2003-01-27 Delisted — MRIS
- 2002-11-25 Listed $48,000 MRIS
Property tax history
+2.4%/yrLatest (2025): $2,407 · +13.2% YoY. Source: county tax records.
Cash-flow waterfall
monthlySold comps — $/sqft
last 12 mo · ≤1 miLoading sold comps…