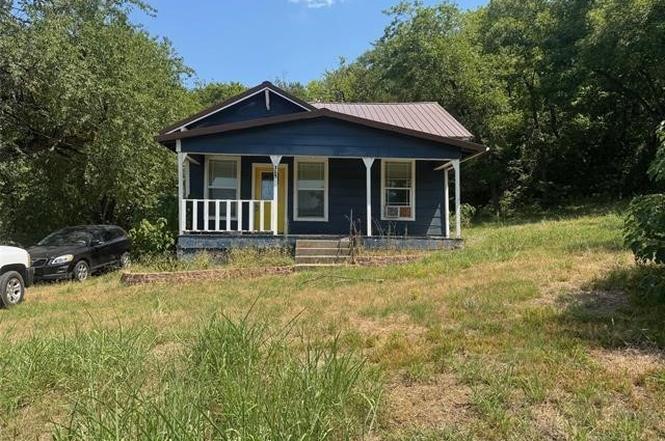
345 E Cumberland Ave · Stringtown, OK
Flood risk 1/10 · Minimal
- FEMA flood zone
- X
- Chance of flooding over 30 yrs
- 0.0%
- Est. flood insurance / yr
- $507 – $1,088
Fire risk 7/10 · Major
- Est. fire insurance / yr
- $2,463 – $4,575
Heat risk 6/10 · Moderate
- Hot days now (above 112°F)
- 7 days/yr
- Hot days in 30 yrs
- 20 days/yr
Wind risk 4/10 · Minor
- Chance of severe wind over 30 yrs
- 10.0%
Air-quality risk 2/10 · Minimal
- Unhealthy air days now
- 0 days/yr
- Unhealthy air days in 30 yrs
- 1 days/yr
Risk factors via First Street. Map © Google.
Why this score? — see what drove the B- grade
The composite is a weighted blend of 9 inputs, each scored 0–100. Each bar is that input's sub-score; the figure is the points it added to the 100-point composite (weight × sub-score).
- Cash flow +30.0/30.0
- 1% rule +10.0/10.0
- DSCR +10.0/10.0
- Appreciation +5.7/10.0
- Livability +3.1/5.0
- Rent growth +2.5/5.0
- Condition / age +2.5/5.0
- Schools +2.4/10.0
- ARV discount +1.7/15.0
$54,900
🖨 Deal sheet 📄 Offer letter ✓ Due diligence
Listing remarks
This cozy 2-bedroom, 1-bathroom home blends small-town charm with modern updates. Set in a friendly community near the local school, this property offers the convenience of in-town living while being just a short drive from a larger city filled with shopping, dining, and entertainment. The home itself has been refreshed inside, giving it a clean, comfortable feel, while still leaving some spaces unfinished—perfect for adding your own personal touch. Mature shade trees and edible and useful greenery make the yard as functional as it is inviting. Located in a picturesque area of rolling hills and low mountains, this home is also close to a beautiful lake, offering endless opportunities
Key facts
- Beautiful lake
- Outdoor recreation
- Modern updates
Tags
Property features AI
Exterior
- Parking: Concrete driveway
- Security: No safety shelter
- Utilities: Electricity available; Natural gas available; Public water; Public sewer
- Home design: Single-story home; Faces southwest; Crawlspace foundation; Entry level: first floor
- Construction: Wood frame construction; Asphalt/fiberglass roof; Built per public records
- Exterior features: Covered porch; Concrete driveway; Mature trees
Interior
- Kitchen: Dishwasher; Disposal; Oven; Range / Stove; Refrigerator
- Bedrooms: Master bedroom (first floor); Additional bedroom (first floor)
- Flooring: Laminate flooring; Vinyl flooring
- Bathrooms: Hall full bathroom with bathtub (first floor)
- Heating & cooling: Gas heating with multiple heating units; Window cooling units (three or more); Has cooling
- Interior features: High ceilings; Wood countertops; Ceiling fan(s); Gas range/oven connection; Vinyl windows
- Laundry & utility: Washer hookup; Electric dryer hookup; Interior utility room (first floor)
Neighborhood map
What this means for you Summary
Snapshot
- This is a 2-bed/1.0-bath single-family listed at $55k.
Deal economics
- At list price, monthly cash flow is $305 ($4k/yr) — positive.
- The deal already cash-flows at list — no discount required.
- Meets the 1% rule at list price ($867 rent vs $55k).
- Recommended offer: $50k (9.0% below list) — sets the bar for market timing.
Location & tenants
- Location reads 62/100 on livability (#252 in OK) — a middle-class / working-renter tenant base. Strengths: cost of living A+, crime A, housing A; Watch: employment D+, schools F, amenities F.
- Stringtown (rural): math 20% / reading 30% proficiency, ranked #344 of 513 in OK (top 67%) — low school quality limits family demand, transient renter base, plan for 1-2y turnover; 65% free/reduced lunch — lower-income household profile, screen leases tightly.
- Market conditions: 7 active listings in the ZIP.
Forward outlook
- In year one you build about $1k of equity ($380 loan paydown + $726 appreciation (1.3% local appreciation)).
- Atoka County population projected at -18% by 2050 — secular population decline; favor cash flow + early exit over multi-decade hold.
- At projected returns (1.3% appreciation + 3.0% rent growth), your $15k cash investment doubles in ~4 years — after that, you're playing with house money.
Negotiation context
- It's been on market 100 days — a 9% lower offer ($50k) is reasonable based on typical stale-listing flexibility.
- 4 sale attempts since 2y ago; this cycle's ask has dropped $8k (13%) from the opening price — seller is motivated, your offer sets the floor, not the list.
Risks & watch-outs
- Watch-outs: built in 1921 — expect roof / HVAC / electrical / plumbing capex.
- Climate carrying-cost: major wildfire risk; extreme-heat days projected 7→20/yr by 2055 (HVAC capex compounding) — expect insurance premiums to compound above CPI over the hold.
Questions for the listing agent
- It's been on market 100 days. Have you received any prior offers? Is the seller open to a 9% concession, seller financing, or rate buy-down credit?
- Built in 1921 — when were the roof, HVAC, electrical panel, plumbing, and water heater last replaced?
- Why hasn't it sold? Are there any deal-killer items the seller is aware of (foundation, flood, title, zoning, code violations)?
- Is there a deadline driving the sale (1031 exchange, divorce, estate, relocation)? That informs how much negotiation room exists.
- Schools are F-rated, which usually means shorter tenancies and higher turnover. Who's the typical renter profile here, and what's been the actual vacancy rate?
- What's the average days-on-market for RENTAL listings here right now (not sales)? A rising rental-DOM trend means longer vacancies and softer asking-rent achievability than the comps imply.
- What's the recent tenant-quality profile in this submarket — average credit score on applications, eviction rate, late-payment / NSF rate, and stable-employment percentage? A property-management company in the area should have these aggregated.
- How much new for-sale + rental construction is in the pipeline within 1–3 miles? Heavy new supply typically softens prices + rents 12–24 months out; constrained supply supports both.
Investment metrics
- 1% rule
- 1.58% ✓
- Cap rate
- 12.96%
- Cash-on-cash
- 23.82%
- DSCR
- 2.06
- GRM
- 5.3
CMA / ARV
- ARV (on-the-fly)
- $48,672
- Comps found
- 1
Show comp detail 1 sale within ~0.75 mi
| Address | Dist | Beds/Ba | Sqft | Sold | Price | $/sf | Match |
|---|---|---|---|---|---|---|---|
| 345 E Cumberland Ave | 0.00mi | 2/1.0 | 936 (0%) | 0mo | $49,000 | $52 | 100 |
Match score weights: distance 35% · size 25% · config 20% · recency 20%. Top-matched comps best support the ARV.
Projected returns pro-forma
1.32% appreciation · 3.0% rent growth · sell at horizon
- IRR
- 26.7%
- Equity multiple
- 2.39×
- Total profit
- $21,347
- Equity at exit
- $19,669
- IRR
- 29.0%
- Equity multiple
- 4.58×
- Total profit
- $55,066
- Equity at exit
- $26,870
Cash invested: $15,372 (down + closing). Projections, not guarantees.
Landlord ↔ Tenant lean methodology
- Overall (STATE)
- 83 Strongly Landlord-Friendly
- State Oklahoma
- 83 Strongly Landlord-Friendly · R+20
- County
- — inherits STATE
- City
- — inherits STATE
ZIP-level market 74569
- Home prices YoY
- 0.6%
- Active inventory
- 7
- Price-to-rent
- 5.3×
Monthly cashflow live
- Estimated rent
- $867 medium interval (Pro) →
- Mortgage (P&I)
- −$288
- Tax est. 1.5%
- −$69 /mo · $824/yr
- Insurance
- −$23
- HOA
- −$0
- Vacancy / Maint / Mgmt
- −$182
- Net cashflow
- $305
Break-even live
UW: 25.0% down · 7.5% · 30yr · 1.5% tax · 5.0% vac · 8.0% maint · 8.0% mgmt
Financing live
Cash to close
- Down payment
- $13,725
- Closing costs
- $1,647
- Reserves months
- —
- Total cash needed
- —
Loan-product check · same deal, 3 products live
Conventional
25% down · 7.5% · 30yr
- Down + closing
- —
- Monthly P&I
- —
- Monthly cashflow
- —
- DSCR
- —
- Eligible?
- —
Personal DTI + credit; lowest rate.
DSCR
20% down · 8.5% · 30yr
- Down + closing
- —
- Monthly P&I
- —
- Monthly cashflow
- —
- DSCR
- —
- Eligible?
- —
No personal income docs; deal must DSCR.
Hard money
10% down · 12.0% · 12mo
- Down + closing
- —
- Monthly P&I
- —
- Monthly cashflow
- —
- DSCR
- —
- Eligible?
- —
Short-term bridge; refi at stabilization.
Listing history 17 events
-
2026-06-04days on market $54,900 Active 100 DOM
-
2026-06-02days on market $54,900 Active 99 DOM
-
2026-06-01days on market $54,900 Active 98 DOM
-
2026-05-31days on market $54,900 Active 97 DOM
-
2026-04-12price $54,900
-
2026-02-23$62,999 Active
-
2026-02-21historical
-
2025-11-26price $62,999
-
2025-09-09price $64,999
-
2025-08-21$75,000 Active
-
2025-07-04historical
-
2025-01-31$79,000 Active
-
2025-01-31historical
-
2024-10-17price $79,000
-
2024-08-29price $89,000
-
2024-08-02price $96,000
-
2024-07-13$99,000 Active
ⓘ Source: listings_history table (triggers on properties + properties_extension) + one-shot
backfill from property_details.listing_events for pre-trigger history.
Climate risk First Street
- Flood 1/10 Low FEMA zone X · 0% chance over 30 yrs
- Wildfire 7/10 Severe
- Heat 6/10 Major 7 d/yr ≥112°F today · 20 d/yr by 30 yrs out
- Wind 4/10 Moderate 10% chance of damaging wind over 30 yrs
- Air quality 2/10 Low 0 unhealthy d/yr today · 1 by 30 yrs out
Nearby sold comps map
Loading sold comps map…
Walkable amenities ~0.75 mi
Loading nearby amenities…
Taxation est. · year 1
- Rental income
- $10,399
- − Mortgage interest
- −$3,075
- − Property taxes
- −$824
- − Insurance
- −$274
- − Repairs & maintenance
- −$832
- − Management
- −$832
- − Depreciation
- −$1,597
- Taxable income
- $2,964
- Est. tax owed @ 24.0%
- −$711
- After-tax cash flow
- $2,951/yr
For passive investors: Depreciation is non-cash, so a rental often shows a tax loss while cash-flowing — sheltering income. Rental losses are passive: they offset passive income freely, and up to $25,000/yr can offset ordinary (W-2) income if you actively participate and your MAGI is under $100k (phasing out to $0 by $150k); unused losses carry forward. On sale, claimed depreciation is recaptured at up to 25%, and gains may owe capital-gains tax (a 1031 exchange can defer both). Figures are a year-1 estimate at your 24.0% rate — not tax advice; consult a CPA.
Schools (NCES district)
- District
- Stringtown
- NCES district ID
- 4029010
- Math proficiency
- 20% ▼ -5.00%
- Reading proficiency
- 30% ▼ -5.00%
- Median HH income
- $39,562
- Composite
- 24.08/100
- National rank
- #13164
- State rank
- #344 of 513 in OK
Livability — Stringtown
- Score
- 62/100
- State rank
- #252
- US rank
- #16682
Category grades
Schools grade is shown separately in the Schools card above.
Census & demographics
- Census place
- Stringtown, OK
- Population (ZIP)
- 610
Population outlook (Atoka County) Hauer SSP2
- Today (2025)
- 13,004 people
- By 2030
- 12,522 · -3.7%
- By 2040
- 11,595 · -10.8%
- By 2050
- 10,709 · -17.6%
- By 2075
- 8,957 · -31.1%
- By 2100
- 7,452 · -42.7%
Race, ethnicity, and origin ACS 2023
- Neighborhood character
- Diverse neighborhood (Simpson 0.66)
- Race & ethnicity
- White 57% Two or more races 18% Black 15% Native American 11%
- Common ancestry
- Slovak 2% Iranian 1% Scotch-Irish 1%
Political lean MEDSL · Atoka
- 2024 margin
- Solid R (+71.6) · D 13.8% · R 85.3%
- 2008→2024 swing
- -27.7pp toward R · 2008: -43.9pp · 2024: -71.6pp
- All cycles
- 2024: R+71.6 2020: R+70.4 2016: R+65.4 2012: R+48.0 2008: R+43.9
Not yet ingested
- Civics
- —
Market trends
- HPI YoY
- ▲ 1.32%
- Current HPI
- 230.1399
- Rent YoY
- —
- Metro
- —
- State GDP YoY
- ▲ 1.55%
- F500 in state
- 6
Industry mix (Fortune 500 HQ in OK)
| Industry | F500 HQs | Revenue |
|---|---|---|
| Energy | 3 | $48B |
|
||
Price history
-44.5% since first listed13 events — show timeline
- 2026-04-12 Price Changed $54,900 MLS Technology, Inc.
- 2026-02-23 Listed $62,999 MLS Technology, Inc.
- 2026-02-21 Listing Removed — MLS Technology, Inc.
- 2025-11-26 Price Changed $62,999 MLS Technology, Inc.
- 2025-09-09 Price Changed $64,999 MLS Technology, Inc.
- 2025-08-21 Listed $75,000 MLS Technology, Inc.
- 2025-07-04 Listing Removed — MLS Technology, Inc.
- 2025-01-31 Listing Removed — MLS Technology, Inc.
- 2025-01-31 Listed $79,000 MLS Technology, Inc.
- 2024-10-17 Price Changed $79,000 MLS Technology, Inc.
- 2024-08-29 Price Changed $89,000 MLS Technology, Inc.
- 2024-08-02 Price Changed $96,000 MLS Technology, Inc.
- 2024-07-13 Listed $99,000 MLS Technology, Inc.
Cash-flow waterfall
monthlySold comps — $/sqft
last 12 mo · ≤1 miLoading sold comps…