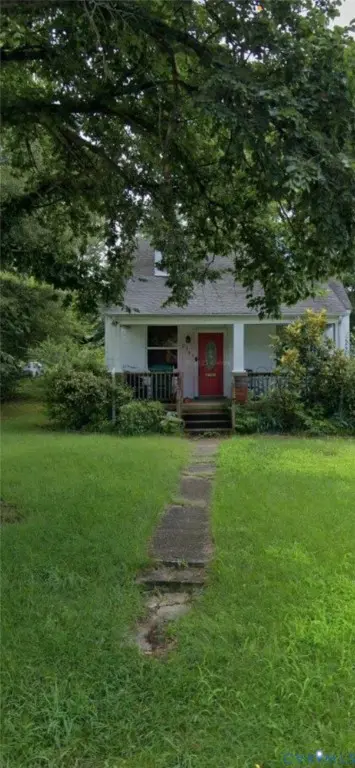
2303 Carlisle Ave · Montrose, VA
Flood risk 1/10 · Minimal
- FEMA flood zone
- X (unshaded)
- Chance of flooding over 30 yrs
- 0.0%
- Est. flood insurance / yr
- $507 – $1,088
Fire risk 2/10 · Minimal
- Est. fire insurance / yr
- $666 – $1,236
Heat risk 7/10 · Major
- Hot days now (above 105°F)
- 7 days/yr
- Hot days in 30 yrs
- 16 days/yr
Wind risk 6/10 · Moderate
- Chance of severe wind over 30 yrs
- 27.0%
Air-quality risk 2/10 · Minimal
- Unhealthy air days now
- 1 days/yr
- Unhealthy air days in 30 yrs
- 2 days/yr
Risk factors via First Street. Map © Google.
Why this score? — see what drove the C- grade
The composite is a weighted blend of 9 inputs, each scored 0–100. Each bar is that input's sub-score; the figure is the points it added to the 100-point composite (weight × sub-score).
- ARV discount +15.0/15.0
- Cash flow +13.6/30.0
- Schools +4.9/10.0
- DSCR +4.1/10.0
- 1% rule +3.8/10.0
- Livability +3.8/5.0
- Rent growth +2.8/5.0
- Condition / age +2.5/5.0
- Appreciation +0.0/10.0
$235,000
🖨 Deal sheet (PDF) 📄 Offer letter ✓ Due diligence
Listing remarks
Investor special! Great opportunity to renovate and add value to this 2-level Cape Cod/bungalow. Featuring 4 bedrooms (2 on the main level and 2 upstairs), with a full bath on the main level and a half bath on the upper level, this home offers a flexible layout ready for your vision. The property includes a covered front porch and a spacious yard, providing additional potential for outdoor improvements or expansion. Ideal for a fix-and-flip, rental property, or long-term hold. Conveniently located with plenty of charm, enjoy walkability to local, family-owned businesses, with shopping and dining just minutes away. Bring your contractor and imagination—this home needs updates, but offe
Key facts
- Covered front porch
- Spacious yard
- 6,311 sq ft lot
Tags
Neighborhood map
What this means for you Summary
Snapshot
- This is a 4-bed/1.5-bath single-family listed at $235k.
Deal economics
- At list price, monthly cash flow is $14 ($166/yr) — positive.
- The deal already cash-flows at list — no discount required.
- To meet the 1% rule (rent ≥ 1% of price), the offer needs to be $207k (11.8% below list).
- Recommended offer: $207k (11.8% below list) — sets the bar for 1% rule.
- Cap rate 6.4% vs local median 4.3% in Montrose — top-decile yield for the area; either an underpriced asset or a hidden risk that comps aren't pricing in. Stress-test before assuming the spread holds.
Location & tenants
- Location reads 75/100 on livability (#129 in VA, #4,169 nationally) — a middle-class / working-renter tenant base. Strengths: commute A+, cost of living A+, housing A-; Watch: employment D+, amenities F.
- Henrico County Public School District (suburban): math 49% / reading 64% proficiency, ranked #68 of 131 in VA (top 52%) — acceptable for families but not a draw, mixed tenant base, ~2y average lease.
- Zoned schools: Montrose Elementary (math 22% / reading 37%, grade F, #1,011 of 1,108 statewide, top 92%, 311 students, 89% FRL); John Rolfe Middle (math 15% / reading 28%, grade F, #338 of 342 statewide, top 99%, 764 students, 89% FRL); Varina High (math 40% / reading 73%, grade C, #270 of 319 statewide, top 86%, 1,405 students, 87% FRL) — zoned schools average 88% FRL vs 34% district-wide (54 pts higher); higher-poverty schools than district average — tighter screening recommended.
- Zoned-school proficiency averages 36% at this address vs 56% district-wide (-21 pts) — the specific schools serving this property underperform the Henrico County Public School District average; the district grade overstates school quality for this exact location.
- Market conditions: Rents rising (+1.1%/yr); 188 active listings in the ZIP; 10 comparable units currently listed for rent nearby; rentals at typical pace (median 23d on market — plan ~3-4 weeks tenant-placement turnaround); solid renter incomes; 1,826 units permitted in Henrico County in 2024 (785 in 5+ unit buildings).
- This rent runs 33% of the median local income ($77k/yr) — at the standard rent-burdened threshold; future hikes will face affordability resistance.
Forward outlook
- Local home prices are declining (-3.0%/yr); year-one equity from $2k of loan paydown is wiped out by about $7k of value loss. Plan a longer hold.
- Henrico County population projected at +21% by 2050 — long-run rental-demand tailwind backs the buy-and-hold thesis.
Negotiation context
- It's been on market 31 days — a 3% lower offer ($228k) is reasonable based on typical stale-listing flexibility.
- Current owner paid $80k; list at $235k implies a 194% gain — meaningful room to come down on a strong offer.
Risks & watch-outs
- Watch-outs: built in 1939 — expect roof / HVAC / electrical / plumbing capex.
- Climate carrying-cost: major wind risk, 27% chance of damaging wind over 30y; extreme-heat days projected 7→16/yr by 2055 (HVAC capex compounding) — expect insurance premiums to compound above CPI over the hold.
Questions for the listing agent
- It's been on market 31 days. Have you received any prior offers? Is the seller open to a 12% concession, seller financing, or rate buy-down credit?
- Built in 1939 — when were the roof, HVAC, electrical panel, plumbing, and water heater last replaced?
- Is there a deadline driving the sale (1031 exchange, divorce, estate, relocation)? That informs how much negotiation room exists.
- Schools are D-rated, which usually means shorter tenancies and higher turnover. Who's the typical renter profile here, and what's been the actual vacancy rate?
- What's the average days-on-market for RENTAL listings here right now (not sales)? A rising rental-DOM trend means longer vacancies and softer asking-rent achievability than the comps imply.
- What's the recent tenant-quality profile in this submarket — average credit score on applications, eviction rate, late-payment / NSF rate, and stable-employment percentage? A property-management company in the area should have these aggregated.
- How much new for-sale + rental construction is in the pipeline within 1–3 miles? Heavy new supply typically softens prices + rents 12–24 months out; constrained supply supports both.
Investment metrics
- 1% rule
- 0.88% ✗
- Cap rate
- 6.36%
- Cash-on-cash
- 0.25%
- DSCR
- 1.01
- GRM
- 9.4
CMA / ARV
- ARV (on-the-fly)
- $329,760
- Comps found
- 12
Show comp detail 12 sales within ~0.75 mi
| Address | Dist | Beds/Ba | Sqft | Sold | Price | $/sf | Match |
|---|---|---|---|---|---|---|---|
| 2303 Carlisle Ave | 0.00mi | 4/1.5 | 1,440 (0%) | 1mo | $240,000 | $167 | 99 |
| 1815 Carlisle Ave | 0.29mi | 3/1.0 (-1) | 1,471 (+2%) | 2mo | $197,000 | $134 | 74 |
| 2304 N Newton Cir | 0.38mi | 3/2.5 (-1) | 1,440 (0%) | 2mo | $345,000 | $240 | 72 |
| 2323 Farrand Dr | 0.18mi | 4/2.0 | 1,599 (+11%) | 2mo | $366,000 | $229 | 70 |
| 2239 Williamsburg Rd | 0.15mi | 4/1.5 | 1,613 (+12%) | 5mo | $249,900 | $155 | 68 |
| 1332 Darbytown Rd | 0.56mi | 4/1.5 | 1,547 (+7%) | 2mo | $195,000 | $126 | 59 |
| 2670 Biscuit Ct | 0.44mi | 4/2.5 | 1,604 (+11%) | 3mo | $382,105 | $238 | 54 |
| 1508 Williamsburg Rd | 0.65mi | 3/2.5 (-1) | 1,520 (+6%) | 0mo | $330,000 | $217 | 51 |
| 1422 Carlisle Ave | 0.68mi | 3/3.0 (-1) | 1,412 (-2%) | 4mo | $367,000 | $260 | 50 |
| 5122 Salem St | 0.65mi | 3/2.0 (-1) | 1,326 (-8%) | 1mo | $325,000 | $245 | 49 |
| 1509 Nelson St | 0.73mi | 3/1.0 (-1) | 1,316 (-9%) | 0mo | $295,000 | $224 | 44 |
| 5202 Campbell Ave | 0.72mi | 3/2.5 (-1) | 1,595 (+11%) | 2mo | $385,000 | $241 | 38 |
Match score weights: distance 35% · size 25% · config 20% · recency 20%. Top-matched comps best support the ARV.
Projected returns pro-forma
-3.0% appreciation · 1.06% rent growth · sell at horizon
- IRR
- -18.1%
- Equity multiple
- 0.37×
- Total profit
- $-41,136
- Equity at exit
- $35,039
- IRR
- -14.6%
- Equity multiple
- 0.24×
- Total profit
- $-50,226
- Equity at exit
- $20,319
Cash invested: $65,800 (down + closing). Projections, not guarantees.
Landlord ↔ Tenant lean methodology
- Overall (STATE)
- 55 Moderately Landlord-Leaning
- State Virginia
- 55 Moderately Landlord-Leaning · D+2
- County
- — inherits STATE
- City
- — inherits STATE
ZIP-level market 23231
- Rents YoY
- 1.1%
- Active inventory
- 188
- Price-to-rent
- 9.4×
Monthly cashflow live
- Estimated rent
- $2,073 high interval (Pro) →
- Mortgage (P&I)
- −$1,232
- Tax est. 1.5%
- −$294 /mo · $3,525/yr
- Insurance
- −$98
- HOA
- −$0
- Vacancy / Maint / Mgmt
- −$435
- Net cashflow
- $14
Break-even live
Sensitivity live
| Price | -10% $176 | -5% $95 | +0% $14 | +5% $-67 | +10% $-149 |
|---|---|---|---|---|---|
| Rent | -10% $-150 | -5% $-68 | +0% $14 | +5% $96 | +10% $178 |
| Rate | -1.0pp $132 | -0.5pp $74 | base $14 | +0.5pp $-47 | +1.0pp $-109 |
UW: 25.0% down · 7.5% · 30yr · 1.5% tax · 5.0% vac · 8.0% maint · 8.0% mgmt
Financing live
Cash to close
- Down payment
- $58,750
- Closing costs
- $7,050
- Reserves months
- —
- Total cash needed
- —
Loan-product check · same deal, 3 products live
Conventional
25% down · 7.5% · 30yr
- Down + closing
- —
- Monthly P&I
- —
- Monthly cashflow
- —
- DSCR
- —
- Eligible?
- —
Personal DTI + credit; lowest rate.
DSCR
20% down · 8.5% · 30yr
- Down + closing
- —
- Monthly P&I
- —
- Monthly cashflow
- —
- DSCR
- —
- Eligible?
- —
No personal income docs; deal must DSCR.
Hard money
10% down · 12.0% · 12mo
- Down + closing
- —
- Monthly P&I
- —
- Monthly cashflow
- —
- DSCR
- —
- Eligible?
- —
Short-term bridge; refi at stabilization.
Rent comps 10 comps
| Address | Beds | Baths | Sqft | Rent | $/sqft | DOM | Units | Dist |
|---|---|---|---|---|---|---|---|---|
| 2411 Carlisle Ave Henrico, VA | 3.0 | 1.0 | 930 | $1,750 | $1.88 | 3d | 1 | 0.27mi |
| 2524 National St Henrico, VA | 3.0 | 2.0 | 1144 | $2,100 | $1.84 | 45d | 1 | 0.38mi |
| 1400 Jennie Scher Rd Richmond, VA | 2.0–3.0 | 1.0 | 900 | $1,475 | $1.64 | 45d | 2 | 0.68mi |
| 5319 Blueridge Ave Richmond, VA | 3.0 | 1.0 | 1200 | $1,914 | $1.59 | 23d | 1 | 0.69mi |
| 1210 Carlisle Ave Richmond, VA | 3.0 | 1.0 | 912 | $1,695 | $1.86 | 6d | 1 | 0.77mi |
| 5410 Campbell Ave Richmond, VA | 4.0 | 2.5 | 1560 | $2,100 | $1.35 | 45d | 1 | 0.79mi |
| 5506 Campbell Ave Richmond, VA | 5.0 | 2.0 | 960 | $3,300 | $3.44 | 25d | 1 | 0.84mi |
| 5205 Scott St Richmond, VA | 3.0 | 1.0 | 912 | $1,995 | $2.19 | 4d | 1 | 0.94mi |
| 811 N 33rd St Unit A Richmond, VA | 3.0 | 2.0 | 1315 | $1,900 | $1.44 | 6d | 1 | 1.36mi |
| 811 N 33rd St Unit A Richmond, VA | 3.0 | 2.0 | 1315 | $1,900 | $1.44 | 19d | 1 | 1.36mi |
Listing history 8 events
-
2026-04-27status Pending
-
2026-04-21price $235,000
-
2026-04-17price $245,000
-
2026-04-13price $255,000
-
2026-03-31price $265,000
-
2026-03-27$285,000 Active
-
2000-06-01soldstatus $79,900
-
1997-11-01soldstatus $38,000
ⓘ Source: listings_history table (triggers on properties + properties_extension) + one-shot
backfill from property_details.listing_events for pre-trigger history.
Climate risk First Street
- Flood 1/10 Low FEMA zone X (unshaded) · 0% chance over 30 yrs
- Wildfire 2/10 Low
- Heat 7/10 Severe 7 d/yr ≥105°F today · 16 d/yr by 30 yrs out
- Wind 6/10 Major 27% chance of damaging wind over 30 yrs
- Air quality 2/10 Low 1 unhealthy d/yr today · 2 by 30 yrs out
Nearby sold comps map
Loading sold comps map…
Walkable amenities ~0.75 mi
Loading nearby amenities…
Taxation est. · year 1
- Rental income
- $24,879
- − Mortgage interest
- −$13,164
- − Property taxes
- −$3,525
- − Insurance
- −$1,175
- − Repairs & maintenance
- −$1,990
- − Management
- −$1,990
- − Depreciation
- −$6,836
- Taxable loss
- −$3,801
- Est. tax savings @ 24.0%
- +$912
- After-tax cash flow
- $1,079/yr
For passive investors: Depreciation is non-cash, so a rental often shows a tax loss while cash-flowing — sheltering income. Rental losses are passive: they offset passive income freely, and up to $25,000/yr can offset ordinary (W-2) income if you actively participate and your MAGI is under $100k (phasing out to $0 by $150k); unused losses carry forward. On sale, claimed depreciation is recaptured at up to 25%, and gains may owe capital-gains tax (a 1031 exchange can defer both). Figures are a year-1 estimate at your 24.0% rate — not tax advice; consult a CPA.
Schools (NCES district)
- District
- Henrico County Public School District
- NCES district ID
- 5101890
- Math proficiency
- 49% ▼ -32.00%
- Reading proficiency
- 64% ▼ -12.00%
- Median HH income
- $61,854
- Composite
- 49.25/100
- National rank
- #2031
- State rank
- #68 of 131 in VA
Livability — Montrose
- Score
- 75/100
- State rank
- #129
- US rank
- #4169
Category grades
Schools grade is shown separately in the Schools card above.
Census & demographics
- Census place
- Montrose, VA
- County
- Henrico County · 334,490 people
- Metro
- Richmond, VA
- Population (ZIP)
- 38,544
- Household income
- $76,505
- Rent vs Own
- Severe rent burden
- 1555.0
Population outlook (Henrico County) Hauer SSP2
- Today (2025)
- 365,885 people
- By 2030
- 384,255 · +5.0%
- By 2040
- 416,688 · +13.9%
- By 2050
- 442,376 · +20.9%
- By 2075
- 488,037 · +33.4%
- By 2100
- 487,430 · +33.2%
Race, ethnicity, and origin ACS 2023
- Neighborhood character
- Majority Black (59%)
- Race & ethnicity
- Black 59% White 34% Two or more races 4% Hispanic / Latino 3%
- Common ancestry
- Slovak 1% Serbian 1% Lithuanian 1%
- Foreign-born
- 4% · Canada
- Languages at home
- 95% English-only · Spanish 3% French/Haitian/Cajun 1%
Political lean MEDSL · Henrico
- 2024 margin
- Strong D (+28.9) · D 63.7% · R 34.8% · Other 1.5%
- 2008→2024 swing
- +16.6pp toward D · 2008: 12.2pp · 2024: 28.9pp
- All cycles
- 2024: D+28.9 2020: D+29.0 2016: D+21.0 2012: D+11.7 2008: D+12.2
Not yet ingested
- Civics
- —
Market trends
- HPI YoY
- ▼ -207.28%
- Current HPI
- 315.8154
- Rent YoY
- ▲ 1.06%
- Metro
- Richmond, VA
- State GDP YoY
- ▲ 2.40%
- F500 in state
- 50
Industry mix (Fortune 500 HQ in VA)
| Industry | F500 HQs | Revenue |
|---|---|---|
| Aerospace / Defense | 4 | $236B |
|
||
| Technology / Defense | 3 | $32B |
|
||
| Financial Services | 2 | $176B |
|
||
| Utilities | 2 | $27B |
|
||
| Insurance | 2 | $25B |
|
||
| Technology | 2 | $15B |
|
||
Price history
+518.4% since first listed8 events — show timeline
- 2026-04-27 Pending — CVRMLS
- 2026-04-21 Price Changed $235,000 CVRMLS
- 2026-04-17 Price Changed $245,000 CVRMLS
- 2026-04-13 Price Changed $255,000 CVRMLS
- 2026-03-31 Price Changed $265,000 CVRMLS
- 2026-03-27 Listed $285,000 CVRMLS
- 2000-06-01 Sold (Public Records) $79,900 Public Records
- 1997-11-01 Sold (Public Records) $38,000 Public Records
Cash-flow waterfall
monthlySold comps — $/sqft
last 12 mo · ≤1 miLoading sold comps…