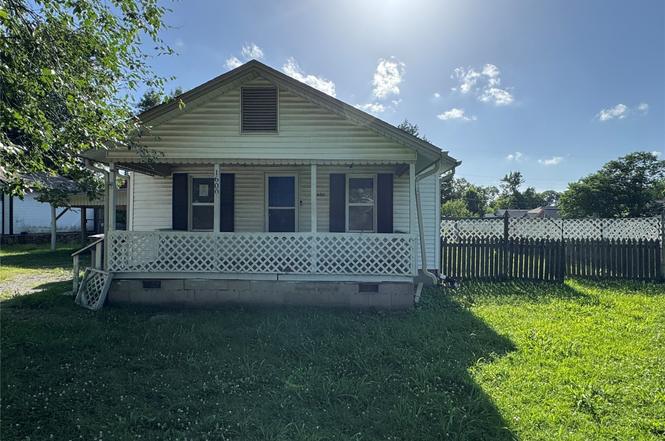
1600 S Park St · Sapulpa, OK
Flood risk 1/10 · Minimal
- FEMA flood zone
- X (unshaded)
- Chance of flooding over 30 yrs
- 0.0%
- Est. flood insurance / yr
- $507 – $1,088
Fire risk 5/10 · Moderate
- Est. fire insurance / yr
- $2,463 – $4,575
Heat risk 6/10 · Moderate
- Hot days now (above 110°F)
- 7 days/yr
- Hot days in 30 yrs
- 18 days/yr
Wind risk 3/10 · Minor
- Chance of severe wind over 30 yrs
- 4.0%
Air-quality risk 2/10 · Minimal
- Unhealthy air days now
- 0 days/yr
- Unhealthy air days in 30 yrs
- 1 days/yr
Risk factors via First Street. Map © Google.
Why this score? — see what drove the B- grade
The composite is a weighted blend of 9 inputs, each scored 0–100. Each bar is that input's sub-score; the figure is the points it added to the 100-point composite (weight × sub-score).
- Cash flow +30.0/30.0
- 1% rule +10.0/10.0
- DSCR +10.0/10.0
- ARV discount +7.5/15.0
- Livability +3.4/5.0
- Rent growth +2.5/5.0
- Condition / age +2.5/5.0
- Schools +2.0/10.0
- Appreciation +0.0/10.0
$65,000
🖨 Deal sheet 📄 Offer letter ✓ Due diligence
Listing remarks MLS
This beautiful corner lot home sits on three lots with mature trees. Nice layout, this 3 bed, 1 bath starter home is close to downtown Sapulpa, giant backyard with a storage shed. Spacious bedrooms, one of which offers 2 closets, and a great kitchen with lots of cabinets and counter space. The large laundry room has plenty of space for shelving, deep freeze, extra fridge or pets. There is an exterior door to the double carport & also the backyard. Check out the virtual tour for the complete floor plan.
Key facts
- Spacious yard
- Corner-lot home
- Three lots
Tags
Neighborhood map
What this means for you Summary
Snapshot
- This is a 2-bed/1.0-bath single-family listed at $65k.
Deal economics
- At list price, monthly cash flow is $366 ($4k/yr) — positive.
- The deal already cash-flows at list — no discount required.
- Meets the 1% rule at list price ($1k rent vs $65k).
- Cap rate 13.0% vs local median 2.8% in Sapulpa — top-decile yield for the area; either an underpriced asset or a hidden risk that comps aren't pricing in. Stress-test before assuming the spread holds.
Location & tenants
- Location reads 67/100 on livability (#88 in OK) — a middle-class / working-renter tenant base. Strengths: cost of living A+, housing A+, crime B+; Watch: schools F, amenities F, commute F.
- Sapulpa (suburban): math 23% / reading 24% proficiency, ranked #129 of 270 in OK (top 48%) — low school quality limits family demand, transient renter base, plan for 1-2y turnover.
- Market conditions: 196 active listings in the ZIP; 9 comparable units currently listed for rent nearby; rentals leasing fast (median 2d on market — plan ~1-2 weeks tenant-placement turnaround); 193 units permitted in Creek County in 2024 (76 in 5+ unit buildings).
Forward outlook
- Local home prices are declining (-3.0%/yr); year-one equity from $449 of loan paydown is wiped out by about $2k of value loss. Plan a longer hold.
- At projected returns (-3.0% appreciation + 3.0% rent growth), your $18k cash investment doubles in ~6 years — after that, you're playing with house money.
Negotiation context
- Only 7 days on market — expect competitive offers; lowballing is unlikely to land.
- 8 sale attempts since 27y ago with the ask held roughly flat each time — persistent listings suggest the price (not the market) is what's stuck; bring a comps-based counter.
Risks & watch-outs
- Climate carrying-cost: moderate wildfire risk; extreme-heat days projected 7→18/yr by 2055 (HVAC capex compounding) — expect insurance premiums to compound above CPI over the hold.
Questions for the listing agent
- Is there a deadline driving the sale (1031 exchange, divorce, estate, relocation)? That informs how much negotiation room exists.
- Schools are F-rated, which usually means shorter tenancies and higher turnover. Who's the typical renter profile here, and what's been the actual vacancy rate?
- What's the average days-on-market for RENTAL listings here right now (not sales)? A rising rental-DOM trend means longer vacancies and softer asking-rent achievability than the comps imply.
- What's the recent tenant-quality profile in this submarket — average credit score on applications, eviction rate, late-payment / NSF rate, and stable-employment percentage? A property-management company in the area should have these aggregated.
- How much new for-sale + rental construction is in the pipeline within 1–3 miles? Heavy new supply typically softens prices + rents 12–24 months out; constrained supply supports both.
Investment metrics
- 1% rule
- 1.67% ✓
- Cap rate
- 13.04%
- Cash-on-cash
- 24.10%
- DSCR
- 2.07
- GRM
- 5.0
CMA / ARV
- ARV (on-the-fly)
- $160,512
- Comps found
- 12
Show comp detail 12 sales within ~0.75 mi
| Address | Dist | Beds/Ba | Sqft | Sold | Price | $/sf | Match |
|---|---|---|---|---|---|---|---|
| 1600 S Park St | 0.00mi | 3/1.0 (+1) | 1,056 (0%) | 1mo | $77,500 | $73 | 94 |
| 110 W Mill Ave | 0.40mi | 3/1.5 (+1) | 1,075 (+2%) | 5mo | $150,000 | $140 | 67 |
| 135 W Mill Ave | 0.46mi | 3/1.0 (+1) | 1,131 (+7%) | 1mo | $181,000 | $160 | 61 |
| 2124 S Main St | 0.50mi | 3/1.0 (+1) | 1,170 (+11%) | 1mo | $164,500 | $141 | 53 |
| 1003 S Hickory St | 0.67mi | 1/1.0 (-1) | 981 (-7%) | 1mo | $97,000 | $99 | 51 |
| 2203 S Poplar St | 0.54mi | 3/1.0 (+1) | 1,185 (+12%) | 0mo | $196,000 | $165 | 49 |
| 2125 S Main St | 0.50mi | 3/1.0 (+1) | 928 (-12%) | 3mo | $163,000 | $176 | 49 |
| 2326 S Main St | 0.64mi | 3/1.0 (+1) | 1,190 (+13%) | 3mo | $165,000 | $139 | 41 |
| 226 W Orleans Ave | 0.70mi | 3/1.0 (+1) | 915 (-13%) | 0mo | $167,500 | $183 | 40 |
| 91 E Fairlane Ct | 0.72mi | 3/2.0 (+1) | 1,157 (+10%) | 2mo | $175,000 | $151 | 40 |
| 14 E Portland Ave | 0.68mi | 3/1.0 (+1) | 909 (-14%) | 2mo | $140,000 | $154 | 39 |
| 41 W Fairlane Ct | 0.72mi | 3/2.0 (+1) | 1,186 (+12%) | 5mo | $180,000 | $152 | 32 |
Match score weights: distance 35% · size 25% · config 20% · recency 20%. Top-matched comps best support the ARV.
Projected returns pro-forma
-3.0% appreciation · 3.0% rent growth · sell at horizon
- IRR
- 17.4%
- Equity multiple
- 1.70×
- Total profit
- $12,795
- Equity at exit
- $9,692
- IRR
- 25.9%
- Equity multiple
- 3.27×
- Total profit
- $41,299
- Equity at exit
- $5,620
Cash invested: $18,200 (down + closing). Projections, not guarantees.
Landlord ↔ Tenant lean methodology
- Overall (STATE)
- 83 Strongly Landlord-Friendly
- State Oklahoma
- 83 Strongly Landlord-Friendly · R+20
- County
- — inherits STATE
- City
- — inherits STATE
ZIP-level market 74066
- Home prices YoY
- -26.3%
- Active inventory
- 196
- Price-to-rent
- 5.0×
Monthly cashflow live
- Estimated rent
- $1,086 high interval (Pro) →
- Mortgage (P&I)
- −$341
- Tax from tax record
- −$125 /mo · $1,497/yr
- Insurance
- −$27
- HOA
- −$0
- Vacancy / Maint / Mgmt
- −$228
- Net cashflow
- $366
Break-even live
UW: 25.0% down · 7.5% · 30yr · 1.5% tax · 5.0% vac · 8.0% maint · 8.0% mgmt
Financing live
Cash to close
- Down payment
- $16,250
- Closing costs
- $1,950
- Reserves months
- —
- Total cash needed
- —
Loan-product check · same deal, 3 products live
Conventional
25% down · 7.5% · 30yr
- Down + closing
- —
- Monthly P&I
- —
- Monthly cashflow
- —
- DSCR
- —
- Eligible?
- —
Personal DTI + credit; lowest rate.
DSCR
20% down · 8.5% · 30yr
- Down + closing
- —
- Monthly P&I
- —
- Monthly cashflow
- —
- DSCR
- —
- Eligible?
- —
No personal income docs; deal must DSCR.
Hard money
10% down · 12.0% · 12mo
- Down + closing
- —
- Monthly P&I
- —
- Monthly cashflow
- —
- DSCR
- —
- Eligible?
- —
Short-term bridge; refi at stabilization.
Rent comps 9 comps
| Address | Beds | Baths | Sqft | Rent | $/sqft | DOM | Units | Dist |
|---|---|---|---|---|---|---|---|---|
| 42 W Mike Ave Sapulpa, OK | 1.0 | 1.0 | 795 | $825 | $1.04 | 2d | 1 | 0.47mi |
| 919 S Mission St Sapulpa, OK | 2.0–3.0 | 1.0–2.0 | 950 | $995 | $1.05 | 1d | 2 | 0.82mi |
| 418 S Water St Sapulpa, OK | 3.0 | 1.0 | 1166 | $1,300 | $1.11 | 10d | 1 | 0.95mi |
| 322 S Park St Unit 07 Sapulpa, OK | 1.0 | 1.0 | 750 | $975 | $1.30 | 1d | 1 | 1.01mi |
| 322 S Park St Unit 6 Sapulpa, OK | 1.0 | 1.0 | 750 | $925 | $1.23 | 1d | 1 | 1.01mi |
| 405 S Maple St Unit F Sapulpa, OK | 2.0 | 1.0 | 1280 | $955 | $0.75 | 1d | 1 | 1.01mi |
| 405 S Maple St Unit F Sapulpa, OK | 2.0 | 1.0 | 1280 | $955 | $0.75 | 16d | 1 | 1.01mi |
| 925 E Thompson Ave Sapulpa, OK | 3.0 | 1.0 | 1416 | $1,450 | $1.02 | 1d | 1 | 1.27mi |
| 925 E Thompson Ave Sapulpa, OK | 3.0 | 1.0 | 1416 | $1,450 | $1.02 | 10d | 1 | 1.27mi |
Listing history 29 events
-
2026-02-04status Pending
-
2026-01-27$65,000 Active
-
2020-10-27soldstatus $100,500
-
2020-10-16soldstatus $100,250 Closed 513-char remark
Show marketing remark (513 chars)
This beautiful corner lot home sits on three lots with mature trees. Nice layout, this 3 bed, 1 bath starter home is close to downtown Sapulpa, giant backyard with a storage shed. Spacious bedrooms, one of which offers 2 closets, and a great kitchen with lots of cabinets and counter space. The large laundry room has plenty of space for shelving, deep freeze, extra fridge or pets. There is an exterior door to the double carport & also the backyard. Check out the virtual tour for the complete floor plan.
-
2020-09-17status Pending 513-char remark
Show marketing remark (513 chars)
This beautiful corner lot home sits on three lots with mature trees. Nice layout, this 3 bed, 1 bath starter home is close to downtown Sapulpa, giant backyard with a storage shed. Spacious bedrooms, one of which offers 2 closets, and a great kitchen with lots of cabinets and counter space. The large laundry room has plenty of space for shelving, deep freeze, extra fridge or pets. There is an exterior door to the double carport & also the backyard. Check out the virtual tour for the complete floor plan.
-
2020-09-11$97,500 Active 513-char remark
Show marketing remark (513 chars)
This beautiful corner lot home sits on three lots with mature trees. Nice layout, this 3 bed, 1 bath starter home is close to downtown Sapulpa, giant backyard with a storage shed. Spacious bedrooms, one of which offers 2 closets, and a great kitchen with lots of cabinets and counter space. The large laundry room has plenty of space for shelving, deep freeze, extra fridge or pets. There is an exterior door to the double carport & also the backyard. Check out the virtual tour for the complete floor plan.
-
2015-10-23soldstatus $85,000
-
2015-10-14soldstatus $85,000 Closed 219-char remark
Show marketing remark (219 chars)
This beautiful corner lot home sits on three lots with mature trees. Nice layout, this 3 bed, 1 bath starter home is close to downtown Sapulpa, giant backyard with a storage shed. This home is updated and move in ready.
-
2015-09-11status Pending 219-char remark
Show marketing remark (219 chars)
This beautiful corner lot home sits on three lots with mature trees. Nice layout, this 3 bed, 1 bath starter home is close to downtown Sapulpa, giant backyard with a storage shed. This home is updated and move in ready.
-
2015-06-30$83,000 Active 219-char remark
Show marketing remark (219 chars)
This beautiful corner lot home sits on three lots with mature trees. Nice layout, this 3 bed, 1 bath starter home is close to downtown Sapulpa, giant backyard with a storage shed. This home is updated and move in ready.
-
2007-11-05soldstatus $79,000
-
2005-07-07soldstatus $56,000
-
2005-07-06soldstatus $56,000
-
2005-06-15historical
-
2005-03-30$64,900
-
2004-03-05soldstatus $34,816
-
2004-01-20historical
-
2004-01-08$37,300
-
2001-05-14soldstatus $62,000
-
2001-02-19soldstatus $42,500
-
2001-02-02soldstatus $42,500
-
2000-11-07historical
-
2000-09-27$49,500
-
2000-02-23historical
-
1999-08-23$52,500
-
1999-06-24soldstatus $36,000
-
1999-06-24soldstatus $36,000
-
1999-06-04historical
-
1999-05-17$35,000
ⓘ Source: listings_history table (triggers on properties + properties_extension) + one-shot
backfill from property_details.listing_events for pre-trigger history.
Tax reassessment forecast OK · Resets to sale price
- Current annual tax
- $1,497 · $125/mo
- Projected year-2 tax
- $1,497 · $125/mo
- Expected delta
- $0/yr ($0/mo · 0.0%)
ⓘ Screening estimate from a state-policy table — verify with the county assessor before closing.
Climate risk First Street
- Flood 1/10 Low FEMA zone X (unshaded) · 0% chance over 30 yrs
- Wildfire 5/10 Major
- Heat 6/10 Major 7 d/yr ≥110°F today · 18 d/yr by 30 yrs out
- Wind 3/10 Moderate 4% chance of damaging wind over 30 yrs
- Air quality 2/10 Low 0 unhealthy d/yr today · 1 by 30 yrs out
Nearby sold comps map
Loading sold comps map…
Walkable amenities ~0.75 mi
Loading nearby amenities…
Taxation est. · year 1
- Rental income
- $13,037
- − Mortgage interest
- −$3,641
- − Property taxes
- −$1,497
- − Insurance
- −$325
- − Repairs & maintenance
- −$1,043
- − Management
- −$1,043
- − Depreciation
- −$1,891
- Taxable income
- $3,597
- Est. tax owed @ 24.0%
- −$863
- After-tax cash flow
- $3,524/yr
For passive investors: Depreciation is non-cash, so a rental often shows a tax loss while cash-flowing — sheltering income. Rental losses are passive: they offset passive income freely, and up to $25,000/yr can offset ordinary (W-2) income if you actively participate and your MAGI is under $100k (phasing out to $0 by $150k); unused losses carry forward. On sale, claimed depreciation is recaptured at up to 25%, and gains may owe capital-gains tax (a 1031 exchange can defer both). Figures are a year-1 estimate at your 24.0% rate — not tax advice; consult a CPA.
Schools (NCES district)
- District
- Sapulpa
- NCES district ID
- 4026910
- Math proficiency
- 23% ▼ -12.00%
- Reading proficiency
- 24% ▼ -12.00%
- Median HH income
- $44,536
- Composite
- 20.29/100
- National rank
- #8616
- State rank
- #129 of 270 in OK
Livability — Sapulpa
- Score
- 67/100
- State rank
- #88
- US rank
- #10676
Category grades
Schools grade is shown separately in the Schools card above.
Census & demographics
- Census place
- Sapulpa, OK
- County
- Creek County · 32,292 people
- City population
- 32,292
- Metro
- Tulsa, OK
- Population (ZIP)
- 32,292
- Household income
- $64,698
- Rent vs Own
- Severe rent burden
- 716.0
Population outlook (Creek County) Hauer SSP2
- Today (2025)
- 72,706 people
- By 2030
- 73,032 · +0.4%
- By 2040
- 72,788 · +0.1%
- By 2050
- 71,558 · -1.6%
- By 2075
- 69,248 · -4.8%
- By 2100
- 62,722 · -13.7%
Race, ethnicity, and origin ACS 2023
- Neighborhood character
- Predominantly White (71%)
- Race & ethnicity
- White 71% Native American 12% Two or more races 9% Hispanic / Latino 6% Black 3%
- Hispanic origin (detail)
- Mexican 4%
- Common ancestry
- Slovak 2% Lithuanian 2% Italian 2%
- Foreign-born
- 2% · Canada
- Languages at home
- 96% English-only · Spanish 3%
Political lean MEDSL · Creek
- 2024 margin
- Solid R (+55.7) · D 21.2% · R 77.0% · Other 1.8%
- 2008→2024 swing
- -14.1pp toward R · 2008: -41.6pp · 2024: -55.7pp
- All cycles
- 2024: R+55.7 2020: R+54.8 2016: R+54.5 2012: R+45.4 2008: R+41.6
Not yet ingested
- Civics
- —
Market trends
- HPI YoY
- ▼ -89.18%
- Current HPI
- 250.2859
- Rent YoY
- —
- Metro
- Tulsa, OK
- State GDP YoY
- ▲ 1.55%
- F500 in state
- 6
Industry mix (Fortune 500 HQ in OK)
| Industry | F500 HQs | Revenue |
|---|---|---|
| Energy | 3 | $48B |
|
||
Price history
+85.7% since first listed29 events — show timeline
- 2026-02-04 Pending — MLS Technology, Inc.
- 2026-01-27 Listed $65,000 MLS Technology, Inc.
- 2020-10-27 Sold (Public Records) $100,500 Public Records
- 2020-10-16 Sold (MLS) $100,250 MLS Technology, Inc.
- 2020-09-17 Pending — MLS Technology, Inc.
- 2020-09-11 Listed $97,500 MLS Technology, Inc.
- 2015-10-23 Sold (Public Records) $85,000 Public Records
- 2015-10-14 Sold (MLS) $85,000 MLS Technology, Inc.
- 2015-09-11 Pending — MLS Technology, Inc.
- 2015-06-30 Listed $83,000 MLS Technology, Inc.
- 2007-11-05 Sold (Public Records) $79,000 Public Records
- 2005-07-07 Sold (Public Records) $56,000 Public Records
- 2005-07-06 Sold (MLS) $56,000 MLS Technology, Inc.
- 2005-06-15 Listing Removed — MLS Technology, Inc.
- 2005-03-30 Listed $64,900 MLS Technology, Inc.
- 2004-03-05 Sold (MLS) $34,816 MLS Technology, Inc.
- 2004-01-20 Listing Removed — MLS Technology, Inc.
- 2004-01-08 Listed $37,300 MLS Technology, Inc.
- 2001-05-14 Sold (Public Records) $62,000 Public Records
- 2001-02-19 Sold (MLS) $42,500 MLS Technology, Inc.
- 2001-02-02 Sold (Public Records) $42,500 Public Records
- 2000-11-07 Listing Removed — MLS Technology, Inc.
- 2000-09-27 Listed $49,500 MLS Technology, Inc.
- 2000-02-23 Listing Removed — MLS Technology, Inc.
- 1999-08-23 Listed $52,500 MLS Technology, Inc.
- 1999-06-24 Sold (Public Records) $36,000 Public Records
- 1999-06-24 Sold (MLS) $36,000 MLS Technology, Inc.
- 1999-06-04 Listing Removed — MLS Technology, Inc.
- 1999-05-17 Listed $35,000 MLS Technology, Inc.
Property tax history
+2.7%/yrLatest (2025): $1,497 · +1.1% YoY. Source: county tax records.
Cash-flow waterfall
monthlySold comps — $/sqft
last 12 mo · ≤1 miLoading sold comps…