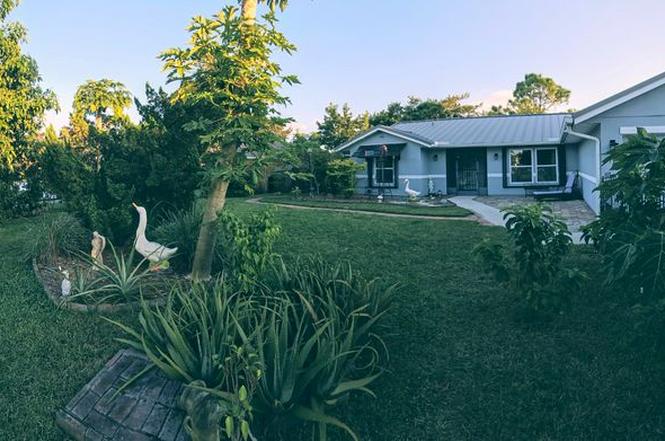
718 SW Abraham Ave · Port St. Lucie, FL
Flood risk 1/10 · Minimal
- FEMA flood zone
- X (unshaded)
- Chance of flooding over 30 yrs
- 0.0%
- Est. flood insurance / yr
- $507 – $1,088
Fire risk 3/10 · Minor
- Est. fire insurance / yr
- $947 – $1,759
Heat risk 10/10 · Severe
- Hot days now (above 106°F)
- 7 days/yr
- Hot days in 30 yrs
- 26 days/yr
Wind risk 10/10 · Severe
- Chance of severe wind over 30 yrs
- 99.0%
Air-quality risk 1/10 · Minimal
- Unhealthy air days now
- 0 days/yr
- Unhealthy air days in 30 yrs
- 0 days/yr
Risk factors via First Street. Map © Google.
Why this score? — see what drove the F grade
The composite is a weighted blend of 9 inputs, each scored 0–100. Each bar is that input's sub-score; the figure is the points it added to the 100-point composite (weight × sub-score).
- Cash flow +10.0/30.0
- Schools +3.7/10.0
- DSCR +2.9/10.0
- Rent growth +2.6/5.0
- Livability +2.5/5.0
- Condition / age +2.5/5.0
- 1% rule +2.0/10.0
- ARV discount +0.0/15.0
- Appreciation +0.0/10.0
$426,000
🖨 Deal sheet (PDF) 📄 Offer letter ✓ Due diligence
Listing remarks MLS
Bargain priced home in highly desirable area, located near Turnpike entrance and soon I-95. Split floor plan, kitchen offers eat in area, lots of cabinets, sliders out to screened porch, drainage canal in rear for extra privacy & 2 sheds for additional storage. Accordian shutters and inside utility room.
Key facts
- New metal roof
- Mature fruit trees
- New screened patio
Tags
Property features AI
Exterior
- Home design: House
- Construction: 1,850 sq ft living area
- Exterior features: 10,000 sq ft lot
Neighborhood map
What this means for you Summary
Snapshot
- This is a 3-bed/2.0-bath single-family listed at $426k.
Deal economics
- At list price, monthly cash flow is $-255 ($-3k/yr) — negative.
- To cash-flow at today's rent, offer at most $381k (10.6% below list).
- To meet the 1% rule (rent ≥ 1% of price), the offer needs to be $297k (30.3% below list).
- Recommended offer: $297k (30.3% below list) — sets the bar for 1% rule.
- Cap rate 5.6% vs local median 3.9% in Port St. Lucie — top-decile yield for the area; either an underpriced asset or a hidden risk that comps aren't pricing in. Stress-test before assuming the spread holds.
Location & tenants
- Location reads: area grade F — affects rentability + tenant quality, not the cash-flow math above.
- St. Lucie (urban): math 40% / reading 48% proficiency, ranked #51 of 73 in FL (top 70%) — families likely to look elsewhere, expect single-tenant / working-renter base with shorter leases.
- Zoned schools: Manatee Academy K-8 (math 53% / reading 51%, grade C-, #990 of 2,144 statewide, top 48%, 1,664 students, 65% FRL); Southern Oaks Middle School (math 39% / reading 43%, grade F, #353 of 571 statewide, top 63%, 894 students, 76% FRL); Fort Pierce Central High School (math 15% / reading 45%, grade F, #441 of 667 statewide, top 67%, 3,091 students, 62% FRL).
- Market conditions: Rents flat; 768 active listings in the ZIP; 18 comparable units currently listed for rent nearby; rentals at typical pace (median 26d on market — plan ~3-4 weeks tenant-placement turnaround); solid renter incomes; 4,868 units permitted in St. Lucie County in 2024 (268 in 5+ unit buildings).
- This rent runs 42% of the median local income ($86k/yr) — at the standard rent-burdened threshold; future hikes will face affordability resistance.
Forward outlook
- Local home prices are declining (-3.0%/yr); year-one equity from $3k of loan paydown is wiped out by about $13k of value loss. Plan a longer hold.
- St. Lucie County population projected at +20% by 2050 — long-run rental-demand tailwind backs the buy-and-hold thesis.
Negotiation context
- It's been on market 223 days — a 12% lower offer ($375k) is reasonable based on typical stale-listing flexibility.
- 4 sale attempts since 20y ago with the ask held roughly flat each time — persistent listings suggest the price (not the market) is what's stuck; bring a comps-based counter.
- Current owner paid $80k; list at $426k implies a 432% gain — meaningful room to come down on a strong offer.
Risks & watch-outs
- Climate carrying-cost: severe wind risk, 99% chance of damaging wind over 30y; extreme-heat days projected 7→26/yr by 2055 (HVAC capex compounding) — expect insurance premiums to compound above CPI over the hold.
Questions for the listing agent
- What do current leases actually rent for vs. the listed asking? Can we see a recent rent roll and the last 12 months of T-12 income?
- It's been on market 223 days. Have you received any prior offers? Is the seller open to a 30% concession, seller financing, or rate buy-down credit?
- Why hasn't it sold? Are there any deal-killer items the seller is aware of (foundation, flood, title, zoning, code violations)?
- Is there a deadline driving the sale (1031 exchange, divorce, estate, relocation)? That informs how much negotiation room exists.
- The area grade is low — what's the realistic commute time and amenity access for the typical tenant pool here? Any planned neighborhood developments (good or bad) we should know about?
- What's the average days-on-market for RENTAL listings here right now (not sales)? A rising rental-DOM trend means longer vacancies and softer asking-rent achievability than the comps imply.
- What's the recent tenant-quality profile in this submarket — average credit score on applications, eviction rate, late-payment / NSF rate, and stable-employment percentage? A property-management company in the area should have these aggregated.
- How much new for-sale + rental construction is in the pipeline within 1–3 miles? Heavy new supply typically softens prices + rents 12–24 months out; constrained supply supports both.
Investment metrics
- 1% rule
- 0.70% ✗
- Cap rate
- 5.58%
- Cash-on-cash
- -2.56%
- DSCR
- 0.89
- GRM
- 12.0
CMA / ARV
- ARV (on-the-fly)
- $360,135
- Comps found
- 5
Show comp detail 5 sales within ~0.75 mi
| Address | Dist | Beds/Ba | Sqft | Sold | Price | $/sf | Match |
|---|---|---|---|---|---|---|---|
| 4626 SW Ulster St | 0.41mi | 3/2.0 | 1,304 (-4%) | 9mo | $345,000 | $265 | 67 |
| 504 SW Pea Ct | 0.54mi | 3/2.0 | 1,353 (-0%) | 11mo | $400,000 | $296 | 65 |
| 962 SW Haleyberry Ave | 0.69mi | 3/2.0 | 1,270 (-6%) | 7mo | $320,000 | $252 | 51 |
| 4617 SW Pearl St | 0.68mi | 3/2.0 | 1,445 (+6%) | 21mo | $385,000 | $266 | 40 |
| 4657 SW Leeward St | 0.59mi | 3/2.0 | 1,559 (+15%) | 16mo | $370,000 | $237 | 34 |
Match score weights: distance 35% · size 25% · config 20% · recency 20%. Top-matched comps best support the ARV.
Projected returns pro-forma
-3.0% appreciation · 0.22% rent growth · sell at horizon
- IRR
- -23.4%
- Equity multiple
- 0.22×
- Total profit
- $-93,506
- Equity at exit
- $63,518
- IRR
- -26.4%
- Equity multiple
- -0.13×
- Total profit
- $-134,357
- Equity at exit
- $36,833
Cash invested: $119,280 (down + closing). Projections, not guarantees.
Landlord ↔ Tenant lean methodology
- Overall (STATE)
- 87 Strongly Landlord-Friendly
- State Florida
- 87 Strongly Landlord-Friendly · R+3
- County
- — inherits STATE
- City
- — inherits STATE
ZIP-level market 34953
- Home prices YoY
- -10.1%
- Rents YoY
- 0.2%
- Active inventory
- 768
- Price-to-rent
- 12.0×
Monthly cashflow live
- Estimated rent
- $2,969 high interval (Pro) →
- Mortgage (P&I)
- −$2,234
- Tax from tax record
- −$188 /mo · $2,262/yr
- Insurance
- −$178
- HOA
- −$0
- Vacancy / Maint / Mgmt
- −$623
- Net cashflow
- $-255
Break-even live
Sensitivity live
| Price | -10% $-14 | -5% $-134 | +0% $-255 | +5% $-375 | +10% $-496 |
|---|---|---|---|---|---|
| Rent | -10% $-489 | -5% $-372 | +0% $-255 | +5% $-138 | +10% $-20 |
| Rate | -1.0pp $-40 | -0.5pp $-146 | base $-255 | +0.5pp $-365 | +1.0pp $-478 |
UW: 25.0% down · 7.5% · 30yr · 1.5% tax · 5.0% vac · 8.0% maint · 8.0% mgmt
Financing live
Cash to close
- Down payment
- $106,500
- Closing costs
- $12,780
- Reserves months
- —
- Total cash needed
- —
Loan-product check · same deal, 3 products live
Conventional
25% down · 7.5% · 30yr
- Down + closing
- —
- Monthly P&I
- —
- Monthly cashflow
- —
- DSCR
- —
- Eligible?
- —
Personal DTI + credit; lowest rate.
DSCR
20% down · 8.5% · 30yr
- Down + closing
- —
- Monthly P&I
- —
- Monthly cashflow
- —
- DSCR
- —
- Eligible?
- —
No personal income docs; deal must DSCR.
Hard money
10% down · 12.0% · 12mo
- Down + closing
- —
- Monthly P&I
- —
- Monthly cashflow
- —
- DSCR
- —
- Eligible?
- —
Short-term bridge; refi at stabilization.
Rent comps 18 comps
| Address | Beds | Baths | Sqft | Rent | $/sqft | DOM | Units | Dist |
|---|---|---|---|---|---|---|---|---|
| 4498 SW Port St Lucie Blvd Port Saint Lucie, FL | 3.0 | 2.5 | 1122 | $2,500 | $2.23 | 25d | 1 | 0.38mi |
| 4481 SW Darlington St Port Saint Lucie, FL | 4.0 | 2.0 | 1796 | $2,700 | $1.50 | 16d | 1 | 0.48mi |
| 393 SW Tarra Ave Port Saint Lucie, FL | 4.0 | 2.0 | 1827 | $2,900 | $1.59 | 23d | 1 | 0.62mi |
| 601 SW Icon Ave Port Saint Lucie, FL | 3.0 | 2.0 | 1383 | $2,800 | $2.02 | 23d | 1 | 0.68mi |
| 4285 SW Walker St Port Saint Lucie, FL | 4.0 | 2.0 | 1833 | $2,476 | $1.35 | 16d | 1 | 0.85mi |
| 4262 SW Jared St Port Saint Lucie, FL | 3.0 | 2.0 | 1240 | $2,350 | $1.90 | 25d | 1 | 0.87mi |
| 962 SW Kappa Ave Port Saint Lucie, FL | 3.0 | 2.0 | 1275 | $3,000 | $2.35 | 25d | 1 | 0.95mi |
| 511 SW Nadell Ave Port Saint Lucie, FL | 4.0 | 2.0 | 1833 | $2,486 | $1.36 | 16d | 1 | 0.98mi |
| 866 SW Bushel Trl Palm City, FL | 3.0 | 2.5 | 1846 | $3,900 | $2.11 | 25d | 1 | 1.10mi |
| 864 SW Bushel Trl Palm City, FL | 3.0 | 2.5 | 1855 | $3,900 | $2.10 | 25d | 1 | 1.11mi |
| 860 SW Bushel Trl Palm City, FL | 3.0 | 2.5 | 1840 | $3,750 | $2.04 | 25d | 1 | 1.11mi |
| 1201 SW Idol Ave Port Saint Lucie, FL | 3.0 | 2.0 | 1796 | $2,600 | $1.45 | 16d | 1 | 1.13mi |
| 952 SW Jasper Ave Port Saint Lucie, FL | 4.0 | 2.0 | 1833 | $2,216 | $1.21 | 23d | 1 | 1.25mi |
| 7808 SW Cline St Palm City, FL | 3.0 | 2.5 | 1846 | $4,000 | $2.17 | 25d | 1 | 1.26mi |
| 930 SW Prairie Ave Palm City, FL | 3.0 | 3.0 | 1834 | $3,800 | $2.07 | 25d | 1 | 1.26mi |
| 4209 SW McClellen St Port Saint Lucie, FL | 3.0 | 2.0 | 1766 | $3,400 | $1.93 | 25d | 1 | 1.28mi |
| 459 SW Laconic Ave Port Saint Lucie, FL | 3.0 | 2.0 | 1351 | $2,670 | $1.98 | 16d | 1 | 1.31mi |
| 223 SW Elderberry Dr Port Saint Lucie, FL | 3.0 | 2.0 | 1231 | $2,200 | $1.79 | 25d | 1 | 1.49mi |
Listing history 30 events
-
2026-06-21days on market $426,000 Active 223 DOM
-
2026-06-18days on market $426,000 Active 220 DOM
-
2026-06-17days on market $426,000 Active 219 DOM
-
2026-06-16days on market $426,000 Active 218 DOM
-
2026-06-15days on market $426,000 Active 217 DOM
-
2026-06-14days on market $426,000 Active 215 DOM
-
2026-06-13days on market $426,000 Active 214 DOM
-
2026-06-10days on market $426,000 Active 212 DOM
-
2026-06-09days on market $426,000 Active 211 DOM
-
2026-06-08days on market $426,000 Active 210 DOM
-
2026-06-07days on market $426,000 Active 209 DOM
-
2026-06-05pricedays on market $426,000 Active 206 DOM
-
2026-06-03days on market $399,000 Active 205 DOM
-
2026-06-02days on market $399,000 Active 204 DOM
-
2026-06-01days on market $399,000 Active 203 DOM
-
2026-05-31days on market $399,000 Active 202 DOM
-
2026-05-30days on market $399,000 Active 201 DOM
-
2025-12-26price $399,000
-
2025-11-10$447,000 Active
-
2025-02-09historical
-
2024-08-10$418,000 Active
-
2024-08-09historical
-
2008-06-26soldstatus $80,000 309-char remark
Show marketing remark (309 chars)
Bargain priced home in highly desirable area, located near Turnpike entrance and soon I-95. Split floor plan, kitchen offers eat in area, lots of cabinets, sliders out to screened porch, drainage canal in rear for extra privacy & 2 sheds for additional storage. Accordian shutters and inside utility room.
-
2008-06-23historical 309-char remark
Show marketing remark (309 chars)
Bargain priced home in highly desirable area, located near Turnpike entrance and soon I-95. Split floor plan, kitchen offers eat in area, lots of cabinets, sliders out to screened porch, drainage canal in rear for extra privacy & 2 sheds for additional storage. Accordian shutters and inside utility room.
-
2008-03-17$79,900 309-char remark
Show marketing remark (309 chars)
Bargain priced home in highly desirable area, located near Turnpike entrance and soon I-95. Split floor plan, kitchen offers eat in area, lots of cabinets, sliders out to screened porch, drainage canal in rear for extra privacy & 2 sheds for additional storage. Accordian shutters and inside utility room.
-
2006-06-05soldstatus $198,000
-
2006-05-31soldstatus $198,000
-
2006-05-30historical
-
2006-03-07$199,000
-
1991-02-26soldstatus $8,300
ⓘ Source: listings_history table (triggers on properties + properties_extension) + one-shot
backfill from property_details.listing_events for pre-trigger history.
Tax reassessment forecast FL · Resets to sale price
- Current annual tax
- $2,262 · $188/mo
- Projected year-2 tax
- $3,536 · $295/mo
- Expected delta
- +$1,274/yr (+$106/mo · 56.3%)
ⓘ Screening estimate from a state-policy table — verify with the county assessor before closing.
Climate risk First Street
- Flood 1/10 Low FEMA zone X (unshaded) · 0% chance over 30 yrs
- Wildfire 3/10 Moderate
- Heat 10/10 Extreme 7 d/yr ≥106°F today · 26 d/yr by 30 yrs out
- Wind 10/10 Extreme 99% chance of damaging wind over 30 yrs
- Air quality 1/10 Low 0 unhealthy d/yr today · 0 by 30 yrs out
Nearby sold comps map
Loading sold comps map…
Walkable amenities ~0.75 mi
Loading nearby amenities…
Taxation est. · year 1
- Rental income
- $35,622
- − Mortgage interest
- −$23,863
- − Property taxes
- −$2,262
- − Insurance
- −$2,130
- − Repairs & maintenance
- −$2,850
- − Management
- −$2,850
- − Depreciation
- −$12,393
- Taxable loss
- −$10,724
- Est. tax savings @ 24.0%
- +$2,574
- After-tax cash flow
- $-484/yr
For passive investors: Depreciation is non-cash, so a rental often shows a tax loss while cash-flowing — sheltering income. Rental losses are passive: they offset passive income freely, and up to $25,000/yr can offset ordinary (W-2) income if you actively participate and your MAGI is under $100k (phasing out to $0 by $150k); unused losses carry forward. On sale, claimed depreciation is recaptured at up to 25%, and gains may owe capital-gains tax (a 1031 exchange can defer both). Figures are a year-1 estimate at your 24.0% rate — not tax advice; consult a CPA.
Schools (NCES district)
- District
- St. Lucie
- NCES district ID
- 1201770
- Math proficiency
- 40% ▼ -11.00%
- Reading proficiency
- 48% ▼ -4.00%
- Median HH income
- $44,737
- Composite
- 37.28/100
- National rank
- #4449
- State rank
- #51 of 73 in FL
Livability — Port St. Lucie
No livability data for this city. (Only ~50 U.S. cities are tracked.)
Census & demographics
- Census place
- Port St. Lucie, FL
- County
- Saint Lucie County · 337,150 people
- City population
- 221,051
- Metro
- Port St. Lucie, FL
- Population (ZIP)
- 86,875
- Household income
- $85,667
- Rent vs Own
- Severe rent burden
- 857.0
Population outlook (St. Lucie County) Hauer SSP2
- Today (2025)
- 338,016 people
- By 2030
- 355,687 · +5.2%
- By 2040
- 385,521 · +14.1%
- By 2050
- 406,106 · +20.1%
- By 2075
- 441,054 · +30.5%
- By 2100
- 436,885 · +29.2%
Race, ethnicity, and origin ACS 2023
- Neighborhood character
- Diverse neighborhood (Simpson 0.69)
- Race & ethnicity
- White 42% Hispanic / Latino 28% Black 23% Two or more races 15% Asian 2%
- Hispanic origin (detail)
- Mexican 2% Puerto Rican 8% Cuban 4% Dominican 3%
- Common ancestry
- Hispanic 4% Romanian 2% Estonian 2%
- Foreign-born
- 24% · Canada, Jamaica, China
- Languages at home
- 69% English-only · Spanish 19% French/Haitian/Cajun 6% Other Indo-European 3%
Political lean MEDSL · St. Lucie
- 2024 margin
- Lean R (+9.1) · D 45.1% · R 54.2%
- 2008→2024 swing
- -21.2pp toward R · 2008: 12.1pp · 2024: -9.1pp
- All cycles
- 2024: R+9.1 2020: R+1.6 2016: R+2.5 2012: D+7.9 2008: D+12.1
Not yet ingested
- Civics
- —
Market trends
- HPI YoY
- ▼ -44.19%
- Current HPI
- 392.7681
- Rent YoY
- ▲ 0.22%
- Metro
- Port St. Lucie, FL
- State GDP YoY
- ▲ 3.28%
- F500 in state
- 36
Industry mix (Fortune 500 HQ in FL)
| Industry | F500 HQs | Revenue |
|---|---|---|
| Industrial Technology | 2 | $29B |
|
||
| Insurance | 2 | $17B |
|
||
| Retail | 1 | $60B |
|
||
| Technology Distribution | 1 | $58B |
|
||
| Homebuilding | 1 | $35B |
|
||
| Technology Manufacturing | 1 | $35B |
|
||
Price history
+4707.2% since first listed13 events — show timeline
- 2025-12-26 Price Changed $399,000 ForSaleByOwner.com
- 2025-11-10 Listed $447,000 ForSaleByOwner.com
- 2025-02-09 Listing Removed — Beaches MLS
- 2024-08-10 Listed $418,000 Beaches MLS
- 2024-08-09 Coming Soon — Beaches MLS
- 2008-06-26 Sold (MLS) $80,000 Beaches MLS
- 2008-06-23 Listing Removed — Beaches MLS
- 2008-03-17 Listed $79,900 Beaches MLS
- 2006-06-05 Sold (Public Records) $198,000 Public Records
- 2006-05-31 Sold (MLS) $198,000 Beaches MLS
- 2006-05-30 Listing Removed — Beaches MLS
- 2006-03-07 Listed $199,000 Beaches MLS
- 1991-02-26 Sold (Public Records) $8,300 Public Records
Property tax history
+7.0%/yrLatest (2025): $2,262 · +4.1% YoY. Source: county tax records.
Cash-flow waterfall
monthlySold comps — $/sqft
last 12 mo · ≤1 miLoading sold comps…