5307 E Lakeshore Dr · Temple, TX
Flood risk 1/10 · Minimal
- FEMA flood zone
- X (unshaded)
- Chance of flooding over 30 yrs
- 0.0%
- Est. flood insurance / yr
- $507 – $1,088
Fire risk 5/10 · Moderate
- Est. fire insurance / yr
- $1,222 – $2,270
Heat risk 7/10 · Major
- Hot days now (above 108°F)
- 5 days/yr
- Hot days in 30 yrs
- 17 days/yr
Wind risk 6/10 · Moderate
- Chance of severe wind over 30 yrs
- 71.0%
Air-quality risk 1/10 · Minimal
- Unhealthy air days now
- 0 days/yr
- Unhealthy air days in 30 yrs
- 0 days/yr
Risk factors via First Street. Map © Google.
Why this score? — see what drove the D grade
The composite is a weighted blend of 9 inputs, each scored 0–100. Each bar is that input's sub-score; the figure is the points it added to the 100-point composite (weight × sub-score).
- ARV discount +13.0/15.0
- Cash flow +9.9/30.0
- Schools +3.8/10.0
- Livability +3.8/5.0
- DSCR +2.8/10.0
- Rent growth +2.8/5.0
- 1% rule +2.5/10.0
- Condition / age +2.5/5.0
- Appreciation +0.0/10.0
$295,000
🖨 Deal sheet 📄 Offer letter ✓ Due diligence
Listing remarks MLS
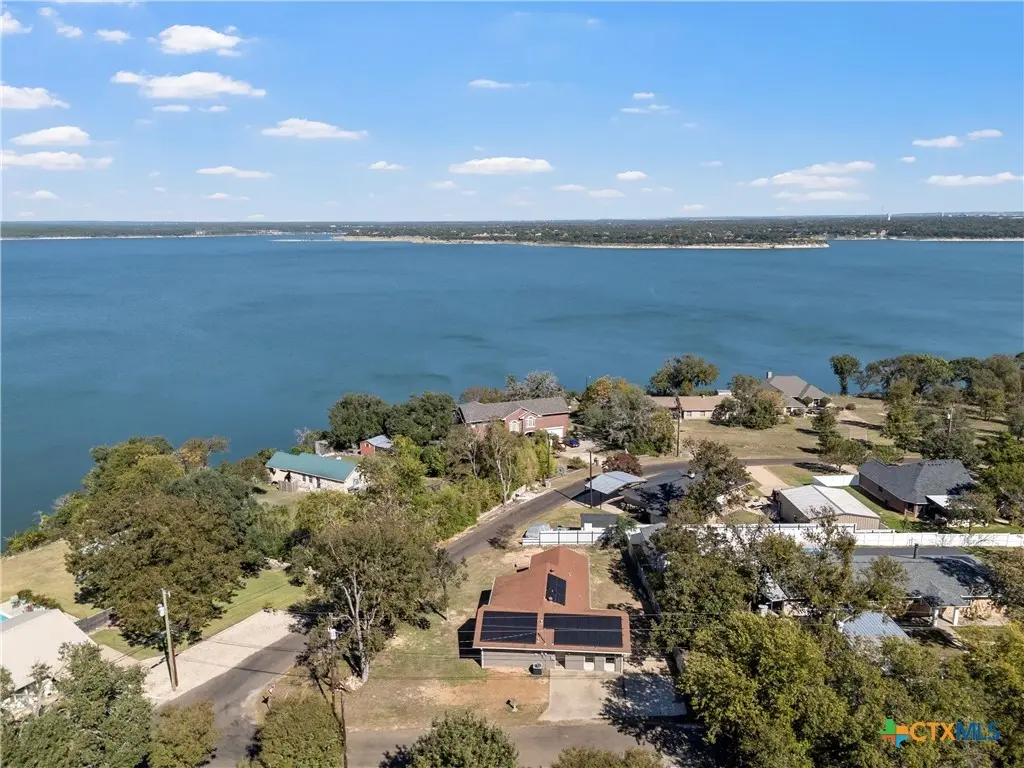
Beautifully updated home near Lake Belton! This 3-bedroom, 3-bath home offers flexibility, comfort, and a fantastic location minutes from the lake. Each bedroom includes its own ensuite bathroom giving you great flexibility whether you are making this home your permanent residence or your next investment. The home has been thoughtfully remodeled featuring updated bathrooms, a fully updated kitchen with new appliances and new flooring. The HVAC unit was replaced about 2 years ago providing efficiency and peace of mind. Enjoy partial views of the lake from the living room, from the 2nd bedroom, and from the private deck off of the 1st bedroom. Located just minutes from multiple Belton Lake access points, Miller Springs Nature Center, and downtown Belton shopping and dining. Conviently situated approximately 8 miles from Baylor Scott & White Medical Center and 10 miles from Olin E. Teague Veterans' Medical Center in Temple.
Key facts
- Private deck
- Updated bathrooms
- Updated kitchen
Tags
Neighborhood map
What this means for you Summary
Snapshot
- This is a 3-bed/2.0-bath single-family listed at $295k.
Deal economics
- At list price, monthly cash flow is $-185 ($-2k/yr) — negative.
- To cash-flow at today's rent, offer at most $262k (11.1% below list).
- To meet the 1% rule (rent ≥ 1% of price), the offer needs to be $222k (24.9% below list).
- Recommended offer: $222k (24.9% below list) — sets the bar for 1% rule.
- Cap rate 5.5% vs local median 3.6% in Temple — top-decile yield for the area; either an underpriced asset or a hidden risk that comps aren't pricing in. Stress-test before assuming the spread holds.
Location & tenants
- Location reads 75/100 on livability (#122 in TX, #3,814 nationally) — a middle-class / working-renter tenant base. Strengths: cost of living A+, housing A+, health & safety A+; Watch: schools C-, commute C-, crime D+.
- Belton ISD (suburban): math 39% / reading 46% proficiency, ranked #285 of 826 in TX (top 34%) — families likely to look elsewhere, expect single-tenant / working-renter base with shorter leases.
- Market conditions: Rents rising (+1.3%/yr); 745 active listings in the ZIP; 6 comparable units currently listed for rent nearby; rentals lingering (median 44d on market — plan ~5-8 weeks vacancy on turnover, expect pricing pressure); 50% of comp listings sitting > 30 days — soft ceiling on asking rent; solid renter incomes; 3,222 units permitted in Bell County in 2024 (246 in 5+ unit buildings).
- This rent runs 33% of the median local income ($81k/yr) — at the standard rent-burdened threshold; future hikes will face affordability resistance.
Forward outlook
- Local home prices are declining (-3.0%/yr); year-one equity from $2k of loan paydown is wiped out by about $9k of value loss. Plan a longer hold.
- Bell County population projected at +21% by 2050 — long-run rental-demand tailwind backs the buy-and-hold thesis.
Negotiation context
- It's been on market 219 days — a 12% lower offer ($260k) is reasonable based on typical stale-listing flexibility.
- 3 sale attempts since 7y ago; this cycle's ask has dropped $30k (9%) from the opening price — seller is motivated, your offer sets the floor, not the list.
Risks & watch-outs
- Climate carrying-cost: major wind risk, 71% chance of damaging wind over 30y; moderate wildfire risk; extreme-heat days projected 5→17/yr by 2055 (HVAC capex compounding) — expect insurance premiums to compound above CPI over the hold.
Questions for the listing agent
- What do current leases actually rent for vs. the listed asking? Can we see a recent rent roll and the last 12 months of T-12 income?
- It's been on market 219 days. Have you received any prior offers? Is the seller open to a 25% concession, seller financing, or rate buy-down credit?
- Why hasn't it sold? Are there any deal-killer items the seller is aware of (foundation, flood, title, zoning, code violations)?
- Is there a deadline driving the sale (1031 exchange, divorce, estate, relocation)? That informs how much negotiation room exists.
- Crime grade is D in this area — have there been break-ins, vandalism, or insurance claims at this property in the last 3 years? What carrier currently insures it and at what premium?
- The area grade is low — what's the realistic commute time and amenity access for the typical tenant pool here? Any planned neighborhood developments (good or bad) we should know about?
- What's the average days-on-market for RENTAL listings here right now (not sales)? A rising rental-DOM trend means longer vacancies and softer asking-rent achievability than the comps imply.
- What's the recent tenant-quality profile in this submarket — average credit score on applications, eviction rate, late-payment / NSF rate, and stable-employment percentage? A property-management company in the area should have these aggregated.
- How much new for-sale + rental construction is in the pipeline within 1–3 miles? Heavy new supply typically softens prices + rents 12–24 months out; constrained supply supports both.
Investment metrics
- 1% rule
- 0.75% ✗
- Cap rate
- 5.54%
- Cash-on-cash
- -2.68%
- DSCR
- 0.88
- GRM
- 11.1
CMA / ARV
- ARV (median comp)
- $335,860
- List price
- $295,000
- Delta
- -12.17%
- Verdict
- UNDERPRICED
- Comps
- 8 within 1.0 mi
Show comp detail 2 sales within ~0.75 mi
| Address | Dist | Beds/Ba | Sqft | Sold | Price | $/sf | Match |
|---|---|---|---|---|---|---|---|
| 5943 Gavin Ridge Rd | 0.69mi | 3/2.0 | 1,527 (-6%) | 1mo | $333,000 | $218 | 56 |
| 115 Squire Loop | 0.66mi | 3/2.0 | 1,758 (+8%) | 1mo | $290,000 | $165 | 55 |
Match score weights: distance 35% · size 25% · config 20% · recency 20%. Top-matched comps best support the ARV.
Projected returns pro-forma
-3.0% appreciation · 1.29% rent growth · sell at horizon
- IRR
- -22.6%
- Equity multiple
- 0.23×
- Total profit
- $-63,340
- Equity at exit
- $43,985
- IRR
- -21.6%
- Equity multiple
- -0.03×
- Total profit
- $-85,284
- Equity at exit
- $25,506
Cash invested: $82,600 (down + closing). Projections, not guarantees.
Landlord ↔ Tenant lean methodology
- Overall (STATE)
- 87 Strongly Landlord-Friendly
- State Texas
- 87 Strongly Landlord-Friendly · R+5
- County
- — inherits STATE
- City
- — inherits STATE
ZIP-level market 76513
- Rents YoY
- 1.3%
- Active inventory
- 745
- Price-to-rent
- 11.1×
Monthly cashflow live
- Estimated rent
- $2,217 high interval (Pro) →
- Mortgage (P&I)
- −$1,547
- Tax from tax record
- −$266 /mo · $3,191/yr
- Insurance
- −$123
- HOA
- −$0
- Vacancy / Maint / Mgmt
- −$466
- Net cashflow
- $-185
Break-even live
UW: 25.0% down · 7.5% · 30yr · 1.5% tax · 5.0% vac · 8.0% maint · 8.0% mgmt
Financing live
Cash to close
- Down payment
- $73,750
- Closing costs
- $8,850
- Reserves months
- —
- Total cash needed
- —
Loan-product check · same deal, 3 products live
Conventional
25% down · 7.5% · 30yr
- Down + closing
- —
- Monthly P&I
- —
- Monthly cashflow
- —
- DSCR
- —
- Eligible?
- —
Personal DTI + credit; lowest rate.
DSCR
20% down · 8.5% · 30yr
- Down + closing
- —
- Monthly P&I
- —
- Monthly cashflow
- —
- DSCR
- —
- Eligible?
- —
No personal income docs; deal must DSCR.
Hard money
10% down · 12.0% · 12mo
- Down + closing
- —
- Monthly P&I
- —
- Monthly cashflow
- —
- DSCR
- —
- Eligible?
- —
Short-term bridge; refi at stabilization.
Rent comps 6 comps
| Address | Beds | Baths | Sqft | Rent | $/sqft | DOM | Units | Dist |
|---|---|---|---|---|---|---|---|---|
| 4724 Lakeview Dr Belton, TX | 3.0 | 2.0 | 1672 | $3,400 | $2.03 | 23d | 1 | 0.39mi |
| 3277 Beevers Cir Belton, TX | 3.0 | 2.5 | 1800 | $1,500 | $0.83 | 43d | 1 | 0.52mi |
| 3271 Beevers Cir Belton, TX | 2.0 | 1.0 | 1100 | $1,250 | $1.14 | 13d | 1 | 0.53mi |
| 3225 Tortuga Ct Belton, TX | 3.0 | 2.0 | 1861 | $2,250 | $1.21 | 23d | 1 | 1.09mi |
| 3104 Ingram Cir Belton, TX | 4.0 | 2.0 | 2088 | $2,495 | $1.19 | 43d | 1 | 1.17mi |
| 7255 Woodlake Cir Belton, TX | 4.0 | 3.0 | 1933 | $2,400 | $1.24 | 43d | 1 | 1.43mi |
Listing history 27 events
-
2026-06-18days on market $295,000 Active 219 DOM
-
2026-06-17days on market $295,000 Active 218 DOM
-
2026-06-16days on market $295,000 Active 217 DOM
-
2026-06-15days on market $295,000 Active 216 DOM
-
2026-06-14days on market $295,000 Active 214 DOM
-
2026-06-13days on market $295,000 Active 213 DOM
-
2026-06-09days on market $295,000 Active 210 DOM
-
2026-06-08days on market $295,000 Active 209 DOM
-
2026-06-07days on market $295,000 Active 208 DOM
-
2026-06-05pricedays on market $295,000 Active 205 DOM
-
2026-06-03days on market $310,000 Active 204 DOM
-
2026-06-02days on market $310,000 Active 203 DOM
-
2026-06-01days on market $310,000 Active 202 DOM
-
2026-05-31days on market $310,000 Active 201 DOM
-
2026-05-30days on market $310,000 Active 200 DOM
-
2026-04-30price $310,000 938-char remark
Show marketing remark (938 chars)
Beautifully updated home near Lake Belton! This 3-bedroom, 3-bath home offers flexibility, comfort, and a fantastic location minutes from the lake. Each bedroom includes its own ensuite bathroom giving you great flexibility whether you are making this home your permanent residence or your next investment. The home has been thoughtfully remodeled featuring updated bathrooms, a fully updated kitchen with new appliances and new flooring. The HVAC unit was replaced about 2 years ago providing efficiency and peace of mind. Enjoy partial views of the lake from the living room, from the 2nd bedroom, and from the private deck off of the 1st bedroom. Located just minutes from multiple Belton Lake access points, Miller Springs Nature Center, and downtown Belton shopping and dining. Conviently situated approximately 8 miles from Baylor Scott & White Medical Center and 10 miles from Olin E. Teague Veterans' Medical Center in Temple.
-
2025-11-11$325,000 Active 938-char remark
Show marketing remark (938 chars)
Beautifully updated home near Lake Belton! This 3-bedroom, 3-bath home offers flexibility, comfort, and a fantastic location minutes from the lake. Each bedroom includes its own ensuite bathroom giving you great flexibility whether you are making this home your permanent residence or your next investment. The home has been thoughtfully remodeled featuring updated bathrooms, a fully updated kitchen with new appliances and new flooring. The HVAC unit was replaced about 2 years ago providing efficiency and peace of mind. Enjoy partial views of the lake from the living room, from the 2nd bedroom, and from the private deck off of the 1st bedroom. Located just minutes from multiple Belton Lake access points, Miller Springs Nature Center, and downtown Belton shopping and dining. Conviently situated approximately 8 miles from Baylor Scott & White Medical Center and 10 miles from Olin E. Teague Veterans' Medical Center in Temple.
-
2023-04-24soldstatus
-
2023-03-13status Pending
-
2023-02-22price $219,000
-
2023-02-09$224,000 Active
-
2019-04-04historical
-
2019-04-03soldstatus
-
2019-03-05historical Active Take Backups
-
2019-01-29$179,900 Active
-
2009-11-25soldstatus
-
1985-04-16soldstatus
ⓘ Source: listings_history table (triggers on properties + properties_extension) + one-shot
backfill from property_details.listing_events for pre-trigger history.
Tax reassessment forecast TX · Resets to sale price
- Current annual tax
- $3,191 · $266/mo
- Projected year-2 tax
- $5,398 · $450/mo
- Expected delta
- +$2,207/yr (+$184/mo · 69.2%)
ⓘ Screening estimate from a state-policy table — verify with the county assessor before closing.
Climate risk First Street
- Flood 1/10 Low FEMA zone X (unshaded) · 0% chance over 30 yrs
- Wildfire 5/10 Major
- Heat 7/10 Severe 5 d/yr ≥108°F today · 17 d/yr by 30 yrs out
- Wind 6/10 Major 71% chance of damaging wind over 30 yrs
- Air quality 1/10 Low 0 unhealthy d/yr today · 0 by 30 yrs out
Nearby sold comps map
Loading sold comps map…
Walkable amenities ~0.75 mi
Loading nearby amenities…
Taxation est. · year 1
- Rental income
- $26,602
- − Mortgage interest
- −$16,525
- − Property taxes
- −$3,191
- − Insurance
- −$1,475
- − Repairs & maintenance
- −$2,128
- − Management
- −$2,128
- − Depreciation
- −$8,582
- Taxable loss
- −$7,427
- Est. tax savings @ 24.0%
- +$1,783
- After-tax cash flow
- $-433/yr
For passive investors: Depreciation is non-cash, so a rental often shows a tax loss while cash-flowing — sheltering income. Rental losses are passive: they offset passive income freely, and up to $25,000/yr can offset ordinary (W-2) income if you actively participate and your MAGI is under $100k (phasing out to $0 by $150k); unused losses carry forward. On sale, claimed depreciation is recaptured at up to 25%, and gains may owe capital-gains tax (a 1031 exchange can defer both). Figures are a year-1 estimate at your 24.0% rate — not tax advice; consult a CPA.
Schools (NCES district)
- District
- Belton ISD
- NCES district ID
- 4809860
- Math proficiency
- 39% ▼ -14.00%
- Reading proficiency
- 46% ▼ -4.00%
- Median HH income
- $61,239
- Composite
- 37.62/100
- National rank
- #4378
- State rank
- #285 of 826 in TX
Livability — Temple
- Score
- 75/100
- State rank
- #122
- US rank
- #3814
Category grades
Schools grade is shown separately in the Schools card above.
Census & demographics
- County
- Bell County · 345,090 people
- City population
- 96,587
- Metro
- Killeen-Temple, TX
- Population (ZIP)
- 45,928
- Household income
- $80,661
- Rent vs Own
- Severe rent burden
- 1198.0
Population outlook (Bell County) Hauer SSP2
- Today (2025)
- 371,114 people
- By 2030
- 389,104 · +4.8%
- By 2040
- 420,592 · +13.3%
- By 2050
- 447,779 · +20.7%
- By 2075
- 499,130 · +34.5%
- By 2100
- 505,680 · +36.3%
Race, ethnicity, and origin ACS 2023
- Neighborhood character
- Majority White (62%)
- Race & ethnicity
- White 62% Hispanic / Latino 24% Two or more races 14% Black 6% Asian 2%
- Hispanic origin (detail)
- Mexican 19% Puerto Rican 1%
- Common ancestry
- Italian 3% Slovak 2% Lithuanian 2%
- Foreign-born
- 9% · Canada, Vietnam
- Languages at home
- 83% English-only · Spanish 13% Korean 1% Other Indo-European 1%
Political lean MEDSL · Bell
- 2024 margin
- R (+16.2) · D 41.3% · R 57.6% · Other 1.1%
- 2008→2024 swing
- -6.5pp toward R · 2008: -9.8pp · 2024: -16.2pp
- All cycles
- 2024: R+16.2 2020: R+8.5 2016: R+15.1 2012: R+16.4 2008: R+9.8
Not yet ingested
- Civics
- —
Market trends
- HPI YoY
- ▼ -105.10%
- Current HPI
- 183.6715
- Rent YoY
- ▲ 1.29%
- Metro
- Killeen-Temple, TX
- State GDP YoY
- ▲ 3.95%
- F500 in state
- 110
Industry mix (Fortune 500 HQ in TX)
| Industry | F500 HQs | Revenue |
|---|---|---|
| Energy | 16 | $1,198B |
|
||
| Technology | 5 | $198B |
|
||
| Engineering / Construction | 4 | $72B |
|
||
| Energy Services | 3 | $60B |
|
||
| Utilities | 3 | $41B |
|
||
| Healthcare | 2 | $330B |
|
||
Price history
+72.3% since first listed12 events — show timeline
- 2026-04-30 Price Changed $310,000 CTXMLS
- 2025-11-11 Listed $325,000 CTXMLS
- 2023-04-24 Sold (Public Records) — Public Records
- 2023-03-13 Pending — CTXMLS
- 2023-02-22 Price Changed $219,000 CTXMLS
- 2023-02-09 Listed $224,000 CTXMLS
- 2019-04-04 Listing Removed — CTXMLS
- 2019-04-03 Sold (Public Records) — Public Records
- 2019-03-05 Contingent — CTXMLS
- 2019-01-29 Listed $179,900 CTXMLS
- 2009-11-25 Sold (Public Records) — Public Records
- 1985-04-16 Sold (Public Records) — Public Records
Property tax history
+6.6%/yrLatest (2025): $3,191 · -0.8% YoY. Source: county tax records.
Cash-flow waterfall
monthlySold comps — $/sqft
last 12 mo · ≤1 miLoading sold comps…