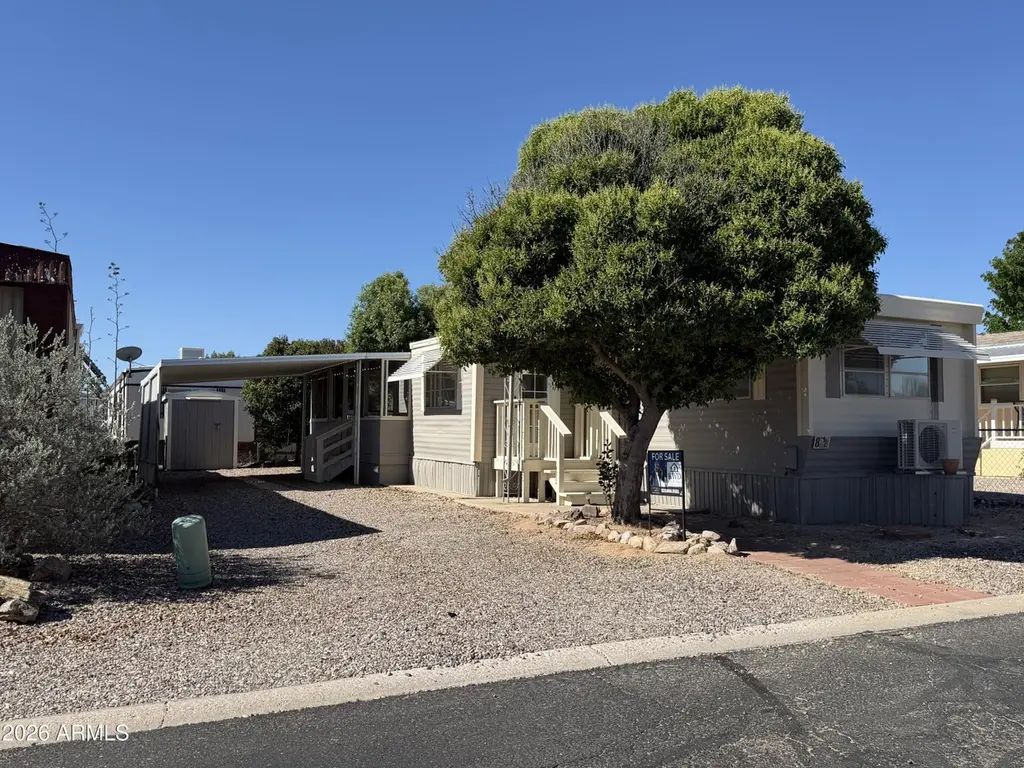
1110 S Highway 80 -- #8 · Benson, AZ
Flood risk 1/10 · Minimal
- FEMA flood zone
- X (unshaded)
- Chance of flooding over 30 yrs
- 0.0%
- Est. flood insurance / yr
- $507 – $1,088
Fire risk 7/10 · Major
- Est. fire insurance / yr
- $610 – $1,132
Heat risk 6/10 · Moderate
- Hot days now (above 101°F)
- 7 days/yr
- Hot days in 30 yrs
- 21 days/yr
Wind risk 1/10 · Minimal
- Chance of severe wind over 30 yrs
- —
Air-quality risk 1/10 · Minimal
- Unhealthy air days now
- 0 days/yr
- Unhealthy air days in 30 yrs
- 0 days/yr
Risk factors via First Street. Map © Google.
Why this score? — see what drove the B grade
The composite is a weighted blend of 9 inputs, each scored 0–100. Each bar is that input's sub-score; the figure is the points it added to the 100-point composite (weight × sub-score).
- Cash flow +30.0/30.0
- 1% rule +10.0/10.0
- DSCR +10.0/10.0
- ARV discount +7.5/15.0
- Condition / age +3.8/5.0
- Schools +3.6/10.0
- Livability +3.6/5.0
- Rent growth +2.5/5.0
- Appreciation +0.0/10.0
$34,900
🖨 Deal sheet 📄 Offer letter ✓ Due diligence
Listing remarks
Enjoy affordable Arizona living in the welcoming 55+ community of San Pedro RV Resort! This refreshed and move-in ready 1-bedroom home offers comfort, convenience, and resort-style amenities. Recent updates include freshly painted exterior and living room, repaired exterior steps, and a recently recoated roof. Features include two efficient mini-split heating and cooling units, an enclosed Arizona room, stack washer and dryer, covered carport, and storage shed. Residents enjoy pickleball, bocce ball, shuffleboard, horseshoes, dog park, two clubhouses, indoor and outdoor pools, and an indoor spa. Conveniently located near shopping and dining. Home only; land is leased. Lot rent is $492/month
Key facts
- Recoated roof
- Covered carport
- Arizona room
Tags
Property features AI
Finance
- Other: Zoned Benson - R3; Directions: Take HWY 80 towards Tombstone, turn right into San Pedro Resort; at the T turn right — home is on the left, lot 8.
- HOA & community: Community pool and spa; Clubhouse; Laundry facility; Pickleball courts; Paved streets maintained by HOA; Association covers common area maintenance, sewer, and street maintenance
Exterior
- Parking: Covered carport (1 space)
- Utilities: Public water; Sewer connected
- Home design: Mobile home; Single level; Faces north
- Construction: Metal siding; Wood frame construction; Built-up roof; Approximately 598 square feet
- Exterior features: Covered, screened patio and deck; Shed(s); Chain link and shared fencing; Decorative gravel landscaping; East/West exposure; Paved road access; Has spa
Interior
- Kitchen: Refrigerator; Gas range; Exhaust fan
- Flooring: Carpet; Vinyl; Engineered wood
- Bathrooms: 1 full bathroom
- Heating & cooling: Mini-split heating
- Interior features: Exhaust fan; Refrigerator; Gas range
Neighborhood map
What this means for you Summary
Snapshot
- This is a 1-bed/1.0-bath manufactured listed at $35k. Condition is rated good.
Deal economics
- At list price, monthly cash flow is $351 ($4k/yr) — positive.
- The deal already cash-flows at list — no discount required.
- Meets the 1% rule at list price ($750 rent vs $35k).
- Cap rate 18.4% vs local median 4.5% in Benson — top-decile yield for the area; either an underpriced asset or a hidden risk that comps aren't pricing in. Stress-test before assuming the spread holds.
Location & tenants
- Location reads 71/100 on livability (#34 in AZ) — a middle-class / working-renter tenant base. Strengths: cost of living A+, housing A+, health & safety A; Watch: commute D, employment D, amenities F.
- St David Unified District (4173) (rural): math 40% / reading 40% proficiency, ranked #200 of 501 in AZ (top 40%) — families likely to look elsewhere, expect single-tenant / working-renter base with shorter leases.
- Market conditions: 263 active listings in the ZIP; 1 comparable units currently listed for rent nearby; 437 units permitted in Cochise County in 2024 (6 in 5+ unit buildings).
Forward outlook
- Local home prices are declining (-3.0%/yr); year-one equity from $241 of loan paydown is wiped out by about $1k of value loss. Plan a longer hold.
- Cochise County population projected at -30% by 2050 — secular population decline; favor cash flow + early exit over multi-decade hold.
- At projected returns (-3.0% appreciation + 3.0% rent growth), your $10k cash investment doubles in ~3 years — after that, you're playing with house money.
Negotiation context
- Only 8 days on market — expect competitive offers; lowballing is unlikely to land.
Risks & watch-outs
- Climate carrying-cost: major wildfire risk; extreme-heat days projected 7→21/yr by 2055 (HVAC capex compounding) — expect insurance premiums to compound above CPI over the hold.
Questions for the listing agent
- Is there a deadline driving the sale (1031 exchange, divorce, estate, relocation)? That informs how much negotiation room exists.
- Schools are B-rated — typically a magnet for longer-tenancy family renters. What's the average tenant stay here, and is there a school-zone premium baked into asking?
- What's the average days-on-market for RENTAL listings here right now (not sales)? A rising rental-DOM trend means longer vacancies and softer asking-rent achievability than the comps imply.
- What's the recent tenant-quality profile in this submarket — average credit score on applications, eviction rate, late-payment / NSF rate, and stable-employment percentage? A property-management company in the area should have these aggregated.
- How much new for-sale + rental construction is in the pipeline within 1–3 miles? Heavy new supply typically softens prices + rents 12–24 months out; constrained supply supports both.
Investment metrics
- 1% rule
- 2.15% ✓
- Cap rate
- 18.37%
- Cash-on-cash
- 43.14%
- DSCR
- 2.92
- GRM
- 3.9
CMA / ARV
No comps found within radius.
Projected returns pro-forma
-3.0% appreciation · 3.0% rent growth · sell at horizon
- IRR
- 40.0%
- Equity multiple
- 2.71×
- Total profit
- $16,731
- Equity at exit
- $5,204
- IRR
- 46.3%
- Equity multiple
- 5.44×
- Total profit
- $43,427
- Equity at exit
- $3,018
Cash invested: $9,772 (down + closing). Projections, not guarantees.
Landlord ↔ Tenant lean methodology
- Overall (STATE)
- 87 Strongly Landlord-Friendly
- State Arizona
- 87 Strongly Landlord-Friendly · R+3
- County
- — inherits STATE
- City
- — inherits STATE
ZIP-level market 85602
- Home prices YoY
- -23.4%
- Active inventory
- 263
- Price-to-rent
- 3.9×
Monthly cashflow live
- Estimated rent
- $750 medium interval (Pro) →
- Mortgage (P&I)
- −$183
- Tax est. 1.5%
- −$44 /mo · $524/yr
- Insurance
- −$15
- HOA
- −$0
- Vacancy / Maint / Mgmt
- −$158
- Net cashflow
- $351
Break-even live
UW: 25.0% down · 7.5% · 30yr · 1.5% tax · 5.0% vac · 8.0% maint · 8.0% mgmt
Financing live
Cash to close
- Down payment
- $8,725
- Closing costs
- $1,047
- Reserves months
- —
- Total cash needed
- —
Loan-product check · same deal, 3 products live
Conventional
25% down · 7.5% · 30yr
- Down + closing
- —
- Monthly P&I
- —
- Monthly cashflow
- —
- DSCR
- —
- Eligible?
- —
Personal DTI + credit; lowest rate.
DSCR
20% down · 8.5% · 30yr
- Down + closing
- —
- Monthly P&I
- —
- Monthly cashflow
- —
- DSCR
- —
- Eligible?
- —
No personal income docs; deal must DSCR.
Hard money
10% down · 12.0% · 12mo
- Down + closing
- —
- Monthly P&I
- —
- Monthly cashflow
- —
- DSCR
- —
- Eligible?
- —
Short-term bridge; refi at stabilization.
Rent comps 1 comps
| Address | Beds | Baths | Sqft | Rent | $/sqft | DOM | Units | Dist |
|---|---|---|---|---|---|---|---|---|
| 172 N Shady Ln Unit 1 Benson, AZ | 2.0 | 1.0 | 675 | $750 | $1.11 | 11d | 1 | 1.46mi |
Listing history 19 events
-
2026-06-19days on market $34,900 Active 8 DOM
-
2026-06-18days on market $34,900 Active 7 DOM
-
2026-06-17days on market $34,900 Active 6 DOM
-
2026-06-16days on market $34,900 Active 5 DOM
-
2026-06-15days on market $34,900 Active 4 DOM
-
2026-06-14days on market $34,900 Active 2 DOM
-
2026-06-12days on market $34,900 Active 1 DOM
-
2026-06-09days on market $34,900 Active 293 DOM
-
2026-06-08days on market $34,900 Active 292 DOM
-
2026-06-07days on market $34,900 Active 291 DOM
-
2026-06-07days on market $34,900 Active 290 DOM
-
2026-06-04days on market $34,900 Active 287 DOM
-
2026-06-02days on market $34,900 Active 286 DOM
-
2026-06-01days on market $34,900 Active 285 DOM
-
2026-05-31days on market $34,900 Active 284 DOM
-
2026-05-31days on market $34,900 Active 283 DOM
-
2026-01-20price $34,900
-
2025-11-11price $38,000
-
2025-08-20$42,000 Active
ⓘ Source: listings_history table (triggers on properties + properties_extension) + one-shot
backfill from property_details.listing_events for pre-trigger history.
Climate risk First Street
- Flood 1/10 Low FEMA zone X (unshaded) · 0% chance over 30 yrs
- Wildfire 7/10 Severe
- Heat 6/10 Major 7 d/yr ≥101°F today · 21 d/yr by 30 yrs out
- Wind 1/10 Low
- Air quality 1/10 Low 0 unhealthy d/yr today · 0 by 30 yrs out
Nearby sold comps map
Loading sold comps map…
Walkable amenities ~0.75 mi
Loading nearby amenities…
Taxation est. · year 1
- Rental income
- $9,000
- − Mortgage interest
- −$1,955
- − Property taxes
- −$524
- − Insurance
- −$174
- − Repairs & maintenance
- −$720
- − Management
- −$720
- − Depreciation
- −$1,015
- Taxable income
- $3,892
- Est. tax owed @ 24.0%
- −$934
- After-tax cash flow
- $3,282/yr
For passive investors: Depreciation is non-cash, so a rental often shows a tax loss while cash-flowing — sheltering income. Rental losses are passive: they offset passive income freely, and up to $25,000/yr can offset ordinary (W-2) income if you actively participate and your MAGI is under $100k (phasing out to $0 by $150k); unused losses carry forward. On sale, claimed depreciation is recaptured at up to 25%, and gains may owe capital-gains tax (a 1031 exchange can defer both). Figures are a year-1 estimate at your 24.0% rate — not tax advice; consult a CPA.
Condition & rehab AI · 12 photos
This home is in good condition with recent updates and a good condition score. It has a good roof and exterior siding, but the landscaping and flooring need some attention. Upgrading the exterior, flooring, and appliances can significantly increase its value.
Value-add opportunities
- Both Paint the exterior siding — Painting the exterior siding can improve the curb appeal and increase the home's value.
- Both Replace the carpet in the living room — Replacing the carpet can improve the living room's appearance and increase the home's value.
- Both Upgrade the kitchen appliances — Upgrading the kitchen appliances can improve the home's appeal and increase its value.
- Both Upgrade the bathroom fixtures — Upgrading the bathroom fixtures can improve the home's appeal and increase its value.
- Both Install new flooring in the bathrooms — Installing new flooring in the bathrooms can improve the home's appeal and increase its value.
- Both Upgrade the HVAC system — Upgrading the HVAC system can improve the home's comfort and increase its value.
- Both Improve the landscaping and curb appeal — Improving the landscaping and curb appeal can increase the home's value and attract more potential buyers/renters.
Renovation cost estimate screening
Value-add ROI direction
- Both Paint the exterior siding — Painting the exterior siding can improve the curb appeal and increase the home's value. ↑
- Both Replace the carpet in the living room — Replacing the carpet can improve the living room's appearance and increase the home's value. ↑
- Both Upgrade the kitchen appliances — Upgrading the kitchen appliances can improve the home's appeal and increase its value. ↑
- Both Upgrade the bathroom fixtures — Upgrading the bathroom fixtures can improve the home's appeal and increase its value. ↑
- Both Install new flooring in the bathrooms — Installing new flooring in the bathrooms can improve the home's appeal and increase its value. ↑
- Both Upgrade the HVAC system — Upgrading the HVAC system can improve the home's comfort and increase its value. ↑
- Both Improve the landscaping and curb appeal — Improving the landscaping and curb appeal can increase the home's value and attract more potential buyers/renters. ↑
ⓘ Cost ranges are severity-bucket heuristics (US national rule-of-thumb). Get contractor quotes + a written scope before underwriting a rehab budget.
Schools (NCES district)
- District
- St David Unified District (4173)
- NCES district ID
- 0408020
- Math proficiency
- 40% ▬ 0.00%
- Reading proficiency
- 40% ▬ 0.00%
- Median HH income
- $41,269
- Composite
- 36.09/100
- National rank
- #9494
- State rank
- #200 of 501 in AZ
Livability — Benson
- Score
- 71/100
- State rank
- #34
- US rank
- #6661
Category grades
Schools grade is shown separately in the Schools card above.
Census & demographics
- Census place
- Benson, AZ
- Population (ZIP)
- 9,860
Population outlook (Cochise County) Hauer SSP2
- Today (2025)
- 113,402 people
- By 2030
- 106,197 · -6.4%
- By 2040
- 92,166 · -18.7%
- By 2050
- 79,805 · -29.6%
- By 2075
- 56,831 · -49.9%
- By 2100
- 35,103 · -69.0%
Race, ethnicity, and origin ACS 2023
- Neighborhood character
- Predominantly White (78%)
- Race & ethnicity
- White 78% Hispanic / Latino 15% Two or more races 13%
- Hispanic origin (detail)
- Mexican 14%
- Common ancestry
- Portuguese 4% Slovak 3% Italian 2%
- Foreign-born
- 3% · Canada
- Languages at home
- 93% English-only · Spanish 5% German/W. Germanic 1%
Political lean MEDSL · Cochise
- 2024 margin
- Strong R (+23.1) · D 37.8% · R 61.0% · Other 1.2%
- 2008→2024 swing
- -2.5pp toward R · 2008: -20.7pp · 2024: -23.1pp
- All cycles
- 2024: R+23.1 2020: R+19.6 2016: R+22.6 2012: R+24.0 2008: R+20.7
Not yet ingested
- Civics
- —
Market trends
- HPI YoY
- ▼ -55.74%
- Current HPI
- 182.9079
- Rent YoY
- —
- Metro
- —
- State GDP YoY
- ▲ 4.54%
- F500 in state
- 20
Industry mix (Fortune 500 HQ in AZ)
| Industry | F500 HQs | Revenue |
|---|---|---|
| Technology | 2 | $13B |
|
||
| Mining / Metals | 1 | $23B |
|
||
| Environmental Services | 1 | $16B |
|
||
| Metals / Steel | 1 | $14B |
|
||
| Technology Distribution | 1 | $9B |
|
||
| Homebuilding | 1 | $8B |
|
||
Price history
-16.9% since first listed3 events — show timeline
- 2026-01-20 Price Changed $34,900 MLSSAZ
- 2025-11-11 Price Changed $38,000 MLSSAZ
- 2025-08-20 Listed $42,000 MLSSAZ
Cash-flow waterfall
monthlySold comps — $/sqft
last 12 mo · ≤1 miLoading sold comps…