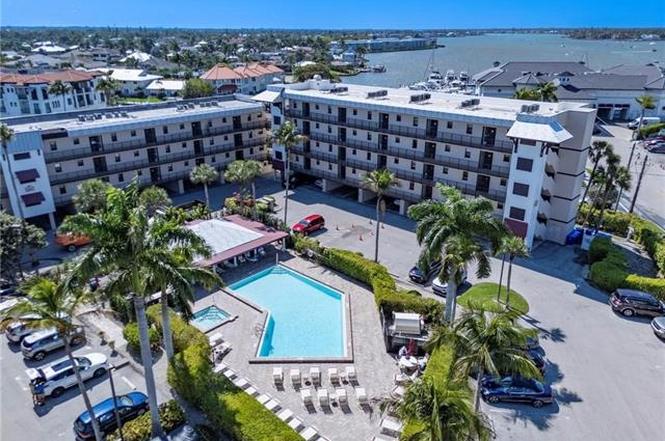
803 River Point Dr Unit 107B · Naples, FL
Flood risk 9/10 · Severe
- FEMA flood zone
- AE
- Chance of flooding over 30 yrs
- 0.99%
- Est. flood insurance / yr
- $1,737 – $8,500
Fire risk 3/10 · Minor
- Est. fire insurance / yr
- $947 – $1,759
Heat risk 10/10 · Severe
- Hot days now (above 107°F)
- 7 days/yr
- Hot days in 30 yrs
- 26 days/yr
Wind risk 10/10 · Severe
- Chance of severe wind over 30 yrs
- 99.0%
Air-quality risk 3/10 · Minor
- Unhealthy air days now
- 3 days/yr
- Unhealthy air days in 30 yrs
- 3 days/yr
Risk factors via First Street. Map © Google.
Why this score? — see what drove the D grade
The composite is a weighted blend of 9 inputs, each scored 0–100. Each bar is that input's sub-score; the figure is the points it added to the 100-point composite (weight × sub-score).
- ARV discount +7.5/15.0
- Cash flow +7.4/30.0
- Appreciation +7.0/10.0
- Schools +5.0/10.0
- Rent growth +4.7/5.0
- Livability +4.0/5.0
- 1% rule +3.3/10.0
- Condition / age +2.5/5.0
- DSCR +1.5/10.0
$625,100
🖨 Deal sheet (PDF) 📄 Offer letter ✓ Due diligence
Listing remarks
Waterfront Living at Its Finest! This beautifully renovated, turnkey-furnished 2-bedroom plus DEN, 2-bath , one of the largest model residence offers breathtaking Gordon River and marina views in the heart of downtown Naples. Featuring brand-new impact-resistant windows and doors, designer-updated bathrooms, luxury vinyl flooring, plantation shutters, and a stylish kitchen with quartz countertops, stainless steel appliances, and ample cabinetry. This move-in-ready home offers the perfect combination of comfort, style, and peace of mind. Enjoy an unbeatable location just moments from 5th Avenue South, Bayfront, Tin City, world-class dining, shopping, and Gulf beaches. With the assessment pai
Key facts
- Waterfront living
- Marina views
- Gordon river views
Tags
Property features AI
Finance
- Other: Unit is one of 89 units in complex and one of 24 units in the building; There are 2 total floors in the building; Unit number 107 in section 3, subdivision 018100; Paved public road access; Restrictions: No commercial
- HOA & community: Mandatory HOA; Monthly HOA fee; HOA maintenance covers cable, insurance, internet/WiFi, exterior pest control, reserves and water; Condo management; Community amenities include community pool, community spa/hot tub and common laundry; Non-gated community; Total annual recurring fees listed
Exterior
- Parking: 2 assigned covered parking spaces; 1 attached carport space
- Utilities: Central water; Central sewer; Cable available
- Home design: Residential property; Mid-rise building (4–7 stories); 2-story floor plan; Rear exposure faces southeast
- Construction: Concrete block construction; Stucco exterior finish; Shingle roof; Year built 1985; Built as part of BEAUMER development
- Exterior features: Automatic sprinkler system; Impact resistant windows; Sliding windows; Below-ground private pool; Gulf, water and water feature views; Gulf access with no bridges; Central irrigation
Interior
- Kitchen: Pantry; Dishwasher; Disposal; Microwave; Range; Refrigerator; Refrigerator/ice maker
- Bedrooms: 2 bedrooms plus den; Split bedroom layout
- Flooring: Vinyl
- Bathrooms: 2 full bathrooms; Master bath with tub only
- Heating & cooling: Central electric heat (see remarks); Central electric cooling
- Interior features: Pantry; Smoke detectors; Volume ceiling; Common elevator; Turnkey furnished; Den (study); Florida room; Screened balcony; Screened lanai/porch
- Laundry & utility: Common laundry
Neighborhood map
What this means for you Summary
Snapshot
- This is a 2-bed/2.0-bath condo listed at $625k.
Deal economics
- At list price, monthly cash flow is $-1k ($-15k/yr) — negative.
- To cash-flow at today's rent, offer at most $407k (35.0% below list).
- To meet the 1% rule (rent ≥ 1% of price), the offer needs to be $520k (16.8% below list).
- Recommended offer: $407k (35.0% below list) — sets the bar for cash-flow.
Location & tenants
- Location reads 80/100 on livability (#126 in FL, #1,903 nationally) — a professional / high-income tenant draw. Strengths: crime A+, amenities A+, employment A+; Watch: commute D+, cost of living F.
- Market conditions: Rents rising fast (+8.8%/yr); 616 active listings in the ZIP; 40 comparable units currently listed for rent nearby; rentals at typical pace (median 25d on market — plan ~3-4 weeks tenant-placement turnaround); high-income renter base; 3,520 units permitted in Collier County in 2024 (959 in 5+ unit buildings).
- At $5,198/mo this rent would consume 48% of the median local household income ($131k/yr) (locally 333% of renters already pay >50% of income on rent) — very limited rent-growth headroom before tenants either downsize or default.
Forward outlook
- In year one you build about $30k of equity ($4k loan paydown + $26k appreciation (4.1% local appreciation)).
- Collier County population projected at +30% by 2050 — long-run rental-demand tailwind backs the buy-and-hold thesis.
- By year 2, paydown + projected appreciation supports a ~$48k cash-out refi (75% LTV) — recoverable capital for the next deal without selling this one.
Negotiation context
- Only 9 days on market — expect competitive offers; lowballing is unlikely to land.
- 5 sale attempts since 7y ago with the ask held roughly flat each time — persistent listings suggest the price (not the market) is what's stuck; bring a comps-based counter.
- Current owner paid $390k; list at $625k implies a 60% gain — meaningful room to come down on a strong offer.
Risks & watch-outs
- Watch-outs: flood insurance adds $427/mo.
- Climate carrying-cost: in FEMA flood zone AE (mandatory federal flood insurance); severe wind risk, 99% chance of damaging wind over 30y; extreme-heat days projected 7→26/yr by 2055 (HVAC capex compounding) — expect insurance premiums to compound above CPI over the hold.
Questions for the listing agent
- What do current leases actually rent for vs. the listed asking? Can we see a recent rent roll and the last 12 months of T-12 income?
- What's the actual annual flood-insurance premium (NFIP or private), and is the property in a SFHA with mandatory coverage?
- What does the HOA fee cover, when was the last increase, and are there any pending special assessments or reserve-fund shortfalls?
- Any open or pending special assessments — roof, HVAC, plumbing, elevator, façade? What's the per-unit balance and payoff schedule, and is the seller paying it off at close or rolling it to the buyer?
- Is there a deadline driving the sale (1031 exchange, divorce, estate, relocation)? That informs how much negotiation room exists.
- Schools are B-rated — typically a magnet for longer-tenancy family renters. What's the average tenant stay here, and is there a school-zone premium baked into asking?
- The area grade is low — what's the realistic commute time and amenity access for the typical tenant pool here? Any planned neighborhood developments (good or bad) we should know about?
- What's the average days-on-market for RENTAL listings here right now (not sales)? A rising rental-DOM trend means longer vacancies and softer asking-rent achievability than the comps imply.
- What's the recent tenant-quality profile in this submarket — average credit score on applications, eviction rate, late-payment / NSF rate, and stable-employment percentage? A property-management company in the area should have these aggregated.
- How much new apartment / multifamily construction is in the pipeline within 1–3 miles? Heavy new supply (>2% of stock underway) typically softens rents 12–24 months out; light construction supports rent growth.
Investment metrics
- 1% rule
- 0.83% ✗
- Cap rate
- 4.74%
- Cash-on-cash
- -5.56%
- DSCR
- 0.75
- GRM
- 10.0
CMA / ARV
No comps found within radius.
Projected returns pro-forma
4.08% appreciation · 8.0% rent growth · sell at horizon
- IRR
- 5.6%
- Equity multiple
- 1.35×
- Total profit
- $61,260
- Equity at exit
- $319,990
- IRR
- 10.6%
- Equity multiple
- 2.93×
- Total profit
- $337,614
- Equity at exit
- $525,822
Cash invested: $175,028 (down + closing). Projections, not guarantees.
Landlord ↔ Tenant lean methodology
- Overall (STATE)
- 87 Strongly Landlord-Friendly
- State Florida
- 87 Strongly Landlord-Friendly · R+3
- County
- — inherits STATE
- City
- — inherits STATE
ZIP-level market 34102
- Home prices YoY
- 1.3%
- Rents YoY
- 8.8%
- Active inventory
- 616
- Price-to-rent
- 10.0×
Monthly cashflow live
- Estimated rent
- $5,198 medium interval (Pro) →
- Mortgage (P&I)
- −$3,278
- Tax from tax record
- −$364 /mo · $4,365/yr
- Insurance
- −$260
- Flood insurance flood zone
- −$427 /mo · $5,118/yr
- HOA
- −$1,015
- Vacancy / Maint / Mgmt
- −$1,092
- Net cashflow
- $-1,237
Break-even live
Sensitivity live
| Price | -10% $-883 | -5% $-1,060 | +0% $-1,237 | +5% $-1,414 | +10% $-1,591 |
|---|---|---|---|---|---|
| Rent | -10% $-1,648 | -5% $-1,443 | +0% $-1,237 | +5% $-1,032 | +10% $-827 |
| Rate | -1.0pp $-922 | -0.5pp $-1,078 | base $-1,237 | +0.5pp $-1,399 | +1.0pp $-1,564 |
UW: 25.0% down · 7.5% · 30yr · 1.5% tax · 5.0% vac · 8.0% maint · 8.0% mgmt
Financing live
Cash to close
- Down payment
- $156,275
- Closing costs
- $18,753
- Reserves months
- —
- Total cash needed
- —
Loan-product check · same deal, 3 products live
Conventional
25% down · 7.5% · 30yr
- Down + closing
- —
- Monthly P&I
- —
- Monthly cashflow
- —
- DSCR
- —
- Eligible?
- —
Personal DTI + credit; lowest rate.
DSCR
20% down · 8.5% · 30yr
- Down + closing
- —
- Monthly P&I
- —
- Monthly cashflow
- —
- DSCR
- —
- Eligible?
- —
No personal income docs; deal must DSCR.
Hard money
10% down · 12.0% · 12mo
- Down + closing
- —
- Monthly P&I
- —
- Monthly cashflow
- —
- DSCR
- —
- Eligible?
- —
Short-term bridge; refi at stabilization.
Rent comps 40 comps
| Address | Beds | Baths | Sqft | Rent | $/sqft | DOM | Units | Dist |
|---|---|---|---|---|---|---|---|---|
| 1395 Curlew Ave Unit 4-3 Naples, FL | 2.0 | 2.0 | 975 | $7,000 | $7.18 | 24d | 1 | 0.10mi |
| 1435 Curlew Ave #1 Naples, FL | 2.0 | 2.0 | 975 | $2,850 | $2.92 | 22d | 1 | 0.13mi |
| 1435 Curlew Ave #1 Naples, FL | 2.0 | 2.0 | 975 | $2,850 | $2.92 | 24d | 1 | 0.13mi |
| 1501 Curlew Ave Naples, FL | 2.0 | 1.0 | 1180 | $2,000 | $1.69 | 24d | 1 | 0.17mi |
| 1100 8th Ave S Naples, FL | 2.0 | 2.0 | 1218 | $9,000 | $7.39 | 15d | 5 | 0.23mi |
| 1353 Pelican Ave Naples, FL | 2.0 | 2.0 | 1203 | $8,500 | $7.07 | 24d | 1 | 0.25mi |
| 1600 Curlew Ave Naples, FL | 3.0 | 2.0 | 1817 | $20,000 | $11.01 | 24d | 1 | 0.27mi |
| 1589 Osprey Ave Naples, FL | 3.0 | 2.0 | 1868 | $3,950 | $2.11 | 24d | 1 | 0.28mi |
| 1589 Osprey Ave Naples, FL | 3.0 | 2.0 | 1868 | $3,750 | $2.01 | 15d | 1 | 0.28mi |
| 451 Bayfront Pl Naples, FL | 1.0–2.0 | 1.5–2.0 | 1421 | $11,000 | $7.74 | 24d | 2 | 0.32mi |
| 1666 Osprey Ave #203 Naples, FL | 2.0 | 2.0 | 1200 | $7,000 | $5.83 | 24d | 1 | 0.32mi |
| 1120 Little Neck Ct Unit E40 Naples, FL | 3.0 | 2.0 | 1400 | $2,999 | $2.14 | 24d | 1 | 0.32mi |
| 450 Bayfront Pl Naples, FL | 1.0–3.0 | 1.0–2.5 | 1324 | $8,750 | $6.61 | 24d | 6 | 0.33mi |
| 410 Bayfront Pl Naples, FL | 1.0–3.0 | 1.0–2.0 | 1242 | $7,875 | $6.34 | 24d | 6 | 0.36mi |
| 307 Goodlette-Frank Rd S Unit B506 Naples, FL | 2.0 | 2.0 | 1166 | $6,800 | $5.83 | 24d | 1 | 0.36mi |
| 1165 Clam Ct #7 Naples, FL | 2.0 | 2.5 | 1449 | $2,900 | $2.00 | 24d | 1 | 0.36mi |
| 900 8th Ave S #105 Naples, FL | 2.0 | 2.0 | 1142 | $5,000 | $4.38 | 24d | 1 | 0.37mi |
| 401 Bayfront Pl Naples, FL | 2.0 | 2.0 | 1367 | $9,000 | $6.58 | 24d | 3 | 0.37mi |
| 985 Sandpiper St Unit 1I-204 Naples, FL | 3.0 | 2.0 | 1769 | $4,850 | $2.74 | 24d | 1 | 0.38mi |
| 1200 Cherrystone Ct Unit A203 Naples, FL | 2.0 | 2.0 | 1276 | $4,950 | $3.88 | 24d | 1 | 0.39mi |
| 1495 Blue Point Ave Unit C Naples, FL | 2.0 | 2.5 | 1529 | $12,000 | $7.85 | 24d | 1 | 0.40mi |
| 1186 Cherrystone Ct Naples, FL | 2.0 | 2.0 | 1163 | $1,995 | $1.72 | 24d | 1 | 0.41mi |
| 1400 Blue Point Ave #104 Naples, FL | 2.0 | 2.0 | 1550 | $2,900 | $1.87 | 24d | 1 | 0.42mi |
| 1555 Blue Point Ave Unit 3 Naples, FL | 2.0 | 2.0 | 1025 | $1,745 | $1.70 | 15d | 1 | 0.43mi |
| 1030 3rd Ave S Naples, FL | 2.0–3.0 | 2.0–3.5 | 2101 | $5,750 | $2.74 | 24d | 4 | 0.46mi |
| 1155 Sandpiper St Naples, FL | 2.0 | 2.0 | 1062 | $4,050 | $3.81 | 24d | 2 | 0.47mi |
| 1155 Sandpiper St Naples, FL | 2.0 | 2.0 | 1062 | $3,950 | $3.72 | 22d | 3 | 0.47mi |
| 1950 Mayfair ST Unit 923 Naples, FL | 2.0 | 2.0 | 1142 | $4,490 | $3.93 | 15d | 1 | 0.48mi |
| 1950 Mayfair ST Unit 901 Naples, FL | 2.0 | 2.0 | 1025 | $4,560 | $4.45 | 15d | 1 | 0.48mi |
| 1950 Mayfair ST Unit 1027 Naples, FL | 1.0 | 1.0 | 888 | $3,525 | $3.97 | 15d | 1 | 0.48mi |
| 1950 Mayfair ST Unit 818 Naples, FL | 2.0 | 2.0 | 1142 | $4,415 | $3.87 | 15d | 1 | 0.48mi |
| 1501 Chesapeake Ave Unit 1296210P Naples, FL | 2.0 | 2.0 | 1377 | $4,110 | $2.98 | 15d | 1 | 0.48mi |
| 802 10th Ave S #802 Naples, FL | 2.0 | 2.0 | 1480 | $10,000 | $6.76 | 24d | 1 | 0.48mi |
| 1035 3rd Ave S Naples, FL | 2.0 | 2.0 | 1268 | $8,388 | $6.61 | 22d | 2 | 0.50mi |
| 1035 3rd Ave S Naples, FL | 2.0 | 2.0 | 1268 | $8,538 | $6.73 | 24d | 2 | 0.50mi |
| 1376 Chesapeake Ave #2 Naples, FL | 2.0 | 2.0 | 1218 | $2,300 | $1.89 | 24d | 1 | 0.50mi |
| 1135 3rd Ave S Naples, FL | 2.0 | 2.0–2.5 | 1638 | $15,750 | $9.62 | 24d | 2 | 0.50mi |
| 1135 3rd Ave S Naples, FL | 2.0 | 2.0–2.5 | 1679 | $11,500 | $6.85 | 22d | 3 | 0.50mi |
| 1535 Chesapeake Ave Unit A2 Naples, FL | 2.0 | 2.0 | 1080 | $2,000 | $1.85 | 24d | 1 | 0.50mi |
| 964 8th St S Unit B-2 Naples, FL | 3.0 | 2.0 | 1707 | $10,500 | $6.15 | 24d | 1 | 0.50mi |
HOA detail condo
- Monthly dues
- $1,015 · $12,180/yr
- Likely covers
- water
- Assessments
- None detected in remarks — confirm with the listing agent.
Listing history 7 events
-
2026-06-21days on market $625,100 Active 9 DOM
-
2026-06-18days on market $625,100 Active 6 DOM
-
2026-06-17days on market $625,100 Active 5 DOM
-
2026-06-16days on market $625,100 Active 4 DOM
-
2026-06-15days on market $625,100 Active 3 DOM
-
2026-06-14remarks 699-char remark
-
2026-06-14$625,100 Active 1 DOM
ⓘ Source: listings_history table (triggers on properties + properties_extension) + one-shot
backfill from property_details.listing_events for pre-trigger history.
Tax reassessment forecast FL · Resets to sale price
- Current annual tax
- $4,365 · $364/mo
- Projected year-2 tax
- $5,188 · $432/mo
- Expected delta
- +$824/yr (+$69/mo · 18.9%)
ⓘ Screening estimate from a state-policy table — verify with the county assessor before closing.
Climate risk First Street
- Flood 9/10 Extreme FEMA zone AE · 99% chance over 30 yrs
- Wildfire 3/10 Moderate
- Heat 10/10 Extreme 7 d/yr ≥107°F today · 26 d/yr by 30 yrs out
- Wind 10/10 Extreme 99% chance of damaging wind over 30 yrs
- Air quality 3/10 Moderate 3 unhealthy d/yr today · 3 by 30 yrs out
Nearby sold comps map
Loading sold comps map…
Walkable amenities ~0.75 mi
Loading nearby amenities…
Taxation est. · year 1
- Rental income
- $62,378
- − Mortgage interest
- −$35,015
- − Property taxes
- −$4,365
- − Insurance
- −$8,244
- − Repairs & maintenance
- −$4,990
- − Management
- −$4,990
- − HOA
- −$12,180
- − Depreciation
- −$18,185
- Taxable loss
- −$25,592
- Est. tax savings @ 24.0%
- +$6,142
- After-tax cash flow
- $-8,706/yr
For passive investors: Depreciation is non-cash, so a rental often shows a tax loss while cash-flowing — sheltering income. Rental losses are passive: they offset passive income freely, and up to $25,000/yr can offset ordinary (W-2) income if you actively participate and your MAGI is under $100k (phasing out to $0 by $150k); unused losses carry forward. On sale, claimed depreciation is recaptured at up to 25%, and gains may owe capital-gains tax (a 1031 exchange can defer both). Figures are a year-1 estimate at your 24.0% rate — not tax advice; consult a CPA.
Schools (NCES district)
No district data.
Livability — Naples
- Score
- 80/100
- State rank
- #126
- US rank
- #1903
Category grades
Schools grade is shown separately in the Schools card above.
Census & demographics
- Census place
- Naples, FL
- County
- Collier County · 396,295 people
- City population
- 344,941
- Metro
- Naples-Marco Island, FL
- Population (ZIP)
- 11,179
- Household income
- $130,929
- Rent vs Own
- Severe rent burden
- 333.0
Population outlook (Collier County) Hauer SSP2
- Today (2025)
- 420,858 people
- By 2030
- 450,054 · +6.9%
- By 2040
- 502,232 · +19.3%
- By 2050
- 544,932 · +29.5%
- By 2075
- 627,203 · +49.0%
- By 2100
- 659,015 · +56.6%
Race, ethnicity, and origin ACS 2023
- Neighborhood character
- Predominantly White (79%)
- Race & ethnicity
- White 79% Hispanic / Latino 9% Two or more races 8% Black 8% Asian 1%
- Hispanic origin (detail)
- Cuban 6%
- Common ancestry
- Hispanic 4% Lithuanian 4% Romanian 4%
- Foreign-born
- 17% · Canada, China
- Languages at home
- 87% English-only · Spanish 7% French/Haitian/Cajun 4% German/W. Germanic 1%
Political lean MEDSL · Collier
- 2024 margin
- Solid R (+33.1) · D 33.1% · R 66.2%
- 2008→2024 swing
- -10.6pp toward R · 2008: -22.5pp · 2024: -33.1pp
- All cycles
- 2024: R+33.1 2020: R+24.7 2016: R+26.0 2012: R+30.1 2008: R+22.5
Not yet ingested
- Civics
- —
Market trends
- HPI YoY
- ▲ 4.08%
- Current HPI
- 328.2755
- Rent YoY
- ▲ 8.75%
- Metro
- Naples-Marco Island, FL
- State GDP YoY
- ▲ 3.28%
- F500 in state
- 36
Industry mix (Fortune 500 HQ in FL)
| Industry | F500 HQs | Revenue |
|---|---|---|
| Industrial Technology | 2 | $29B |
|
||
| Insurance | 2 | $17B |
|
||
| Retail | 1 | $60B |
|
||
| Technology Distribution | 1 | $58B |
|
||
| Homebuilding | 1 | $35B |
|
||
| Technology Manufacturing | 1 | $35B |
|
||
Price history
+681.4% since first listed15 events — show timeline
- 2026-06-12 Listed $625,100 NAPLESMLS
- 2020-11-20 Sold (Public Records) $390,000 Public Records
- 2020-11-19 Pending — NAPLESMLS
- 2020-11-19 Listed $405,000 NAPLESMLS
- 2020-11-19 Sold (MLS) $390,000 NAPLESMLS
- 2020-10-18 Listing Removed — NAPLESMLS
- 2020-09-15 Relisted — NAPLESMLS
- 2020-09-09 Pending — NAPLESMLS
- 2020-07-14 Price Changed $405,000 NAPLESMLS
- 2020-06-05 Relisted — NAPLESMLS
- 2020-02-19 Listing Removed — NAPLESMLS
- 2019-10-18 Listed $428,000 NAPLESMLS
- 2001-06-20 Sold (Public Records) $193,500 Public Records
- 2001-01-30 Sold (Public Records) $159,900 Public Records
- 1991-12-01 Sold (Public Records) $80,000 Public Records
Property tax history
+6.9%/yrLatest (2025): $4,365 · -2.5% YoY. Source: county tax records.
Cash-flow waterfall
monthlySold comps — $/sqft
last 12 mo · ≤1 miLoading sold comps…