6123 Crestview Cir · McCloud, CA
Flood risk 1/10 · Minimal
- FEMA flood zone
- D
- Chance of flooding over 30 yrs
- 0.0%
- Est. flood insurance / yr
- $544 – $1,084
Fire risk 6/10 · Moderate
- Est. fire insurance / yr
- $659 – $1,223
Heat risk 3/10 · Minor
- Hot days now (above 91°F)
- 7 days/yr
- Hot days in 30 yrs
- 17 days/yr
Wind risk 1/10 · Minimal
- Chance of severe wind over 30 yrs
- —
Air-quality risk 10/10 · Severe
- Unhealthy air days now
- 30 days/yr
- Unhealthy air days in 30 yrs
- 31 days/yr
Risk factors via First Street. Map © Google.
Why this score? — see what drove the B+ grade
The composite is a weighted blend of 9 inputs, each scored 0–100. Each bar is that input's sub-score; the figure is the points it added to the 100-point composite (weight × sub-score).
- Cash flow +30.0/30.0
- 1% rule +10.0/10.0
- DSCR +10.0/10.0
- Appreciation +10.0/10.0
- ARV discount +7.5/15.0
- Schools +3.6/10.0
- Livability +3.0/5.0
- Rent growth +2.5/5.0
- Condition / age +2.5/5.0
$85,500
🖨 Deal sheet (PDF) 📄 Offer letter ✓ Due diligence
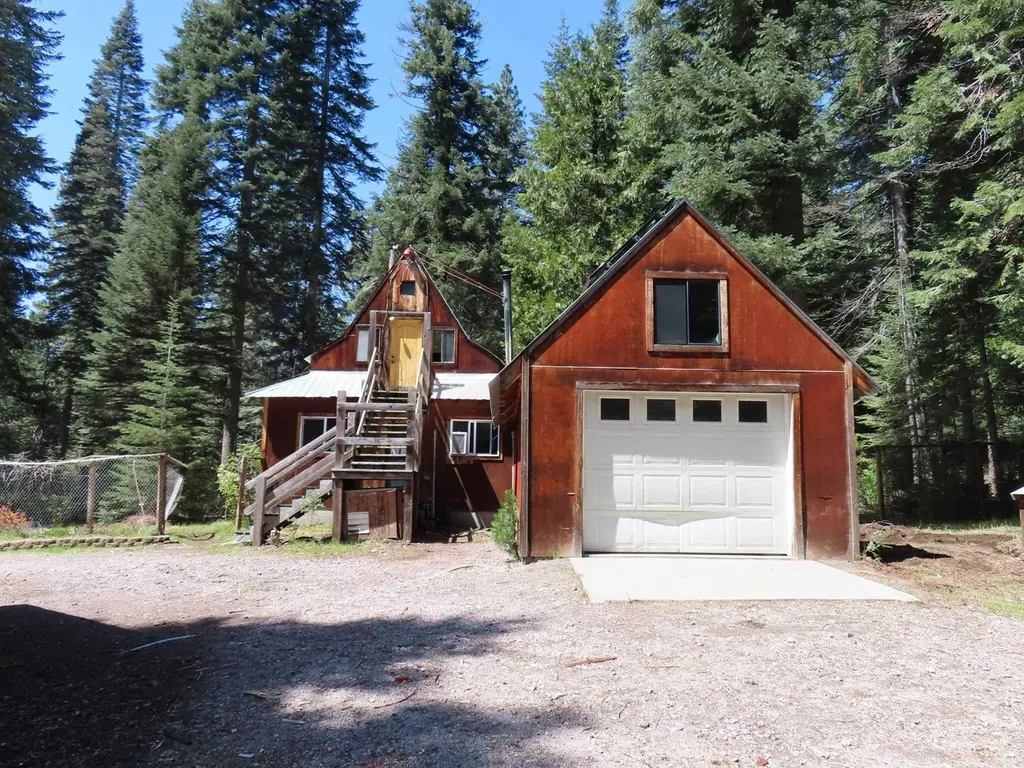
Listing remarks
Off-Grid Cabin Retreat Near Mount Shasta - If you’ve been dreaming of an off-grid cabin in the woods, this property could be the perfect fit. Located in the Mount Shasta Forest POA, just 6.5 miles from the charming town of McCloud at the base of Mount Shasta, this 2.5-acre parcel offers privacy, tranquility, and endless outdoor recreation. Enjoy year-round adventure with nearby fishing in rivers and reservoirs, as well as hiking, biking, and skiing—whether on snow or water. The property features a 1-bedroom, 1-bath cabin, a garage, a barn/wood storage building, and a spacious shop for additional storage or projects. The cabin does need some love, but with a little vision and eff
Key facts
- 2.5-acre parcel
- Spacious shop
- 2.5 acre lot
Tags
Property features AI
Finance
- Other: Zoning: RR; Lot dimensions roughly 219 x 497
Exterior
- Parking: Detached garage with 1 parking space
- Utilities: Private well water; Septic tank
- Home design: Single-family residence; Residential property
- Construction: Wood siding; Metal roof
- Exterior features: Level lot; Gravel road access; Mount Shasta Forest subdivision; Lot approximately 2.5 acres
Interior
- Heating & cooling: Wood stove
- Interior features: Wood stove heating
Neighborhood map
What this means for you Summary
Snapshot
- This is a 1-bed/1.0-bath single-family listed at $86k.
Deal economics
- At list price, monthly cash flow is $883 ($11k/yr) — positive.
- The deal already cash-flows at list — no discount required.
- Meets the 1% rule at list price ($2k rent vs $86k).
- Recommended offer: $78k (9.0% below list) — sets the bar for market timing.
Location & tenants
- Location reads 59/100 on livability (#636 in CA) — a working-class tenant base; expect higher turnover. Strengths: health & safety A+, housing B+; Watch: crime F, amenities F, commute F.
- Siskiyou Union High (rural): math 25% / reading 55% proficiency, ranked #763 of 1,400 in CA (top 54%) — families likely to look elsewhere, expect single-tenant / working-renter base with shorter leases; only 12% free/reduced lunch — higher-income household profile.
- Zoned schools: Mccloud Elementary (math 24% / reading 34%, grade F, #856 of 1,571 statewide, top 57%, 48 students, 79% FRL); Mccloud High (10 students, 50% FRL) — zoned schools average 65% FRL vs 12% district-wide (53 pts higher); higher-poverty schools than district average — tighter screening recommended.
- Market conditions: 135 active listings in the ZIP; 50 units permitted in Siskiyou County in 2024 (0 in 5+ unit buildings).
Forward outlook
- In year one you build about $9k of equity ($591 loan paydown + $9k appreciation (10.0% local appreciation)).
- Siskiyou County population projected at -26% by 2050 — secular population decline; favor cash flow + early exit over multi-decade hold.
- At projected returns (10.0% appreciation + 3.0% rent growth), your $24k cash investment doubles in ~2 years — after that, you're playing with house money.
- By year 4, paydown + projected appreciation supports a ~$32k cash-out refi (75% LTV) — recoverable capital for the next deal without selling this one.
Negotiation context
- It's been on market 95 days — a 9% lower offer ($78k) is reasonable based on typical stale-listing flexibility.
Risks & watch-outs
- Climate carrying-cost: major wildfire risk — expect insurance premiums to compound above CPI over the hold.
Questions for the listing agent
- It's been on market 95 days. Have you received any prior offers? Is the seller open to a 9% concession, seller financing, or rate buy-down credit?
- Why hasn't it sold? Are there any deal-killer items the seller is aware of (foundation, flood, title, zoning, code violations)?
- Is there a deadline driving the sale (1031 exchange, divorce, estate, relocation)? That informs how much negotiation room exists.
- Crime grade is F in this area — have there been break-ins, vandalism, or insurance claims at this property in the last 3 years? What carrier currently insures it and at what premium?
- What's the average days-on-market for RENTAL listings here right now (not sales)? A rising rental-DOM trend means longer vacancies and softer asking-rent achievability than the comps imply.
- What's the recent tenant-quality profile in this submarket — average credit score on applications, eviction rate, late-payment / NSF rate, and stable-employment percentage? A property-management company in the area should have these aggregated.
- How much new for-sale + rental construction is in the pipeline within 1–3 miles? Heavy new supply typically softens prices + rents 12–24 months out; constrained supply supports both.
Investment metrics
- 1% rule
- 2.09% ✓
- Cap rate
- 18.68%
- Cash-on-cash
- 44.25%
- DSCR
- 2.97
- GRM
- 4.0
CMA / ARV
No comps found within radius.
Projected returns pro-forma
10.0% appreciation · 3.0% rent growth · sell at horizon
- IRR
- 58.7%
- Equity multiple
- 5.29×
- Total profit
- $102,782
- Equity at exit
- $77,025
- IRR
- 52.3%
- Equity multiple
- 11.80×
- Total profit
- $258,435
- Equity at exit
- $166,108
Cash invested: $23,940 (down + closing). Projections, not guarantees.
Landlord ↔ Tenant lean methodology
- Overall (STATE)
- 18 Strongly Tenant-Friendly
- State California
- 18 Strongly Tenant-Friendly · D+13
- County
- — inherits STATE
- City
- — inherits STATE
ZIP-level market 96057
- Active inventory
- 135
- Price-to-rent
- 4.0×
Monthly cashflow live
- Estimated rent
- $1,786 medium interval (Pro) →
- Mortgage (P&I)
- −$448
- Tax from tax record
- −$44 /mo · $530/yr
- Insurance
- −$36
- HOA
- −$0
- Vacancy / Maint / Mgmt
- −$375
- Net cashflow
- $883
Break-even live
Sensitivity live
| Price | -10% $931 | -5% $907 | +0% $883 | +5% $859 | +10% $834 |
|---|---|---|---|---|---|
| Rent | -10% $742 | -5% $812 | +0% $883 | +5% $953 | +10% $1,024 |
| Rate | -1.0pp $926 | -0.5pp $905 | base $883 | +0.5pp $861 | +1.0pp $838 |
UW: 25.0% down · 7.5% · 30yr · 1.5% tax · 5.0% vac · 8.0% maint · 8.0% mgmt
Financing live
Cash to close
- Down payment
- $21,375
- Closing costs
- $2,565
- Reserves months
- —
- Total cash needed
- —
Loan-product check · same deal, 3 products live
Conventional
25% down · 7.5% · 30yr
- Down + closing
- —
- Monthly P&I
- —
- Monthly cashflow
- —
- DSCR
- —
- Eligible?
- —
Personal DTI + credit; lowest rate.
DSCR
20% down · 8.5% · 30yr
- Down + closing
- —
- Monthly P&I
- —
- Monthly cashflow
- —
- DSCR
- —
- Eligible?
- —
No personal income docs; deal must DSCR.
Hard money
10% down · 12.0% · 12mo
- Down + closing
- —
- Monthly P&I
- —
- Monthly cashflow
- —
- DSCR
- —
- Eligible?
- —
Short-term bridge; refi at stabilization.
Listing history 22 events
-
2026-06-22days on market $85,500 Active 95 DOM
-
2026-06-21days on market $85,500 Active 94 DOM
-
2026-06-19days on market $85,500 Active 92 DOM
-
2026-06-18days on market $85,500 Active 91 DOM
-
2026-06-17days on market $85,500 Active 90 DOM
-
2026-06-16days on market $85,500 Active 89 DOM
-
2026-06-15days on market $85,500 Active 88 DOM
-
2026-06-14days on market $85,500 Active 86 DOM
-
2026-06-12days on market $85,500 Active 85 DOM
-
2026-06-09days on market $85,500 Active 82 DOM
-
2026-06-08days on market $85,500 Active 81 DOM
-
2026-06-07days on market $85,500 Active 80 DOM
-
2026-06-07days on market $85,500 Active 79 DOM
-
2026-06-04days on market $85,500 Active 76 DOM
-
2026-06-02days on market $85,500 Active 75 DOM
-
2026-06-01days on market $85,500 Active 74 DOM
-
2026-05-31days on market $85,500 Active 73 DOM
-
2026-05-31days on market $85,500 Active 72 DOM
-
2026-04-29price $85,500
-
2026-04-20price $90,000
-
2026-04-17price $85,500
-
2026-03-18$90,000 Active
ⓘ Source: listings_history table (triggers on properties + properties_extension) + one-shot
backfill from property_details.listing_events for pre-trigger history.
Tax reassessment forecast CA · Resets to sale price
- Current annual tax
- $530 · $44/mo
- Projected year-2 tax
- $650 · $54/mo
- Expected delta
- +$120/yr (+$10/mo · 22.6%)
ⓘ Screening estimate from a state-policy table — verify with the county assessor before closing.
Climate risk First Street
- Flood 1/10 Low FEMA zone D · 0% chance over 30 yrs
- Wildfire 6/10 Major
- Heat 3/10 Moderate 7 d/yr ≥91°F today · 17 d/yr by 30 yrs out
- Wind 1/10 Low
- Air quality 10/10 Extreme 30 unhealthy d/yr today · 31 by 30 yrs out
Nearby sold comps map
Loading sold comps map…
Walkable amenities ~0.75 mi
Loading nearby amenities…
Taxation est. · year 1
- Rental income
- $21,433
- − Mortgage interest
- −$4,789
- − Property taxes
- −$530
- − Insurance
- −$428
- − Repairs & maintenance
- −$1,715
- − Management
- −$1,715
- − Depreciation
- −$2,487
- Taxable income
- $9,769
- Est. tax owed @ 24.0%
- −$2,345
- After-tax cash flow
- $8,249/yr
For passive investors: Depreciation is non-cash, so a rental often shows a tax loss while cash-flowing — sheltering income. Rental losses are passive: they offset passive income freely, and up to $25,000/yr can offset ordinary (W-2) income if you actively participate and your MAGI is under $100k (phasing out to $0 by $150k); unused losses carry forward. On sale, claimed depreciation is recaptured at up to 25%, and gains may owe capital-gains tax (a 1031 exchange can defer both). Figures are a year-1 estimate at your 24.0% rate — not tax advice; consult a CPA.
Schools (NCES district)
- District
- Siskiyou Union High
- NCES district ID
- 0636940
- Math proficiency
- 25% ▲ 5.00%
- Reading proficiency
- 55% ▲ 5.00%
- Median HH income
- $39,293
- Composite
- 35.84/100
- National rank
- #9605
- State rank
- #763 of 1400 in CA
Livability — McCloud
- Score
- 59/100
- State rank
- #636
- US rank
- #20040
Category grades
Schools grade is shown separately in the Schools card above.
Census & demographics
- Population (ZIP)
- 1,076
Population outlook (Siskiyou County) Hauer SSP2
- Today (2025)
- 39,337 people
- By 2030
- 36,930 · -6.1%
- By 2040
- 32,367 · -17.7%
- By 2050
- 29,030 · -26.2%
- By 2075
- 23,534 · -40.2%
- By 2100
- 19,312 · -50.9%
Race, ethnicity, and origin ACS 2023
- Neighborhood character
- Predominantly White (79%)
- Race & ethnicity
- White 79% Two or more races 13% Hispanic / Latino 6% Native American 3% Asian 1%
- Hispanic origin (detail)
- Mexican 5%
- Common ancestry
- Russian 6% Slovak 5% Lithuanian 3%
- Foreign-born
- 5% · Canada
- Languages at home
- 96% English-only · German/W. Germanic 1% Other Asian/Pacific 1% Spanish 1%
Political lean MEDSL · Siskiyou
- 2024 margin
- R (+19.2) · D 38.8% · R 58.0% · Other 3.2%
- 2008→2024 swing
- -8.8pp toward R · 2008: -10.4pp · 2024: -19.2pp
- All cycles
- 2024: R+19.2 2020: R+15.8 2016: R+20.7 2012: R+15.6 2008: R+10.4
Not yet ingested
- Civics
- —
Market trends
- HPI YoY
- ▲ 147.64%
- Current HPI
- 490.68
- Rent YoY
- —
- Metro
- —
- State GDP YoY
- ▲ 3.21%
- F500 in state
- 116
Industry mix (Fortune 500 HQ in CA)
| Industry | F500 HQs | Revenue |
|---|---|---|
| Technology | 27 | $1,492B |
|
||
| Financial Services | 3 | $174B |
|
||
| Retail | 3 | $44B |
|
||
| Insurance | 3 | $26B |
|
||
| Media / Entertainment | 2 | $115B |
|
||
| Pharmaceuticals / Biotech | 2 | $62B |
|
||
Price history
-5.0% since first listed4 events — show timeline
- 2026-04-29 Price Changed $85,500 SMLS
- 2026-04-20 Price Changed $90,000 SMLS
- 2026-04-17 Price Changed $85,500 SMLS
- 2026-03-18 Listed $90,000 SMLS
Property tax history
+0.6%/yrLatest (2025): $530 · -9.1% YoY. Source: county tax records.
Cash-flow waterfall
monthlySold comps — $/sqft
last 12 mo · ≤1 miLoading sold comps…