5670 Hillside Trl · Newburgh, IN
Flood risk 1/10 · Minimal
- FEMA flood zone
- X (unshaded)
- Chance of flooding over 30 yrs
- 0.0%
- Est. flood insurance / yr
- $507 – $1,088
Fire risk 1/10 · Minimal
- Est. fire insurance / yr
- $717 – $1,331
Heat risk 5/10 · Moderate
- Hot days now (above 106°F)
- 7 days/yr
- Hot days in 30 yrs
- 19 days/yr
Wind risk 2/10 · Minimal
- Chance of severe wind over 30 yrs
- 3.0%
Air-quality risk 4/10 · Minor
- Unhealthy air days now
- 4 days/yr
- Unhealthy air days in 30 yrs
- 6 days/yr
Risk factors via First Street. Map © Google.
Why this score? — see what drove the D- grade
The composite is a weighted blend of 9 inputs, each scored 0–100. Each bar is that input's sub-score; the figure is the points it added to the 100-point composite (weight × sub-score).
- ARV discount +9.5/15.0
- Cash flow +7.5/30.0
- Schools +4.9/10.0
- Rent growth +4.7/5.0
- Livability +4.0/5.0
- Condition / age +2.5/5.0
- 1% rule +2.2/10.0
- DSCR +1.7/10.0
- Appreciation +0.0/10.0
$349,950
🖨 Deal sheet (PDF) 📄 Offer letter ✓ Due diligence
Listing remarks MLS
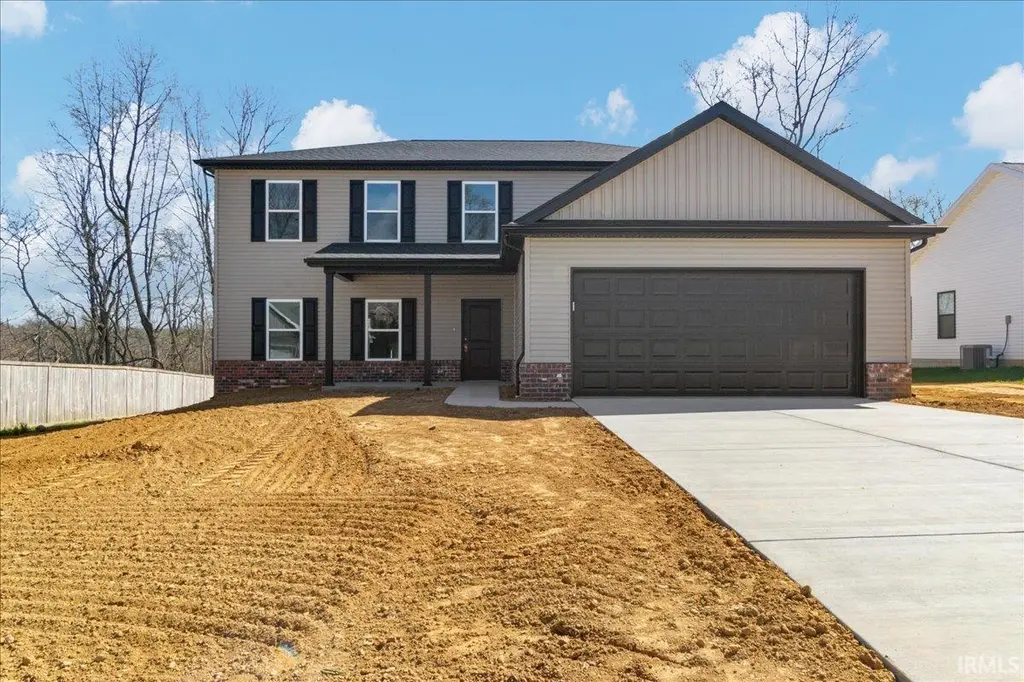
Welcome to 5670 Hillside Trail, a beautiful new construction home located in a newly developed subdivision just off Sharon Road in Newburgh. This two-story, vinyl-sided home offers 4 spacious bedrooms and 2.5 bathrooms, designed with modern living in mind. The open and functional layout features a completely applianced kitchen highlighted by quartz countertops, perfect for everyday living and entertaining. Quartz vanity tops carry the upscale feel into the bathrooms. Enjoy outdoor living on the large wood deck, ideal for relaxing or hosting guests. Additional features include a 2-car attached garage and a prime location offering both convenience and a neighborhood setting. With quality finishes throughout and thoughtful design, this home is move-in ready and waiting for its first owner.
Key facts
- Quartz countertops
- Large wood deck
- Prime location
Tags
Neighborhood map
What this means for you Summary
Snapshot
- This is a 4-bed/2.5-bath land listed at $350k.
Deal economics
- At list price, monthly cash flow is $-429 ($-5k/yr) — negative.
- To cash-flow at today's rent, offer at most $288k (17.8% below list).
- To meet the 1% rule (rent ≥ 1% of price), the offer needs to be $252k (28.1% below list).
- Recommended offer: $252k (28.1% below list) — sets the bar for 1% rule.
- Cap rate 4.8% vs local median 3.9% in Newburgh — meaningfully above typical; check what's discounted (condition, days-on-market, listing class) to confirm the premium yield is real.
Location & tenants
- Location reads 80/100 on livability (#21 in IN, #1,922 nationally) — a professional / high-income tenant draw. Strengths: crime A+, cost of living A+, housing A+; Watch: amenities F, commute F.
- Warrick County School Corporation (suburban): math 54% / reading 59% proficiency, ranked #24 of 301 in IN (top 8%) — acceptable for families but not a draw, mixed tenant base, ~2y average lease.
- Market conditions: Rents rising fast (+8.7%/yr); 395 active listings in the ZIP; 2 comparable units currently listed for rent nearby; solid renter incomes; 249 units permitted in Warrick County in 2024 (0 in 5+ unit buildings).
- This rent runs 32% of the median local income ($94k/yr) — at the standard rent-burdened threshold; future hikes will face affordability resistance.
Forward outlook
- Local home prices are declining (-3.0%/yr); year-one equity from $2k of loan paydown is wiped out by about $10k of value loss. Plan a longer hold.
- Warrick County population projected at +9% by 2050 — modest demand growth; plan on rents tracking national, not racing it.
Negotiation context
- It's been on market 87 days — a 6% lower offer ($329k) is reasonable based on typical stale-listing flexibility.
Risks & watch-outs
- Climate carrying-cost: extreme-heat days projected 7→19/yr by 2055 (HVAC capex compounding) — expect insurance premiums to compound above CPI over the hold.
Questions for the listing agent
- What do current leases actually rent for vs. the listed asking? Can we see a recent rent roll and the last 12 months of T-12 income?
- It's been on market 87 days. Have you received any prior offers? Is the seller open to a 28% concession, seller financing, or rate buy-down credit?
- Why hasn't it sold? Are there any deal-killer items the seller is aware of (foundation, flood, title, zoning, code violations)?
- Is there a deadline driving the sale (1031 exchange, divorce, estate, relocation)? That informs how much negotiation room exists.
- Schools are A-rated — typically a magnet for longer-tenancy family renters. What's the average tenant stay here, and is there a school-zone premium baked into asking?
- The area grade is low — what's the realistic commute time and amenity access for the typical tenant pool here? Any planned neighborhood developments (good or bad) we should know about?
- What's the average days-on-market for RENTAL listings here right now (not sales)? A rising rental-DOM trend means longer vacancies and softer asking-rent achievability than the comps imply.
- What's the recent tenant-quality profile in this submarket — average credit score on applications, eviction rate, late-payment / NSF rate, and stable-employment percentage? A property-management company in the area should have these aggregated.
- How much new for-sale + rental construction is in the pipeline within 1–3 miles? Heavy new supply typically softens prices + rents 12–24 months out; constrained supply supports both.
Investment metrics
- 1% rule
- 0.72% ✗
- Cap rate
- 4.82%
- Cash-on-cash
- -5.26%
- DSCR
- 0.77
- GRM
- 11.6
CMA / ARV
- ARV (median comp)
- $366,214
- List price
- $349,950
- Delta
- -4.44%
- Verdict
- FAIR
- Comps
- 20 within 1.0 mi
Projected returns pro-forma
-3.0% appreciation · 8.0% rent growth · sell at horizon
- IRR
- -19.8%
- Equity multiple
- 0.28×
- Total profit
- $-70,706
- Equity at exit
- $52,179
- IRR
- -4.6%
- Equity multiple
- 0.63×
- Total profit
- $-36,062
- Equity at exit
- $30,257
Cash invested: $97,986 (down + closing). Projections, not guarantees.
Landlord ↔ Tenant lean methodology
- Overall (STATE)
- 90 Strongly Landlord-Friendly
- State Indiana
- 90 Strongly Landlord-Friendly · R+11
- County
- — inherits STATE
- City
- — inherits STATE
ZIP-level market 47630
- Rents YoY
- 8.7%
- Active inventory
- 395
- Price-to-rent
- 11.6×
Monthly cashflow live
- Estimated rent
- $2,518 medium interval (Pro) →
- Mortgage (P&I)
- −$1,835
- Tax est. 1.5%
- −$437 /mo · $5,249/yr
- Insurance
- −$146
- HOA
- −$0
- Vacancy / Maint / Mgmt
- −$529
- Net cashflow
- $-429
Break-even live
Sensitivity live
| Price | -10% $-187 | -5% $-308 | +0% $-429 | +5% $-550 | +10% $-671 |
|---|---|---|---|---|---|
| Rent | -10% $-628 | -5% $-529 | +0% $-429 | +5% $-330 | +10% $-230 |
| Rate | -1.0pp $-253 | -0.5pp $-340 | base $-429 | +0.5pp $-520 | +1.0pp $-612 |
UW: 25.0% down · 7.5% · 30yr · 1.5% tax · 5.0% vac · 8.0% maint · 8.0% mgmt
Financing live
Cash to close
- Down payment
- $87,488
- Closing costs
- $10,498
- Reserves months
- —
- Total cash needed
- —
Loan-product check · same deal, 3 products live
Conventional
25% down · 7.5% · 30yr
- Down + closing
- —
- Monthly P&I
- —
- Monthly cashflow
- —
- DSCR
- —
- Eligible?
- —
Personal DTI + credit; lowest rate.
DSCR
20% down · 8.5% · 30yr
- Down + closing
- —
- Monthly P&I
- —
- Monthly cashflow
- —
- DSCR
- —
- Eligible?
- —
No personal income docs; deal must DSCR.
Hard money
10% down · 12.0% · 12mo
- Down + closing
- —
- Monthly P&I
- —
- Monthly cashflow
- —
- DSCR
- —
- Eligible?
- —
Short-term bridge; refi at stabilization.
Rent comps 2 comps
| Address | Beds | Baths | Sqft | Rent | $/sqft | DOM | Units | Dist |
|---|---|---|---|---|---|---|---|---|
| 5041 E Sherwood Dr Newburgh, IN | 3.0 | 2.5 | 2077 | $2,350 | $1.13 | 15d | 1 | 0.71mi |
| 603 W Water St Newburgh, IN | 3.0 | 2.0 | 2810 | $3,700 | $1.32 | 45d | 1 | 1.49mi |
Listing history 17 events
-
2026-06-22days on market $349,950 Active 87 DOM
-
2026-06-18days on market $349,950 Active 84 DOM
-
2026-06-17days on market $349,950 Active 83 DOM
-
2026-06-16days on market $349,950 Active 82 DOM
-
2026-06-15days on market $349,950 Active 81 DOM
-
2026-06-14pricedays on market $349,950 Active 79 DOM
-
2026-06-13days on market $354,950 Active 78 DOM
-
2026-06-10days on market $354,950 Active 76 DOM
-
2026-06-09days on market $354,950 Active 75 DOM
-
2026-06-08days on market $354,950 Active 74 DOM
-
2026-06-07days on market $354,950 Active 73 DOM
-
2026-06-02days on market $354,950 Active 68 DOM
-
2026-06-01days on market $354,950 Active 67 DOM
-
2026-05-31days on market $354,950 Active 66 DOM
-
2026-05-30days on market $354,950 Active 65 DOM
-
2026-05-19price $354,950 797-char remark
Show marketing remark (797 chars)
Welcome to 5670 Hillside Trail, a beautiful new construction home located in a newly developed subdivision just off Sharon Road in Newburgh. This two-story, vinyl-sided home offers 4 spacious bedrooms and 2.5 bathrooms, designed with modern living in mind. The open and functional layout features a completely applianced kitchen highlighted by quartz countertops, perfect for everyday living and entertaining. Quartz vanity tops carry the upscale feel into the bathrooms. Enjoy outdoor living on the large wood deck, ideal for relaxing or hosting guests. Additional features include a 2-car attached garage and a prime location offering both convenience and a neighborhood setting. With quality finishes throughout and thoughtful design, this home is move-in ready and waiting for its first owner.
-
2026-03-25$359,950 Active 797-char remark
Show marketing remark (797 chars)
Welcome to 5670 Hillside Trail, a beautiful new construction home located in a newly developed subdivision just off Sharon Road in Newburgh. This two-story, vinyl-sided home offers 4 spacious bedrooms and 2.5 bathrooms, designed with modern living in mind. The open and functional layout features a completely applianced kitchen highlighted by quartz countertops, perfect for everyday living and entertaining. Quartz vanity tops carry the upscale feel into the bathrooms. Enjoy outdoor living on the large wood deck, ideal for relaxing or hosting guests. Additional features include a 2-car attached garage and a prime location offering both convenience and a neighborhood setting. With quality finishes throughout and thoughtful design, this home is move-in ready and waiting for its first owner.
ⓘ Source: listings_history table (triggers on properties + properties_extension) + one-shot
backfill from property_details.listing_events for pre-trigger history.
Climate risk First Street
- Flood 1/10 Low FEMA zone X (unshaded) · 0% chance over 30 yrs
- Wildfire 1/10 Low
- Heat 5/10 Major 7 d/yr ≥106°F today · 19 d/yr by 30 yrs out
- Wind 2/10 Low 3% chance of damaging wind over 30 yrs
- Air quality 4/10 Moderate 4 unhealthy d/yr today · 6 by 30 yrs out
Nearby sold comps map
Loading sold comps map…
Walkable amenities ~0.75 mi
Loading nearby amenities…
Taxation est. · year 1
- Rental income
- $30,214
- − Mortgage interest
- −$19,603
- − Property taxes
- −$5,249
- − Insurance
- −$1,750
- − Repairs & maintenance
- −$2,417
- − Management
- −$2,417
- − Depreciation
- −$10,180
- Taxable loss
- −$11,402
- Est. tax savings @ 24.0%
- +$2,736
- After-tax cash flow
- $-2,415/yr
For passive investors: Depreciation is non-cash, so a rental often shows a tax loss while cash-flowing — sheltering income. Rental losses are passive: they offset passive income freely, and up to $25,000/yr can offset ordinary (W-2) income if you actively participate and your MAGI is under $100k (phasing out to $0 by $150k); unused losses carry forward. On sale, claimed depreciation is recaptured at up to 25%, and gains may owe capital-gains tax (a 1031 exchange can defer both). Figures are a year-1 estimate at your 24.0% rate — not tax advice; consult a CPA.
Schools (NCES district)
- District
- Warrick County School Corporation
- NCES district ID
- 1812390
- Math proficiency
- 54% ▼ -8.00%
- Reading proficiency
- 59% ▼ -6.00%
- Median HH income
- $62,801
- Composite
- 49.38/100
- National rank
- #2014
- State rank
- #24 of 301 in IN
Livability — Newburgh
- Score
- 80/100
- State rank
- #21
- US rank
- #1922
Category grades
Schools grade is shown separately in the Schools card above.
Census & demographics
- County
- Warrick County · 39,818 people
- City population
- 39,818
- Metro
- Evansville, IN-KY
- Population (ZIP)
- 39,818
- Household income
- $94,162
- Rent vs Own
- Severe rent burden
- 770.0
Population outlook (Warrick County) Hauer SSP2
- Today (2025)
- 66,569 people
- By 2030
- 68,404 · +2.8%
- By 2040
- 71,131 · +6.9%
- By 2050
- 72,743 · +9.3%
- By 2075
- 76,088 · +14.3%
- By 2100
- 72,261 · +8.6%
Race, ethnicity, and origin ACS 2023
- Neighborhood character
- Predominantly White (88%)
- Race & ethnicity
- White 88% Two or more races 5% Black 3% Hispanic / Latino 3% Asian 3%
- Common ancestry
- Italian 3% Lithuanian 2% Romanian 2%
- Foreign-born
- 5% · Canada, China
- Languages at home
- 96% English-only · Spanish 2% Other Indo-European 1%
Political lean MEDSL · Warrick
- 2024 margin
- Solid R (+30.2) · D 34.1% · R 64.3% · Other 1.5%
- 2008→2024 swing
- -17.4pp toward R · 2008: -12.8pp · 2024: -30.2pp
- All cycles
- 2024: R+30.2 2020: R+27.8 2016: R+33.9 2012: R+26.6 2008: R+12.8
Not yet ingested
- Civics
- —
Market trends
- HPI YoY
- ▼ -187.44%
- Current HPI
- 185.7643
- Rent YoY
- ▲ 8.69%
- Metro
- Evansville, IN-KY
- State GDP YoY
- ▲ 2.90%
- F500 in state
- 18
Industry mix (Fortune 500 HQ in IN)
| Industry | F500 HQs | Revenue |
|---|---|---|
| Industrial Machinery | 2 | $37B |
|
||
| Healthcare | 1 | $177B |
|
||
| Pharmaceuticals | 1 | $45B |
|
||
| Metals / Steel | 1 | $18B |
|
||
| Agriculture | 1 | $17B |
|
||
| Packaging | 1 | $12B |
|
||
Price history
-1.4% since first listed2 events — show timeline
- 2026-05-19 Price Changed $354,950 IRMLS
- 2026-03-25 Listed $359,950 IRMLS
Property tax history
-0.9%/yrLatest (2024): $17 · -3.6% YoY. Source: county tax records.
Cash-flow waterfall
monthlySold comps — $/sqft
last 12 mo · ≤1 miLoading sold comps…