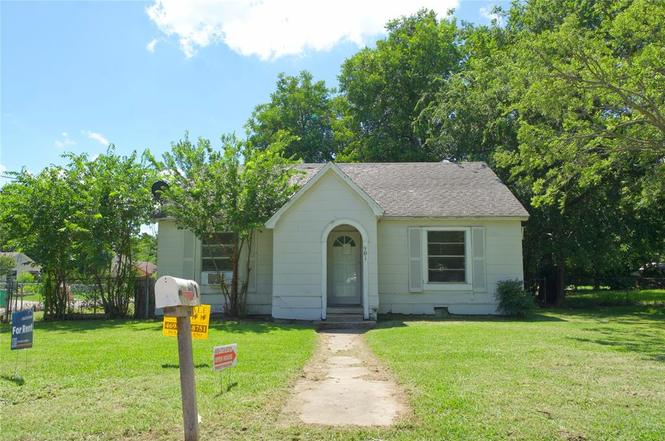
901 N Howeth · Gainesville, TX
Flood risk 1/10 · Minimal
- FEMA flood zone
- X (unshaded)
- Chance of flooding over 30 yrs
- 0.0%
- Est. flood insurance / yr
- $507 – $1,088
Fire risk 7/10 · Major
- Est. fire insurance / yr
- $1,222 – $2,270
Heat risk 6/10 · Moderate
- Hot days now (above 110°F)
- 7 days/yr
- Hot days in 30 yrs
- 20 days/yr
Wind risk 4/10 · Minor
- Chance of severe wind over 30 yrs
- 17.0%
Air-quality risk 3/10 · Minor
- Unhealthy air days now
- 3 days/yr
- Unhealthy air days in 30 yrs
- 4 days/yr
Risk factors via First Street. Map © Google.
Why this score? — see what drove the D+ grade
The composite is a weighted blend of 9 inputs, each scored 0–100. Each bar is that input's sub-score; the figure is the points it added to the 100-point composite (weight × sub-score).
- Cash flow +14.7/30.0
- ARV discount +12.7/15.0
- DSCR +4.5/10.0
- 1% rule +3.8/10.0
- Livability +3.3/5.0
- Schools +2.6/10.0
- Rent growth +2.5/5.0
- Condition / age +2.5/5.0
- Appreciation +0.0/10.0
$199,000
🖨 Deal sheet 📄 Offer letter ✓ Due diligence
Listing remarks MLS
Cute frame home with lots of room. Formal dining room and breakfast nook. Split bedrooms. Hardwood floors. Upstairs bedroom and loft area with 288+- sq. ft. Nice big yard with detached 1 car garage with opener and an open patio. Corner lot. Buyer to verify all information.
Key facts
- 7,841 sq ft lot
- Garage
- Built 1945
Property features AI
Finance
- Other: Listing status: Active; Possession at closing/funding; Listing agreement: Exclusive right to sell; Transaction type: For sale
- Financial info: Seller may carry financing (Owner will carry); Loan type listed as Treat As Clear; No second mortgage
- HOA & community: No homeowners association
Exterior
- Parking: Garage (1 covered space, 1 garage space)
- Utilities: City water; City sewer; Not in a municipal utility district
- Home design: Single-family residence; Attached property; Built in 1945; Two stories
- Construction: 1945 construction
- Exterior features: Lot less than 0.5 acre (approximately 0.18 acre); Subdivision: Lee; GPS-friendly directions
Interior
- Kitchen: No appliances included
- Bedrooms: 4 bedrooms (all on the main level); Primary bedroom on main level
- Bathrooms: 2 full bathrooms
- Interior features: Two-level interior with 6 total rooms; One living area and one dining area; No fireplaces; Other interior features
- Laundry & utility: No laundry appliances listed
Neighborhood map
What this means for you Summary
Snapshot
- This is a 3-bed/2.0-bath single-family listed at $199k.
Deal economics
- At list price, monthly cash flow is $51 ($612/yr) — positive.
- The deal already cash-flows at list — no discount required.
- To meet the 1% rule (rent ≥ 1% of price), the offer needs to be $174k (12.5% below list).
- Recommended offer: $174k (12.5% below list) — sets the bar for 1% rule.
- Cap rate 6.6% vs local median 3.7% in Gainesville — top-decile yield for the area; either an underpriced asset or a hidden risk that comps aren't pricing in. Stress-test before assuming the spread holds.
Location & tenants
- Location reads 66/100 on livability (#602 in TX) — a middle-class / working-renter tenant base. Strengths: cost of living A+, housing A+, crime B+; Watch: amenities F, commute F, employment F.
- Gainesville ISD (rural): math 33% / reading 29% proficiency, ranked #606 of 826 in TX (top 73%) — families likely to look elsewhere, expect single-tenant / working-renter base with shorter leases; 72% free/reduced lunch — lower-income household profile, screen leases tightly.
- Zoned schools: Edison El (683 students, 81% FRL).
- Market conditions: 462 active listings in the ZIP; 6 comparable units currently listed for rent nearby; rentals lingering (median 44d on market — plan ~5-8 weeks vacancy on turnover, expect pricing pressure); 100% of comp listings sitting > 30 days — soft ceiling on asking rent; 190 units permitted in Cooke County in 2024 (0 in 5+ unit buildings).
Forward outlook
- Local home prices are declining (-3.0%/yr); year-one equity from $1k of loan paydown is wiped out by about $6k of value loss. Plan a longer hold.
Negotiation context
- Only 2 days on market — expect competitive offers; lowballing is unlikely to land.
- 4 sale attempts since 11y ago with the ask held roughly flat each time — persistent listings suggest the price (not the market) is what's stuck; bring a comps-based counter.
- Current owner paid $44k; list at $199k implies a 357% gain — meaningful room to come down on a strong offer.
Risks & watch-outs
- Watch-outs: built in 1945 — expect roof / HVAC / electrical / plumbing capex.
- Climate carrying-cost: major wildfire risk; extreme-heat days projected 7→20/yr by 2055 (HVAC capex compounding) — expect insurance premiums to compound above CPI over the hold.
Questions for the listing agent
- Built in 1945 — when were the roof, HVAC, electrical panel, plumbing, and water heater last replaced?
- Is there a deadline driving the sale (1031 exchange, divorce, estate, relocation)? That informs how much negotiation room exists.
- Schools are F-rated, which usually means shorter tenancies and higher turnover. Who's the typical renter profile here, and what's been the actual vacancy rate?
- The area grade is low — what's the realistic commute time and amenity access for the typical tenant pool here? Any planned neighborhood developments (good or bad) we should know about?
- What's the average days-on-market for RENTAL listings here right now (not sales)? A rising rental-DOM trend means longer vacancies and softer asking-rent achievability than the comps imply.
- What's the recent tenant-quality profile in this submarket — average credit score on applications, eviction rate, late-payment / NSF rate, and stable-employment percentage? A property-management company in the area should have these aggregated.
- How much new for-sale + rental construction is in the pipeline within 1–3 miles? Heavy new supply typically softens prices + rents 12–24 months out; constrained supply supports both.
Investment metrics
- 1% rule
- 0.88% ✗
- Cap rate
- 6.60%
- Cash-on-cash
- 1.10%
- DSCR
- 1.05
- GRM
- 9.5
CMA / ARV
- ARV (on-the-fly)
- $225,060
- Comps found
- 12
Show comp detail 12 sales within ~0.75 mi
| Address | Dist | Beds/Ba | Sqft | Sold | Price | $/sf | Match |
|---|---|---|---|---|---|---|---|
| 901 Gladney St | 0.06mi | 4/2.0 (+1) | 1,730 (+2%) | 7mo | $125,000 | $72 | 84 |
| 2005 Brentwood St | 0.50mi | 3/2.0 | 1,752 (+3%) | 1mo | $268,000 | $153 | 72 |
| 1112 Hillside Dr | 0.47mi | 3/2.0 | 1,734 (+2%) | 6mo | $279,000 | $161 | 70 |
| 1305 Hillcrest Blvd | 0.40mi | 3/3.0 | 1,786 (+5%) | 3mo | $156,000 | $87 | 67 |
| 1218 Fair Ave | 0.44mi | 3/1.0 | 1,616 (-5%) | 7mo | $160,000 | $99 | 61 |
| 2003 Oneal St | 0.50mi | 3/2.0 | 1,788 (+5%) | 9mo | $248,000 | $139 | 61 |
| 414 Willow Way | 0.58mi | 3/2.0 | 1,770 (+4%) | 8mo | $258,500 | $146 | 60 |
| 1109 Elmwood St | 0.38mi | 3/2.0 | 1,917 (+12%) | 6mo | $199,000 | $104 | 56 |
| 415 N Taylor St | 0.57mi | 3/2.0 | 1,832 (+7%) | 11mo | $239,000 | $130 | 52 |
| 1305 Belmont St | 0.52mi | 4/2.0 (+1) | 1,824 (+7%) | 12mo | $240,000 | $132 | 50 |
| 1314 Magnolia St | 0.60mi | 3/2.0 | 1,906 (+12%) | 10mo | $225,000 | $118 | 44 |
| 408 Ashland Dr | 0.65mi | 3/2.0 | 1,518 (-11%) | 9mo | $237,500 | $156 | 44 |
Match score weights: distance 35% · size 25% · config 20% · recency 20%. Top-matched comps best support the ARV.
Projected returns pro-forma
-3.0% appreciation · 3.0% rent growth · sell at horizon
- IRR
- -14.6%
- Equity multiple
- 0.48×
- Total profit
- $-29,004
- Equity at exit
- $29,672
- IRR
- -5.9%
- Equity multiple
- 0.62×
- Total profit
- $-21,094
- Equity at exit
- $17,206
Cash invested: $55,720 (down + closing). Projections, not guarantees.
Landlord ↔ Tenant lean methodology
- Overall (STATE)
- 87 Strongly Landlord-Friendly
- State Texas
- 87 Strongly Landlord-Friendly · R+5
- County
- — inherits STATE
- City
- — inherits STATE
ZIP-level market 76240
- Active inventory
- 462
- Price-to-rent
- 9.5×
Monthly cashflow live
- Estimated rent
- $1,742 high interval (Pro) →
- Mortgage (P&I)
- −$1,044
- Tax from tax record
- −$199 /mo · $2,384/yr
- Insurance
- −$83
- HOA
- −$0
- Vacancy / Maint / Mgmt
- −$366
- Net cashflow
- $51
Break-even live
UW: 25.0% down · 7.5% · 30yr · 1.5% tax · 5.0% vac · 8.0% maint · 8.0% mgmt
Financing live
Cash to close
- Down payment
- $49,750
- Closing costs
- $5,970
- Reserves months
- —
- Total cash needed
- —
Loan-product check · same deal, 3 products live
Conventional
25% down · 7.5% · 30yr
- Down + closing
- —
- Monthly P&I
- —
- Monthly cashflow
- —
- DSCR
- —
- Eligible?
- —
Personal DTI + credit; lowest rate.
DSCR
20% down · 8.5% · 30yr
- Down + closing
- —
- Monthly P&I
- —
- Monthly cashflow
- —
- DSCR
- —
- Eligible?
- —
No personal income docs; deal must DSCR.
Hard money
10% down · 12.0% · 12mo
- Down + closing
- —
- Monthly P&I
- —
- Monthly cashflow
- —
- DSCR
- —
- Eligible?
- —
Short-term bridge; refi at stabilization.
Rent comps 6 comps
| Address | Beds | Baths | Sqft | Rent | $/sqft | DOM | Units | Dist |
|---|---|---|---|---|---|---|---|---|
| 1610 Elizabeth St Gainesville, TX | 3.0 | 1.0 | 1100 | $1,500 | $1.36 | 43d | 1 | 0.15mi |
| 426 N Clements St Gainesville, TX | 3.0 | 2.0 | 1408 | $2,307 | $1.64 | 43d | 1 | 0.44mi |
| 1010 E Main St Gainesville, TX | 3.0 | 1.0 | 1263 | $1,550 | $1.23 | 43d | 1 | 0.82mi |
| 1331 Lanius St Gainesville, TX | 3.0 | 2.0 | 1300 | $1,850 | $1.42 | 43d | 1 | 1.10mi |
| 1000 Bella Vista Dr Gainesville, TX | 3.0 | 2.0 | 1150 | $1,536 | $1.34 | 43d | 1 | 1.11mi |
| 923 S Wine St Gainesville, TX | 3.0 | 1.0 | 1216 | $1,550 | $1.27 | 43d | 1 | 1.23mi |
Listing history 3 events
-
2026-06-19days on market $199,000 Active 2 DOM
-
2026-06-17remarks 699-char remark
-
2026-06-17$199,000 Active 1 DOM
ⓘ Source: listings_history table (triggers on properties + properties_extension) + one-shot
backfill from property_details.listing_events for pre-trigger history.
Tax reassessment forecast TX · Resets to sale price
- Current annual tax
- $2,384 · $199/mo
- Projected year-2 tax
- $3,642 · $303/mo
- Expected delta
- +$1,258/yr (+$105/mo · 52.8%)
ⓘ Screening estimate from a state-policy table — verify with the county assessor before closing.
Climate risk First Street
- Flood 1/10 Low FEMA zone X (unshaded) · 0% chance over 30 yrs
- Wildfire 7/10 Severe
- Heat 6/10 Major 7 d/yr ≥110°F today · 20 d/yr by 30 yrs out
- Wind 4/10 Moderate 17% chance of damaging wind over 30 yrs
- Air quality 3/10 Moderate 3 unhealthy d/yr today · 4 by 30 yrs out
Nearby sold comps map
Loading sold comps map…
Walkable amenities ~0.75 mi
Loading nearby amenities…
Taxation est. · year 1
- Rental income
- $20,903
- − Mortgage interest
- −$11,147
- − Property taxes
- −$2,384
- − Insurance
- −$995
- − Repairs & maintenance
- −$1,672
- − Management
- −$1,672
- − Depreciation
- −$5,789
- Taxable loss
- −$2,756
- Est. tax savings @ 24.0%
- +$662
- After-tax cash flow
- $1,273/yr
For passive investors: Depreciation is non-cash, so a rental often shows a tax loss while cash-flowing — sheltering income. Rental losses are passive: they offset passive income freely, and up to $25,000/yr can offset ordinary (W-2) income if you actively participate and your MAGI is under $100k (phasing out to $0 by $150k); unused losses carry forward. On sale, claimed depreciation is recaptured at up to 25%, and gains may owe capital-gains tax (a 1031 exchange can defer both). Figures are a year-1 estimate at your 24.0% rate — not tax advice; consult a CPA.
Schools (NCES district)
- District
- Gainesville ISD
- NCES district ID
- 4820220
- Math proficiency
- 33% ▼ -9.00%
- Reading proficiency
- 29% ▼ -2.00%
- Median HH income
- $41,772
- Composite
- 26.27/100
- National rank
- #7252
- State rank
- #606 of 826 in TX
Livability — Gainesville
- Score
- 66/100
- State rank
- #602
- US rank
- #11445
Category grades
Schools grade is shown separately in the Schools card above.
Census & demographics
- Census place
- Gainesville, TX
- County
- Cooke County · 29,419 people
- City population
- 29,419
- Metro
- Gainesville, TX
- Population (ZIP)
- 29,419
- Household income
- $71,502
- Rent vs Own
- Severe rent burden
- 660.0
Population outlook (Cooke County) Hauer SSP2
- Today (2025)
- 39,965 people
- By 2030
- 39,974 · +0.0%
- By 2040
- 39,772 · -0.5%
- By 2050
- 39,258 · -1.8%
- By 2075
- 37,262 · -6.8%
- By 2100
- 33,363 · -16.5%
Race, ethnicity, and origin ACS 2023
- Neighborhood character
- Predominantly White (66%)
- Race & ethnicity
- White 66% Hispanic / Latino 24% Two or more races 14% Black 5%
- Hispanic origin (detail)
- Mexican 21%
- Common ancestry
- Serbian 2% Lithuanian 2% Slovak 1%
- Foreign-born
- 8% · Canada
- Languages at home
- 83% English-only · Spanish 16% Other Indo-European 1%
Political lean MEDSL · Cooke
- 2024 margin
- Solid R (+66.9) · D 16.2% · R 83.1%
- 2008→2024 swing
- -8.2pp toward R · 2008: -58.7pp · 2024: -66.9pp
- All cycles
- 2024: R+66.9 2020: R+65.2 2016: R+68.1 2012: R+67.6 2008: R+58.7
Not yet ingested
- Civics
- —
Market trends
- HPI YoY
- ▼ -198.63%
- Current HPI
- 247.3822
- Rent YoY
- —
- Metro
- Gainesville, TX
- State GDP YoY
- ▲ 3.95%
- F500 in state
- 110
Industry mix (Fortune 500 HQ in TX)
| Industry | F500 HQs | Revenue |
|---|---|---|
| Energy | 16 | $1,198B |
|
||
| Technology | 5 | $198B |
|
||
| Engineering / Construction | 4 | $72B |
|
||
| Energy Services | 3 | $60B |
|
||
| Utilities | 3 | $41B |
|
||
| Healthcare | 2 | $330B |
|
||
Price history
+176.4% since first listed14 events — show timeline
- 2026-06-17 Listed $199,000 NTREIS
- 2026-06-12 Listed for Rent $1,995 TURBOTENANT
- 2025-11-19 Sold (Public Records) — Public Records
- 2024-01-13 Rental Removed $2,195 APPFOLIO
- 2024-01-04 Price Changed $2,195 APPFOLIO
- 2023-12-24 Price Changed $2,295 APPFOLIO
- 2023-12-07 Listed for Rent $2,195 APPFOLIO
- 2022-12-21 Sold (Public Records) — Public Records
- 2019-07-01 Sold (Public Records) — Public Records
- 2015-10-14 Sold (Public Records) $43,500 Public Records
- 2015-10-12 Sold (MLS) — NTREIS
- 2015-09-01 Listing Removed — NTREIS
- 2015-07-06 Listed $72,000 NTREIS
- 2005-09-19 Sold (Public Records) — Public Records
Property tax history
+4.3%/yrLatest (2025): $2,384 · +25.8% YoY. Source: county tax records.
Cash-flow waterfall
monthlySold comps — $/sqft
last 12 mo · ≤1 miLoading sold comps…