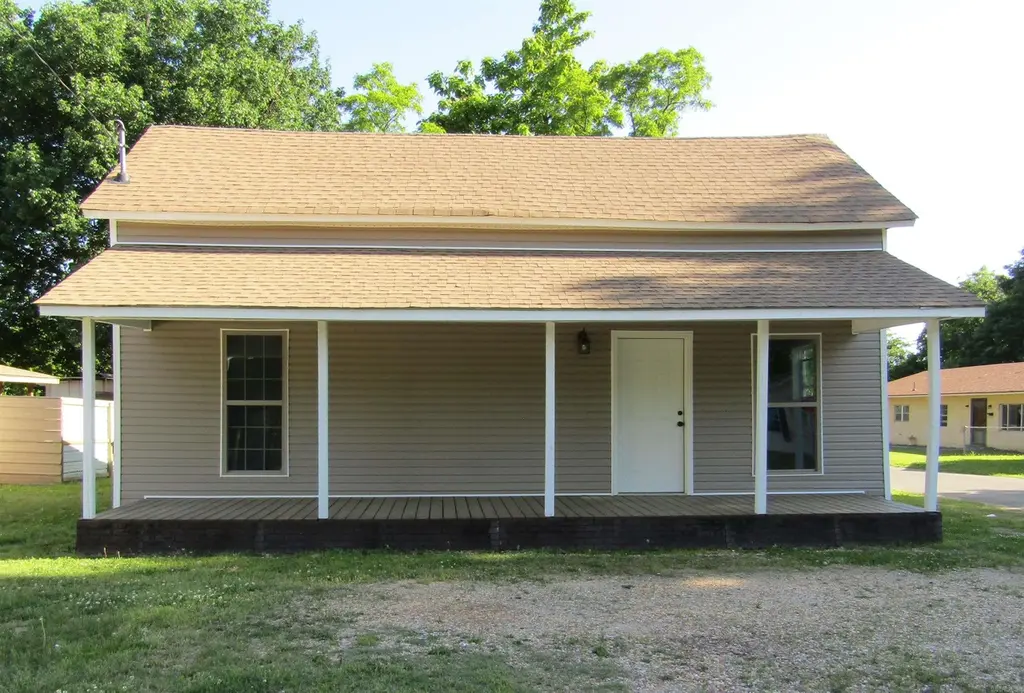
706 E Lake St · Paragould, AR
Flood risk 1/10 · Minimal
- FEMA flood zone
- X (unshaded)
- Chance of flooding over 30 yrs
- 0.0%
- Est. flood insurance / yr
- $507 – $1,088
Fire risk 1/10 · Minimal
- Est. fire insurance / yr
- $1,499 – $2,785
Heat risk 6/10 · Moderate
- Hot days now (above 109°F)
- 7 days/yr
- Hot days in 30 yrs
- 20 days/yr
Wind risk 3/10 · Minor
- Chance of severe wind over 30 yrs
- 7.0%
Air-quality risk 1/10 · Minimal
- Unhealthy air days now
- 0 days/yr
- Unhealthy air days in 30 yrs
- 0 days/yr
Risk factors via First Street. Map © Google.
Why this score? — see what drove the C grade
The composite is a weighted blend of 9 inputs, each scored 0–100. Each bar is that input's sub-score; the figure is the points it added to the 100-point composite (weight × sub-score).
- Cash flow +28.5/30.0
- DSCR +10.0/10.0
- 1% rule +6.7/10.0
- Livability +3.2/5.0
- Schools +2.9/10.0
- Rent growth +2.5/5.0
- Condition / age +2.5/5.0
- ARV discount +0.0/15.0
- Appreciation +0.0/10.0
$69,500
🖨 Deal sheet 📄 Offer letter ✓ Due diligence
Listing remarks
Affordable, recently remodeled 2-bedroom home. Updated 2-Bedroom, 1 Bath house located in a well-established neighborhood. Remodeled with modern finishes, comfortable, and functional layout. Perfect for first time home buyers or as an investment property. Convenient location with easy access to nearby amenities. A great opportunity to own a move-in ready home at an affordable price!
Key facts
- 6,969 sq ft lot
- Built 1970
- Listed 44 days
Property features AI
Exterior
- Parking: Side entry parking
- Utilities: Public sewer; Public water; Electric service (municipal plus Entergy)
- Home design: Single-family property; Property in BRAMLETT subdivision
- Construction: Metal or vinyl siding exterior; Crawl space foundation; Rolled roof
- Exterior features: Paved road access; Corner lot; Inside city limits
Interior
- Flooring: Carpet
- Bathrooms: 1 full bathroom
- Heating & cooling: Window air conditioning units
- Interior features: Carpet flooring; Laundry room
- Laundry & utility: Laundry area
Neighborhood map
What this means for you Summary
Snapshot
- This is a 2-bed/1.0-bath single-family listed at $70k.
Deal economics
- At list price, monthly cash flow is $228 ($3k/yr) — positive.
- The deal already cash-flows at list — no discount required.
- Meets the 1% rule at list price ($813 rent vs $70k).
- Recommended offer: $67k (3.0% below list) — sets the bar for market timing.
- Cap rate 10.2% vs local median 4.5% in Paragould — top-decile yield for the area; either an underpriced asset or a hidden risk that comps aren't pricing in. Stress-test before assuming the spread holds.
Location & tenants
- Location reads 65/100 on livability (#159 in AR) — a middle-class / working-renter tenant base. Strengths: cost of living A+, housing A+, health & safety A+; Watch: schools D+, crime F, amenities F.
- Paragould School District (town): math 35% / reading 34% proficiency, ranked #124 of 238 in AR (top 52%) — families likely to look elsewhere, expect single-tenant / working-renter base with shorter leases.
- Market conditions: 187 active listings in the ZIP; 13 comparable units currently listed for rent nearby; rentals lingering (median 44d on market — plan ~5-8 weeks vacancy on turnover, expect pricing pressure); 100% of comp listings sitting > 30 days — soft ceiling on asking rent; 265 units permitted in Greene County in 2024 (135 in 5+ unit buildings).
- This rent is only 17% of the median local income ($58k/yr) — well below the 30% rent-burden line; pricing power to push rent on renewal without tenant pushback.
Forward outlook
- Local home prices are declining (-3.0%/yr); year-one equity from $481 of loan paydown is wiped out by about $2k of value loss. Plan a longer hold.
- Greene County population projected at +20% by 2050 — long-run rental-demand tailwind backs the buy-and-hold thesis.
- At projected returns (-3.0% appreciation + 3.0% rent growth), your $19k cash investment doubles in ~9 years — after that, you're playing with house money.
Negotiation context
- It's been on market 45 days — a 3% lower offer ($67k) is reasonable based on typical stale-listing flexibility.
- Current owner paid $30k; list at $70k implies a 132% gain — meaningful room to come down on a strong offer.
Risks & watch-outs
- Climate carrying-cost: extreme-heat days projected 7→20/yr by 2055 (HVAC capex compounding) — expect insurance premiums to compound above CPI over the hold.
Questions for the listing agent
- It's been on market 45 days. Have you received any prior offers? Is the seller open to a 3% concession, seller financing, or rate buy-down credit?
- Built in 1970 — when were the roof, HVAC, electrical panel, plumbing, and water heater last replaced?
- Is there a deadline driving the sale (1031 exchange, divorce, estate, relocation)? That informs how much negotiation room exists.
- Schools are D-rated, which usually means shorter tenancies and higher turnover. Who's the typical renter profile here, and what's been the actual vacancy rate?
- Crime grade is F in this area — have there been break-ins, vandalism, or insurance claims at this property in the last 3 years? What carrier currently insures it and at what premium?
- What's the average days-on-market for RENTAL listings here right now (not sales)? A rising rental-DOM trend means longer vacancies and softer asking-rent achievability than the comps imply.
- What's the recent tenant-quality profile in this submarket — average credit score on applications, eviction rate, late-payment / NSF rate, and stable-employment percentage? A property-management company in the area should have these aggregated.
- How much new for-sale + rental construction is in the pipeline within 1–3 miles? Heavy new supply typically softens prices + rents 12–24 months out; constrained supply supports both.
Investment metrics
- 1% rule
- 1.17% ✓
- Cap rate
- 10.23%
- Cash-on-cash
- 14.06%
- DSCR
- 1.63
- GRM
- 7.1
CMA / ARV
- ARV (median comp)
- $58,290
- List price
- $69,500
- Delta
- 19.23%
- Verdict
- OVERPRICED
- Comps
- 20 within 1.0 mi
Show comp detail 11 sales within ~0.75 mi
| Address | Dist | Beds/Ba | Sqft | Sold | Price | $/sf | Match |
|---|---|---|---|---|---|---|---|
| 412 E Poplar St | 0.29mi | 2/1.0 | 860 (+1%) | 1mo | $46,500 | $54 | 84 |
| 205 N 4th Ave | 0.31mi | 2/1.0 | 832 (-2%) | 5mo | $76,500 | $92 | 77 |
| 617 E Poplar | 0.07mi | 2/1.0 | 896 (+5%) | 17mo | $28,000 | $31 | 74 |
| 705 S 6th Ave | 0.56mi | 2/1.0 | 884 (+4%) | 2mo | $68,000 | $77 | 66 |
| 435 E Main St | 0.34mi | 2/1.0 | 869 (+2%) | 23mo | $134,000 | $154 | 62 |
| 108 N 4th Ave | 0.35mi | 3/1.0 (+1) | 784 (-8%) | 7mo | $120,000 | $153 | 59 |
| 831 Rector Rd | 0.60mi | 3/1.0 (+1) | 864 (+1%) | 10mo | $35,000 | $41 | 57 |
| 1004 Rector Rd | 0.71mi | 2/1.0 | 780 (-9%) | 8mo | $31,000 | $40 | 46 |
| 619 N 3rd St | 0.68mi | 2/1.0 | 725 (-15%) | 7mo | $121,000 | $167 | 37 |
| 713 Gentry St | 0.70mi | 2/1.0 | 768 (-10%) | 17mo | $59,900 | $78 | 37 |
| 303 C St | 0.66mi | 3/1.0 (+1) | 936 (+10%) | 22mo | $72,000 | $77 | 30 |
Match score weights: distance 35% · size 25% · config 20% · recency 20%. Top-matched comps best support the ARV.
Projected returns pro-forma
-3.0% appreciation · 3.0% rent growth · sell at horizon
- IRR
- 4.3%
- Equity multiple
- 1.17×
- Total profit
- $3,237
- Equity at exit
- $10,363
- IRR
- 13.8%
- Equity multiple
- 2.10×
- Total profit
- $21,410
- Equity at exit
- $6,009
Cash invested: $19,460 (down + closing). Projections, not guarantees.
Landlord ↔ Tenant lean methodology
- Overall (STATE)
- 92 Strongly Landlord-Friendly
- State Arkansas
- 92 Strongly Landlord-Friendly · R+14
- County
- — inherits STATE
- City
- — inherits STATE
ZIP-level market 72450
- Home prices YoY
- -8.9%
- Active inventory
- 187
- Price-to-rent
- 7.1×
Monthly cashflow live
- Estimated rent
- $813 high interval (Pro) →
- Mortgage (P&I)
- −$364
- Tax from tax record
- −$21 /mo · $253/yr
- Insurance
- −$29
- HOA
- −$0
- Vacancy / Maint / Mgmt
- −$171
- Net cashflow
- $228
Break-even live
UW: 25.0% down · 7.5% · 30yr · 1.5% tax · 5.0% vac · 8.0% maint · 8.0% mgmt
Financing live
Cash to close
- Down payment
- $17,375
- Closing costs
- $2,085
- Reserves months
- —
- Total cash needed
- —
Loan-product check · same deal, 3 products live
Conventional
25% down · 7.5% · 30yr
- Down + closing
- —
- Monthly P&I
- —
- Monthly cashflow
- —
- DSCR
- —
- Eligible?
- —
Personal DTI + credit; lowest rate.
DSCR
20% down · 8.5% · 30yr
- Down + closing
- —
- Monthly P&I
- —
- Monthly cashflow
- —
- DSCR
- —
- Eligible?
- —
No personal income docs; deal must DSCR.
Hard money
10% down · 12.0% · 12mo
- Down + closing
- —
- Monthly P&I
- —
- Monthly cashflow
- —
- DSCR
- —
- Eligible?
- —
Short-term bridge; refi at stabilization.
Rent comps 13 comps
| Address | Beds | Baths | Sqft | Rent | $/sqft | DOM | Units | Dist |
|---|---|---|---|---|---|---|---|---|
| 528 E Lake St Paragould, AR | 3.0 | 1.0 | 1088 | $695 | $0.64 | 43d | 1 | 0.11mi |
| 504 S 3rd Ave Unit 2 Paragould, AR | 1.0 | 1.0 | 532 | $750 | $1.41 | 43d | 1 | 0.56mi |
| 204 N 16th Ave Apt 1 Paragould, AR | 1.0 | 1.0 | 900 | $725 | $0.81 | 43d | 1 | 0.60mi |
| 800 S 3rd Ave Paragould, AR | 2.0 | 1.0 | 875 | $900 | $1.03 | 43d | 1 | 0.74mi |
| 700 S 4th St Unit 1 Paragould, AR | 2.0 | 1.0 | 942 | $725 | $0.77 | 43d | 1 | 0.91mi |
| 405 N 7th St Unit 415 Paragould, AR | 2.0 | 1.0 | 800 | $940 | $1.18 | 43d | 1 | 0.96mi |
| 506 W Mueller Apt 3 Paragould, AR | 1.0 | 1.0 | 719 | $695 | $0.97 | 43d | 1 | 1.11mi |
| 1205 W Hunt St Unit 1 Paragould, AR | 2.0 | 1.0 | 800 | $825 | $1.03 | 43d | 1 | 1.38mi |
| 1204 S 8th St Unit 2 Paragould, AR | 2.0 | 1.0 | 979 | $950 | $0.97 | 43d | 1 | 1.44mi |
| 603 Wirt St Apt 1 Paragould, AR | 2.0 | 1.0 | 840 | $725 | $0.86 | 43d | 1 | 1.44mi |
| 605 Wirt St Apt 8 Paragould, AR | 2.0 | 1.0 | 840 | $725 | $0.86 | 43d | 1 | 1.45mi |
| 804 Ada St Unit 3 Paragould, AR | 2.0 | 1.0 | 1059 | $950 | $0.90 | 43d | 1 | 1.46mi |
| 812 Ada St Unit 3 Paragould, AR | 2.0 | 1.0 | 975 | $950 | $0.97 | 43d | 1 | 1.49mi |
Listing history 19 events
-
2026-06-19days on market $69,500 Active 45 DOM
-
2026-06-18days on market $69,500 Active 44 DOM
-
2026-06-17days on market $69,500 Active 43 DOM
-
2026-06-16days on market $69,500 Active 42 DOM
-
2026-06-15days on market $69,500 Active 41 DOM
-
2026-06-14days on market $69,500 Active 39 DOM
-
2026-06-12days on market $69,500 Active 38 DOM
-
2026-06-09days on market $69,500 Active 35 DOM
-
2026-06-08days on market $69,500 Active 34 DOM
-
2026-06-07days on market $69,500 Active 33 DOM
-
2026-06-05days on market $69,500 Active 30 DOM
-
2026-06-03days on market $69,500 Active 29 DOM
-
2026-06-02days on market $69,500 Active 28 DOM
-
2026-06-01days on market $69,500 Active 27 DOM
-
2026-05-31days on market $69,500 Active 26 DOM
-
2026-05-30days on market $69,500 Active 25 DOM
-
2026-05-05$69,500 New Listing 385-char remark
-
2022-05-06soldstatus $30,000
-
2012-07-13soldstatus $73,000
ⓘ Source: listings_history table (triggers on properties + properties_extension) + one-shot
backfill from property_details.listing_events for pre-trigger history.
Tax reassessment forecast AR · Resets to sale price
- Current annual tax
- $253 · $21/mo
- Projected year-2 tax
- $445 · $37/mo
- Expected delta
- +$192/yr (+$16/mo · 76.1%)
ⓘ Screening estimate from a state-policy table — verify with the county assessor before closing.
Climate risk First Street
- Flood 1/10 Low FEMA zone X (unshaded) · 0% chance over 30 yrs
- Wildfire 1/10 Low
- Heat 6/10 Major 7 d/yr ≥109°F today · 20 d/yr by 30 yrs out
- Wind 3/10 Moderate 7% chance of damaging wind over 30 yrs
- Air quality 1/10 Low 0 unhealthy d/yr today · 0 by 30 yrs out
Nearby sold comps map
Loading sold comps map…
Walkable amenities ~0.75 mi
Loading nearby amenities…
Taxation est. · year 1
- Rental income
- $9,760
- − Mortgage interest
- −$3,893
- − Property taxes
- −$253
- − Insurance
- −$348
- − Repairs & maintenance
- −$781
- − Management
- −$781
- − Depreciation
- −$2,022
- Taxable income
- $1,684
- Est. tax owed @ 24.0%
- −$404
- After-tax cash flow
- $2,333/yr
For passive investors: Depreciation is non-cash, so a rental often shows a tax loss while cash-flowing — sheltering income. Rental losses are passive: they offset passive income freely, and up to $25,000/yr can offset ordinary (W-2) income if you actively participate and your MAGI is under $100k (phasing out to $0 by $150k); unused losses carry forward. On sale, claimed depreciation is recaptured at up to 25%, and gains may owe capital-gains tax (a 1031 exchange can defer both). Figures are a year-1 estimate at your 24.0% rate — not tax advice; consult a CPA.
Schools (NCES district)
- District
- Paragould School District
- NCES district ID
- 0500017
- Math proficiency
- 35% ▼ -15.00%
- Reading proficiency
- 34% ▼ -12.00%
- Median HH income
- $36,644
- Composite
- 28.67/100
- National rank
- #6696
- State rank
- #124 of 238 in AR
Livability — Paragould
- Score
- 65/100
- State rank
- #159
- US rank
- #13582
Category grades
Schools grade is shown separately in the Schools card above.
Census & demographics
- Census place
- Paragould, AR
- County
- Greene County · 40,807 people
- City population
- 40,807
- Metro
- Paragould, AR
- Population (ZIP)
- 40,807
- Household income
- $57,725
- Rent vs Own
- Severe rent burden
- 1297.0
Population outlook (Greene County) Hauer SSP2
- Today (2025)
- 48,533 people
- By 2030
- 50,640 · +4.3%
- By 2040
- 54,795 · +12.9%
- By 2050
- 58,486 · +20.5%
- By 2075
- 66,056 · +36.1%
- By 2100
- 67,684 · +39.5%
Race, ethnicity, and origin ACS 2023
- Neighborhood character
- Predominantly White (89%)
- Race & ethnicity
- White 89% Two or more races 6% Hispanic / Latino 4% Black 3%
- Common ancestry
- Italian 2% Slovak 1% Romanian 1%
- Foreign-born
- 1% · Canada
- Languages at home
- 98% English-only · Spanish 1%
Political lean MEDSL · Greene
- 2024 margin
- Solid R (+61.2) · D 18.6% · R 79.8% · Other 1.7%
- 2008→2024 swing
- -31.5pp toward R · 2008: -29.7pp · 2024: -61.2pp
- All cycles
- 2024: R+61.2 2020: R+59.7 2016: R+53.0 2012: R+36.9 2008: R+29.7
Not yet ingested
- Civics
- —
Market trends
- HPI YoY
- ▼ -23.15%
- Current HPI
- 236.1404
- Rent YoY
- —
- Metro
- Paragould, AR
- State GDP YoY
- ▲ 3.80%
- F500 in state
- 10
Industry mix (Fortune 500 HQ in AR)
| Industry | F500 HQs | Revenue |
|---|---|---|
| Retail | 1 | $681B |
|
||
| Food / Agriculture | 1 | $53B |
|
||
| Retail / Energy | 1 | $22B |
|
||
| Transportation / Logistics | 1 | $12B |
|
||
| Energy | 1 | $4B |
|
||
Price history
-65.1% since first listed4 events — show timeline
- 2026-05-05 Listed $69,500 CARMLS
- 2022-05-06 Sold (Public Records) $30,000 Public Records
- 2012-07-13 Sold (Public Records) $73,000 Public Records
- 2008-07-28 Sold (Public Records) $199,000 Public Records
Property tax history
+2.4%/yrLatest (2025): $253 · +0.7% YoY. Source: county tax records.
Cash-flow waterfall
monthlySold comps — $/sqft
last 12 mo · ≤1 miLoading sold comps…