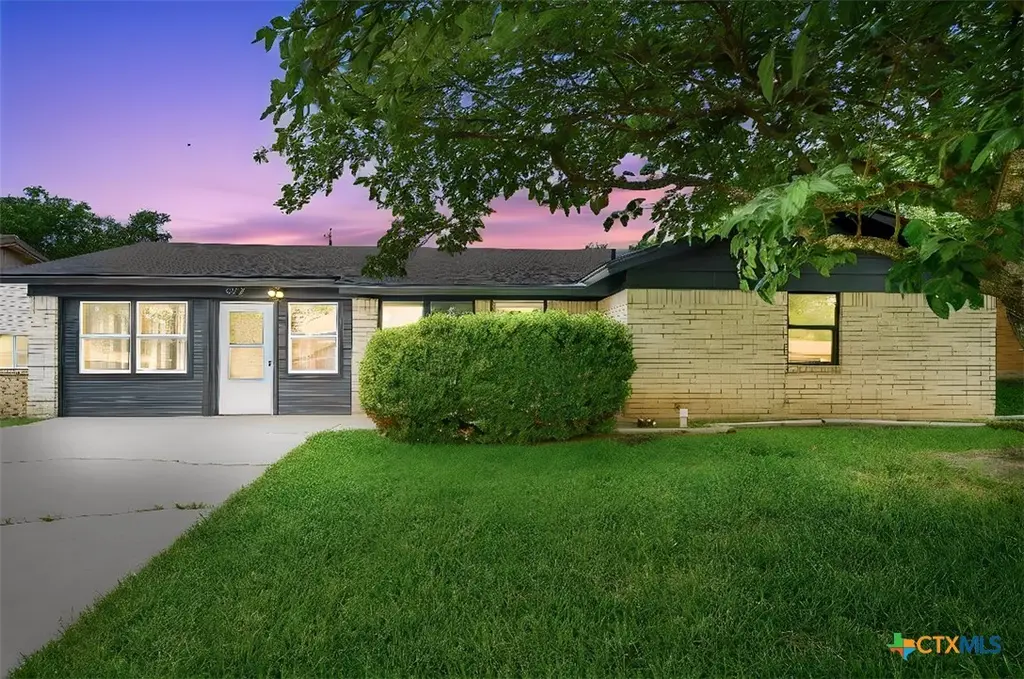
917 Holly St · Copperas Cove, TX
Flood risk 1/10 · Minimal
- FEMA flood zone
- X (unshaded)
- Chance of flooding over 30 yrs
- 0.0%
- Est. flood insurance / yr
- $507 – $1,088
Fire risk 6/10 · Moderate
- Est. fire insurance / yr
- $1,222 – $2,270
Heat risk 7/10 · Major
- Hot days now (above 106°F)
- 7 days/yr
- Hot days in 30 yrs
- 24 days/yr
Wind risk 6/10 · Moderate
- Chance of severe wind over 30 yrs
- 48.0%
Air-quality risk 1/10 · Minimal
- Unhealthy air days now
- 0 days/yr
- Unhealthy air days in 30 yrs
- 0 days/yr
Risk factors via First Street. Map © Google.
Why this score? — see what drove the D grade
The composite is a weighted blend of 9 inputs, each scored 0–100. Each bar is that input's sub-score; the figure is the points it added to the 100-point composite (weight × sub-score).
- Cash flow +12.7/30.0
- ARV discount +10.7/15.0
- DSCR +3.8/10.0
- 1% rule +3.7/10.0
- Schools +3.6/10.0
- Livability +3.2/5.0
- Condition / age +2.5/5.0
- Rent growth +2.4/5.0
- Appreciation +0.0/10.0
$165,000
🖨 Deal sheet (PDF) 📄 Offer letter ✓ Due diligence
Listing remarks MLS
This 3/2 home is conveniently located in a well established neighborhood. Vacant and ready for new owners. * * VA Property. CHL Pre-qual required on all offers. Free appraisal and credit report if buyer finances thru CHL. Please allow 2-3 days for seller response. Cash offers require proof of funds. VA will look at cash offers on this property.
Key facts
- Outbuilding
- Screened-in patio
- Great room
Tags
Property features AI
Finance
- HOA & community: Curbs and sidewalks
Exterior
- Parking: Converted garage
- Utilities: High-speed internet available; Public water; Public sewer; Public trash collection
- Home design: Single-story home; Resale property; Slab foundation; Facing information not provided
- Construction: Brick and masonry construction; Composition/shingle roof; Built year source: assessor
- Exterior features: Enclosed porch; Covered porch; Screened porch; Patio; Storage; Wood privacy fencing in back yard
Interior
- Kitchen: Dishwasher; Electric range; Range hood; Refrigerator
- Bedrooms: Bedroom 2; Bedroom 3
- Flooring: Laminate flooring; Tile flooring
- Bathrooms: 2 full bathrooms
- Heating & cooling: Central heating (electric); Central air conditioning (electric, one unit)
- Interior features: Ceiling fans; Multiple living areas; Separate shower; Shower only; Tub/shower combination; Vanity; Walk-in closets; Eat-in kitchen; Kitchen/dining combo
- Laundry & utility: Washer hookup; Electric dryer hookup; Inside laundry room
Neighborhood map
What this means for you Summary
Snapshot
- This is a 3-bed/2.0-bath single-family listed at $165k.
Deal economics
- At list price, monthly cash flow is $-17 ($-202/yr) — negative.
- To cash-flow at today's rent, offer at most $162k (1.8% below list).
- To meet the 1% rule (rent ≥ 1% of price), the offer needs to be $144k (12.7% below list).
- Recommended offer: $144k (12.7% below list) — sets the bar for 1% rule.
- Cap rate 6.2% vs local median 3.5% in Copperas Cove — top-decile yield for the area; either an underpriced asset or a hidden risk that comps aren't pricing in. Stress-test before assuming the spread holds.
Location & tenants
- Location reads 65/100 on livability (#706 in TX) — a middle-class / working-renter tenant base. Strengths: cost of living A+, housing A+; Watch: employment D+, amenities F, commute F.
- Copperas Cove ISD (suburban): math 41% / reading 42% proficiency, ranked #340 of 826 in TX (top 41%) — families likely to look elsewhere, expect single-tenant / working-renter base with shorter leases.
- Zoned schools: C R Clements/Hollie Parsons El (math 51% / reading 46%, grade D, #950 of 4,322 statewide, top 22%, 817 students, 68% FRL); Copperas Cove J H (math 43% / reading 42%, grade D-, #553 of 1,662 statewide, top 34%, 924 students, 63% FRL); Copperas Cove H S (math 29% / reading 42%, grade F, #941 of 1,632 statewide, top 58%, 2,277 students, 52% FRL) — zoned schools average 61% FRL vs 41% district-wide (20 pts higher); higher-poverty schools than district average — tighter screening recommended.
- Market conditions: Rents soft (-0.2%/yr); 610 active listings in the ZIP; 40 comparable units currently listed for rent nearby; rentals lingering (median 46d on market — plan ~5-8 weeks vacancy on turnover, expect pricing pressure); 62% of comp listings sitting > 30 days — soft ceiling on asking rent; 386 units permitted in Coryell County in 2024 (0 in 5+ unit buildings).
Forward outlook
- Local home prices are declining (-3.0%/yr); year-one equity from $1k of loan paydown is wiped out by about $5k of value loss. Plan a longer hold.
Negotiation context
- It's been on market 53 days — a 3% lower offer ($160k) is reasonable based on typical stale-listing flexibility.
- 5 sale attempts since 21y ago with the ask held roughly flat each time — persistent listings suggest the price (not the market) is what's stuck; bring a comps-based counter.
Risks & watch-outs
- Climate carrying-cost: major wind risk, 48% chance of damaging wind over 30y; major wildfire risk; extreme-heat days projected 7→24/yr by 2055 (HVAC capex compounding) — expect insurance premiums to compound above CPI over the hold.
Questions for the listing agent
- What do current leases actually rent for vs. the listed asking? Can we see a recent rent roll and the last 12 months of T-12 income?
- It's been on market 53 days. Have you received any prior offers? Is the seller open to a 13% concession, seller financing, or rate buy-down credit?
- Built in 1973 — when were the roof, HVAC, electrical panel, plumbing, and water heater last replaced?
- Is there a deadline driving the sale (1031 exchange, divorce, estate, relocation)? That informs how much negotiation room exists.
- The area grade is low — what's the realistic commute time and amenity access for the typical tenant pool here? Any planned neighborhood developments (good or bad) we should know about?
- What's the average days-on-market for RENTAL listings here right now (not sales)? A rising rental-DOM trend means longer vacancies and softer asking-rent achievability than the comps imply.
- What's the recent tenant-quality profile in this submarket — average credit score on applications, eviction rate, late-payment / NSF rate, and stable-employment percentage? A property-management company in the area should have these aggregated.
- How much new for-sale + rental construction is in the pipeline within 1–3 miles? Heavy new supply typically softens prices + rents 12–24 months out; constrained supply supports both.
Investment metrics
- 1% rule
- 0.87% ✗
- Cap rate
- 6.17%
- Cash-on-cash
- -0.44%
- DSCR
- 0.98
- GRM
- 9.5
CMA / ARV
- ARV (median comp)
- $177,771
- List price
- $165,000
- Delta
- -7.18%
- Verdict
- FAIR
- Comps
- 20 within 1.0 mi
Show comp detail 12 sales within ~0.75 mi
| Address | Dist | Beds/Ba | Sqft | Sold | Price | $/sf | Match |
|---|---|---|---|---|---|---|---|
| 902 Holly St | 0.10mi | 3/2.0 | 1,606 (+4%) | 4mo | $115,000 | $72 | 86 |
| 1001 Gilmore St | 0.26mi | 3/2.0 | 1,575 (+2%) | 4mo | $167,000 | $106 | 82 |
| 1602 Phyllis Dr | 0.14mi | 4/2.0 (+1) | 1,623 (+5%) | 1mo | $135,000 | $83 | 79 |
| 1107 Deorsam Dr | 0.22mi | 3/2.0 | 1,485 (-4%) | 5mo | $172,200 | $116 | 79 |
| 904 Randa St | 0.10mi | 4/2.0 (+1) | 1,638 (+6%) | 4mo | $234,000 | $143 | 78 |
| 1709 Pleasant Ln | 0.29mi | 3/2.0 | 1,429 (-8%) | 0mo | $187,500 | $131 | 73 |
| 2211 Phyllis Dr | 0.48mi | 3/2.0 | 1,573 (+1%) | 3mo | $190,000 | $121 | 73 |
| 2311 Tiffany Dr | 0.69mi | 3/2.0 | 1,532 (-1%) | 1mo | $218,000 | $142 | 65 |
| 1907 Miles St | 0.67mi | 3/1.5 | 1,527 (-2%) | 1mo | $164,900 | $108 | 64 |
| 2002 Patricia St | 0.55mi | 3/2.0 | 1,364 (-12%) | 6mo | $185,000 | $136 | 49 |
| 604 Yucca Dr | 0.67mi | 3/2.0 | 1,724 (+11%) | 1mo | $142,000 | $82 | 49 |
| 1010 Timmons Dr | 0.68mi | 3/2.0 | 1,748 (+13%) | 3mo | $239,500 | $137 | 44 |
Match score weights: distance 35% · size 25% · config 20% · recency 20%. Top-matched comps best support the ARV.
Projected returns pro-forma
-3.0% appreciation · 0.0% rent growth · sell at horizon
- IRR
- -20.5%
- Equity multiple
- 0.31×
- Total profit
- $-32,000
- Equity at exit
- $24,602
- IRR
- -22.4%
- Equity multiple
- 0.02×
- Total profit
- $-45,435
- Equity at exit
- $14,266
Cash invested: $46,200 (down + closing). Projections, not guarantees.
Landlord ↔ Tenant lean methodology
- Overall (STATE)
- 87 Strongly Landlord-Friendly
- State Texas
- 87 Strongly Landlord-Friendly · R+5
- County
- — inherits STATE
- City
- — inherits STATE
ZIP-level market 76522
- Home prices YoY
- -22.4%
- Rents YoY
- -0.2%
- Active inventory
- 610
- Price-to-rent
- 9.5×
Monthly cashflow live
- Estimated rent
- $1,441 high interval (Pro) →
- Mortgage (P&I)
- −$865
- Tax from tax record
- −$221 /mo · $2,650/yr
- Insurance
- −$69
- HOA
- −$0
- Vacancy / Maint / Mgmt
- −$303
- Net cashflow
- $-17
Break-even live
Sensitivity live
| Price | -10% $77 | -5% $30 | +0% $-17 | +5% $-64 | +10% $-110 |
|---|---|---|---|---|---|
| Rent | -10% $-131 | -5% $-74 | +0% $-17 | +5% $40 | +10% $97 |
| Rate | -1.0pp $66 | -0.5pp $25 | base $-17 | +0.5pp $-60 | +1.0pp $-103 |
UW: 25.0% down · 7.5% · 30yr · 1.5% tax · 5.0% vac · 8.0% maint · 8.0% mgmt
Financing live
Cash to close
- Down payment
- $41,250
- Closing costs
- $4,950
- Reserves months
- —
- Total cash needed
- —
Loan-product check · same deal, 3 products live
Conventional
25% down · 7.5% · 30yr
- Down + closing
- —
- Monthly P&I
- —
- Monthly cashflow
- —
- DSCR
- —
- Eligible?
- —
Personal DTI + credit; lowest rate.
DSCR
20% down · 8.5% · 30yr
- Down + closing
- —
- Monthly P&I
- —
- Monthly cashflow
- —
- DSCR
- —
- Eligible?
- —
No personal income docs; deal must DSCR.
Hard money
10% down · 12.0% · 12mo
- Down + closing
- —
- Monthly P&I
- —
- Monthly cashflow
- —
- DSCR
- —
- Eligible?
- —
Short-term bridge; refi at stabilization.
Rent comps 40 comps
| Address | Beds | Baths | Sqft | Rent | $/sqft | DOM | Units | Dist |
|---|---|---|---|---|---|---|---|---|
| 914 Chalk St Copperas Cove, TX | 3.0 | 2.0 | 1107 | $1,200 | $1.08 | 25d | 1 | 0.19mi |
| 902 Lynn Ln Copperas Cove, TX | 3.0 | 2.0 | 1661 | $1,600 | $0.96 | 15d | 1 | 0.23mi |
| 1202 S FM 116 Copperas Cove, TX | 1.0–3.0 | 1.0–2.0 | 922 | $1,560 | $1.69 | 15d | 12 | 0.27mi |
| 912 Laurie Ln Copperas Cove, TX | 3.0 | 2.0 | 2080 | $1,700 | $0.82 | 15d | 1 | 0.28mi |
| 809 Shady Ln Copperas Cove, TX | 4.0 | 1.5 | 1900 | $1,600 | $0.84 | 15d | 1 | 0.39mi |
| 1904 Pleasant Ln Copperas Cove, TX | 3.0 | 2.0 | 1352 | $1,400 | $1.04 | 45d | 1 | 0.47mi |
| 1816 S FM 116 Unit A Copperas Cove, TX | 3.0 | 2.0 | 1058 | $1,150 | $1.09 | 15d | 1 | 0.47mi |
| 1202 S 3rd St Copperas Cove, TX | 3.0 | 2.0 | 1056 | $1,175 | $1.11 | 45d | 1 | 0.50mi |
| 1204 S 7th St Copperas Cove, TX | 3.0 | 2.0 | 1202 | $1,295 | $1.08 | 45d | 1 | 0.59mi |
| 607 Curry Ave Copperas Cove, TX | 3.0 | 1.5 | 1192 | $935 | $0.78 | 25d | 1 | 0.61mi |
| 613 Cedar Dr Copperas Cove, TX | 3.0 | 2.5 | 2108 | $2,750 | $1.30 | 45d | 1 | 0.61mi |
| 504 Highway Ave Unit B Copperas Cove, TX | 2.0 | 1.0 | 1500 | $700 | $0.47 | 45d | 1 | 0.61mi |
| 1201 S 9th St Copperas Cove, TX | 3.0 | 2.0 | 1172 | $1,100 | $0.94 | 25d | 1 | 0.62mi |
| 603 Westview Cir Unit A Copperas Cove, TX | 2.0 | 1.0 | 1537 | $700 | $0.46 | 45d | 1 | 0.69mi |
| 2201 Dennis St Copperas Cove, TX | 4.0 | 2.5 | 2000 | $1,795 | $0.90 | 15d | 1 | 0.72mi |
| 1005 S 11th St Copperas Cove, TX | 4.0 | 2.0 | 1236 | $1,090 | $0.88 | 45d | 1 | 0.73mi |
| 1107 Tyler Dr Copperas Cove, TX | 3.0 | 2.0 | 1409 | $1,500 | $1.06 | 45d | 1 | 0.73mi |
| 903 Curry Ave Copperas Cove, TX | 3.0 | 2.5 | 1285 | $1,200 | $0.93 | 25d | 1 | 0.73mi |
| 1613 Miranda Ave Copperas Cove, TX | 3.0 | 2.0 | 1630 | $1,395 | $0.86 | 25d | 1 | 0.75mi |
| 1102 Creek St Copperas Cove, TX | 4.0 | 2.5 | 1834 | $1,675 | $0.91 | 45d | 1 | 0.76mi |
| 917 Whirlaway Dr Copperas Cove, TX | 3.0 | 2.0 | 1300 | $1,500 | $1.15 | 45d | 1 | 0.82mi |
| 2313 Bernice Cir Copperas Cove, TX | 4.0 | 2.0 | 1492 | $1,650 | $1.11 | 45d | 1 | 0.84mi |
| 924 Northern Dancer Dr Copperas Cove, TX | 4.0 | 2.0 | 1610 | $1,650 | $1.02 | 45d | 1 | 0.87mi |
| 1002 Northern Dancer Dr Copperas Cove, TX | 4.0 | 2.0 | 1605 | $1,750 | $1.09 | 45d | 1 | 0.89mi |
| 303 Margaret Lee St Copperas Cove, TX | 3.0 | 1.0 | 1124 | $915 | $0.81 | 15d | 1 | 0.89mi |
| 2619 Phyllis Dr Copperas Cove, TX | 3.0 | 2.0 | 1293 | $1,000 | $0.77 | 46d | 1 | 0.90mi |
| 1005 S 19th St Copperas Cove, TX | 3.0 | 1.5 | 1356 | $1,100 | $0.81 | 45d | 1 | 0.92mi |
| 604 S 11th St Copperas Cove, TX | 3.0 | 2.0 | 1119 | $1,300 | $1.16 | 45d | 1 | 0.93mi |
| 408 Allen St Copperas Cove, TX | 3.0 | 1.0 | 1300 | $1,095 | $0.84 | 25d | 1 | 0.96mi |
| 1006 S 21st St Copperas Cove, TX | 4.0 | 2.0 | 1445 | $1,100 | $0.76 | 45d | 1 | 1.00mi |
| 977 Cline Dr Apt A Copperas Cove, TX | 3.0 | 2.0 | 1250 | $1,375 | $1.10 | 45d | 1 | 1.00mi |
| 983 Cline Dr Apt A Copperas Cove, TX | 3.0 | 2.0 | 1250 | $1,375 | $1.10 | 45d | 1 | 1.01mi |
| 1302 S 23rd St Copperas Cove, TX | 4.0 | 1.5 | 1453 | $1,320 | $0.91 | 45d | 1 | 1.02mi |
| 518 Kate St Copperas Cove, TX | 4.0 | 1.5 | 1302 | $1,595 | $1.23 | 45d | 1 | 1.02mi |
| 502 S 9th St Copperas Cove, TX | 3.0 | 1.5 | 1479 | $1,150 | $0.78 | 45d | 1 | 1.03mi |
| 2104 Brantley Ave Copperas Cove, TX | 3.0 | 1.0 | 1140 | $1,495 | $1.31 | 45d | 1 | 1.03mi |
| 1016 Cline Dr Unit B Copperas Cove, TX | 3.0 | 2.5 | 1371 | $1,450 | $1.06 | 15d | 1 | 1.04mi |
| 1307 Sherry Ln Unit B Copperas Cove, TX | 2.0 | 1.0 | 1775 | $1,299 | $0.73 | 45d | 1 | 1.04mi |
| 1007 Cline Dr Unit A Copperas Cove, TX | 3.0 | 2.0 | 1150 | $1,450 | $1.26 | 45d | 1 | 1.05mi |
| 1708 Castroville Trl Unit 1708 B Castroville Copperas Cove, TX | 2.0 | 2.5 | 1282 | $1,375 | $1.07 | 15d | 1 | 1.05mi |
Listing history 25 events
-
2026-06-21days on market $165,000 Active 53 DOM
-
2026-06-18days on market $165,000 Active 50 DOM
-
2026-06-17days on market $165,000 Active 49 DOM
-
2026-06-16days on market $165,000 Active 48 DOM
-
2026-06-15days on market $165,000 Active 47 DOM
-
2026-06-14days on market $165,000 Active 45 DOM
-
2026-06-13days on market $165,000 Active 44 DOM
-
2026-06-10days on market $165,000 Active 42 DOM
-
2026-06-09days on market $165,000 Active 41 DOM
-
2026-06-08days on market $165,000 Active 40 DOM
-
2026-06-07days on market $165,000 Active 39 DOM
-
2026-06-05days on market $165,000 Active 36 DOM
-
2026-06-03days on market $165,000 Active 35 DOM
-
2026-06-02days on market $165,000 Active 34 DOM
-
2026-06-01days on market $165,000 Active 33 DOM
-
2026-05-31days on market $165,000 Active 32 DOM
-
2026-05-30days on market $165,000 Active 31 DOM
-
2026-05-17status Active 964-char remark
-
2026-05-07historical Active Under Contract 964-char remark
-
2026-04-29$165,000 Active 964-char remark
-
2009-04-30$59,900 347-char remark
Show marketing remark (347 chars)
This 3/2 home is conveniently located in a well established neighborhood. Vacant and ready for new owners. * * VA Property. CHL Pre-qual required on all offers. Free appraisal and credit report if buyer finances thru CHL. Please allow 2-3 days for seller response. Cash offers require proof of funds. VA will look at cash offers on this property.
-
2009-04-30$59,900
Show marketing remark (347 chars)
This 3/2 home is conveniently located in a well established neighborhood. Vacant and ready for new owners. * * VA Property. CHL Pre-qual required on all offers. Free appraisal and credit report if buyer finances thru CHL. Please allow 2-3 days for seller response. Cash offers require proof of funds. VA will look at cash offers on this property.
-
2005-08-25soldstatus
-
2005-08-03$76,500
-
1998-03-26soldstatus
ⓘ Source: listings_history table (triggers on properties + properties_extension) + one-shot
backfill from property_details.listing_events for pre-trigger history.
Tax reassessment forecast TX · Resets to sale price
- Current annual tax
- $2,650 · $221/mo
- Projected year-2 tax
- $3,020 · $252/mo
- Expected delta
- +$370/yr (+$31/mo · 14.0%)
ⓘ Screening estimate from a state-policy table — verify with the county assessor before closing.
Climate risk First Street
- Flood 1/10 Low FEMA zone X (unshaded) · 0% chance over 30 yrs
- Wildfire 6/10 Major
- Heat 7/10 Severe 7 d/yr ≥106°F today · 24 d/yr by 30 yrs out
- Wind 6/10 Major 48% chance of damaging wind over 30 yrs
- Air quality 1/10 Low 0 unhealthy d/yr today · 0 by 30 yrs out
Nearby sold comps map
Loading sold comps map…
Walkable amenities ~0.75 mi
Loading nearby amenities…
Taxation est. · year 1
- Rental income
- $17,286
- − Mortgage interest
- −$9,243
- − Property taxes
- −$2,650
- − Insurance
- −$825
- − Repairs & maintenance
- −$1,383
- − Management
- −$1,383
- − Depreciation
- −$4,800
- Taxable loss
- −$2,997
- Est. tax savings @ 24.0%
- +$719
- After-tax cash flow
- $517/yr
For passive investors: Depreciation is non-cash, so a rental often shows a tax loss while cash-flowing — sheltering income. Rental losses are passive: they offset passive income freely, and up to $25,000/yr can offset ordinary (W-2) income if you actively participate and your MAGI is under $100k (phasing out to $0 by $150k); unused losses carry forward. On sale, claimed depreciation is recaptured at up to 25%, and gains may owe capital-gains tax (a 1031 exchange can defer both). Figures are a year-1 estimate at your 24.0% rate — not tax advice; consult a CPA.
Schools (NCES district)
- District
- Copperas Cove ISD
- NCES district ID
- 4815240
- Math proficiency
- 41% ▼ -6.00%
- Reading proficiency
- 42% ▼ -2.00%
- Median HH income
- $51,072
- Composite
- 35.85/100
- National rank
- #4822
- State rank
- #340 of 826 in TX
Livability — Copperas Cove
- Score
- 65/100
- State rank
- #706
- US rank
- #13158
Category grades
Schools grade is shown separately in the Schools card above.
Census & demographics
- Census place
- Copperas Cove, TX
- County
- Coryell County · 61,053 people
- City population
- 42,118
- Metro
- Killeen-Temple, TX
- Population (ZIP)
- 42,118
- Household income
- $72,206
- Rent vs Own
- Severe rent burden
- 1019.0
Population outlook (Coryell County) Hauer SSP2
- Today (2025)
- 75,485 people
- By 2030
- 75,627 · +0.2%
- By 2040
- 74,898 · -0.8%
- By 2050
- 74,221 · -1.7%
- By 2075
- 72,688 · -3.7%
- By 2100
- 66,862 · -11.4%
Race, ethnicity, and origin ACS 2023
- Neighborhood character
- Diverse neighborhood (Simpson 0.66)
- Race & ethnicity
- White 53% Hispanic / Latino 21% Two or more races 20% Black 14% Asian 2%
- Hispanic origin (detail)
- Mexican 11% Puerto Rican 6%
- Common ancestry
- Romanian 2% Italian 2% Lithuanian 2%
- Foreign-born
- 7% · Canada, South Korea
- Languages at home
- 85% English-only · Spanish 10% German/W. Germanic 2% Other Asian/Pacific 1%
Political lean MEDSL · Coryell
- 2024 margin
- Solid R (+40.7) · D 29.1% · R 69.8% · Other 1.1%
- 2008→2024 swing
- -13.8pp toward R · 2008: -26.9pp · 2024: -40.7pp
- All cycles
- 2024: R+40.7 2020: R+33.5 2016: R+39.5 2012: R+36.6 2008: R+26.9
Not yet ingested
- Civics
- —
Market trends
- HPI YoY
- ▼ -53.11%
- Current HPI
- 183.9452
- Rent YoY
- ▼ -0.25%
- Metro
- Killeen-Temple, TX
- State GDP YoY
- ▲ 3.95%
- F500 in state
- 110
Industry mix (Fortune 500 HQ in TX)
| Industry | F500 HQs | Revenue |
|---|---|---|
| Energy | 16 | $1,198B |
|
||
| Technology | 5 | $198B |
|
||
| Engineering / Construction | 4 | $72B |
|
||
| Energy Services | 3 | $60B |
|
||
| Utilities | 3 | $41B |
|
||
| Healthcare | 2 | $330B |
|
||
Price history
+115.7% since first listed8 events — show timeline
- 2026-05-17 Relisted — CTXMLS
- 2026-05-07 Contingent — CTXMLS
- 2026-04-29 Listed $165,000 CTXMLS
- 2009-04-30 Listed $59,900 CTXMLS
- 2009-04-30 Listed $59,900 CTXMLS
- 2005-08-25 Sold (Public Records) — Public Records
- 2005-08-03 Listed $76,500 CTXMLS
- 1998-03-26 Sold (Public Records) — Public Records
Property tax history
+3.6%/yrLatest (2025): $2,650 · +11.9% YoY. Source: county tax records.
Cash-flow waterfall
monthlySold comps — $/sqft
last 12 mo · ≤1 miLoading sold comps…