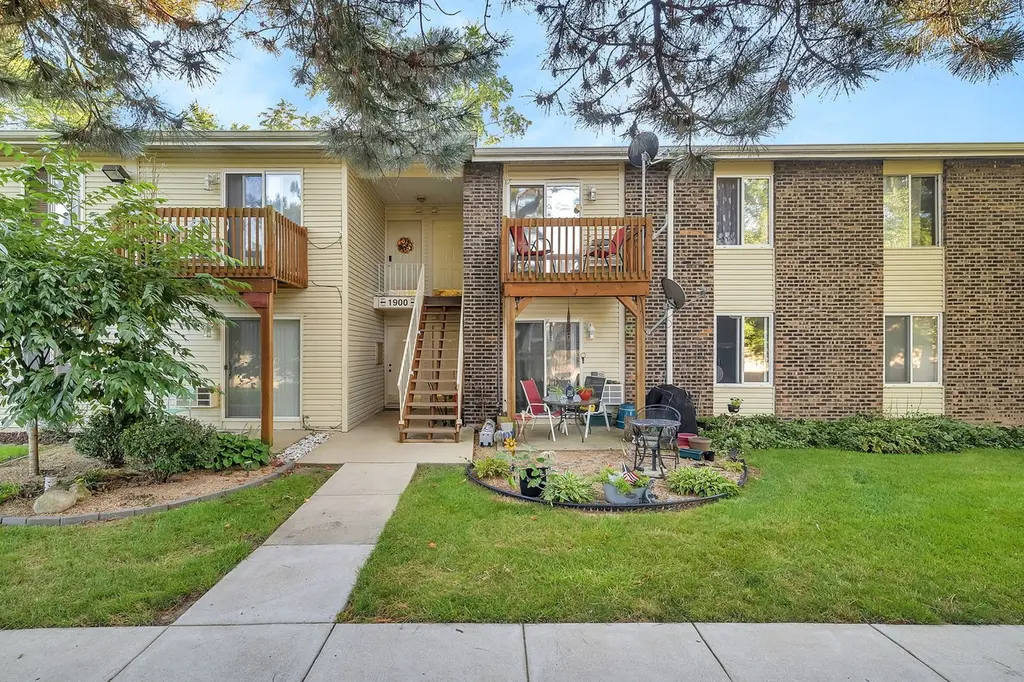
1900 Light Rd #202 · Oswego, IL
Flood risk No data
- FEMA flood zone
- —
- Chance of flooding over 30 yrs
- —
- Est. flood insurance / yr
- —
Fire risk No data
- Est. fire insurance / yr
- —
Heat risk No data
- Hot days now (above threshold)
- —
- Hot days in 30 yrs
- —
Wind risk No data
- Chance of severe wind over 30 yrs
- —
Air-quality risk No data
- Unhealthy air days now
- —
- Unhealthy air days in 30 yrs
- —
Risk factors via First Street. Map © Google.
Why this score? — see what drove the D grade
The composite is a weighted blend of 9 inputs, each scored 0–100. Each bar is that input's sub-score; the figure is the points it added to the 100-point composite (weight × sub-score).
- Cash flow +11.6/30.0
- ARV discount +7.5/15.0
- 1% rule +5.7/10.0
- Livability +4.0/5.0
- Rent growth +3.6/5.0
- DSCR +3.4/10.0
- Schools +3.1/10.0
- Condition / age +2.5/5.0
- Appreciation +0.0/10.0
$145,000
🖨 Deal sheet 📄 Offer letter ✓ Due diligence
Listing remarks
Why rent when you can buy! Your search ends here with this turnkey second-floor condo. Nicely updated and completely move-in ready, this 1-bedroom, 1-bathroom is an incredible opportunity for first-time buyers or savvy investors looking for an investor-friendly property. The light floods into the spacious living room, which features durable, modern LVT (Luxury Vinyl Tile) flooring that flows seamlessly into the bedroom. The functional kitchen features soft close cabinetry and stainless steel appliances and a dedicated eating area. You will love the convenience of the brand-new, full-size in-unit washer and dryer. The bathroom has also been updated. You'll find fantastic storage options thro
Key facts
- Community amenities
- Updated kitchen
- $268 HOA
Tags
Property features AI
Finance
- HOA & community: HOA dues of $268 per month
Exterior
- Home design: Condo/Coop built in 1972; Second-floor unit
- Construction: Built in 1972
- Exterior features: Condo setting
Interior
- Bedrooms: 1 bedroom
- Bathrooms: 1 bathroom
- Interior features: One-bedroom condominium
Neighborhood map
What this means for you Summary
Snapshot
- This is a 1-bed/1.0-bath condo listed at $145k.
Deal economics
- At list price, monthly cash flow is $-44 ($-533/yr) — negative.
- To cash-flow at today's rent, offer at most $139k (4.4% below list).
- Meets the 1% rule at list price ($2k rent vs $145k).
- Recommended offer: $139k (4.4% below list) — sets the bar for cash-flow.
- Cap rate 5.9% vs local median 3.9% in Oswego — top-decile yield for the area; either an underpriced asset or a hidden risk that comps aren't pricing in. Stress-test before assuming the spread holds.
Location & tenants
- Location reads 81/100 on livability (#83 in IL, #1,366 nationally) — a professional / high-income tenant draw. Strengths: crime A+, employment A+, housing A+; Watch: amenities F, commute F.
- CUSD 308 (suburban): math 29% / reading 34% proficiency, ranked #179 of 620 in IL (top 29%) — families likely to look elsewhere, expect single-tenant / working-renter base with shorter leases; only 20% free/reduced lunch — higher-income household profile.
- Market conditions: Rents rising fast (+4.5%/yr); 296 active listings in the ZIP; 10 comparable units currently listed for rent nearby; rentals at typical pace (median 25d on market — plan ~3-4 weeks tenant-placement turnaround); high-income renter base; 706 units permitted in Kendall County in 2024 (263 in 5+ unit buildings).
- This rent is only 16% of the median local income ($119k/yr) — well below the 30% rent-burden line; pricing power to push rent on renewal without tenant pushback.
Forward outlook
- Local home prices are declining (-3.0%/yr); year-one equity from $1k of loan paydown is wiped out by about $4k of value loss. Plan a longer hold.
- Kendall County population projected at +20% by 2050 — long-run rental-demand tailwind backs the buy-and-hold thesis.
Negotiation context
- Only 9 days on market — expect competitive offers; lowballing is unlikely to land.
Questions for the listing agent
- What do current leases actually rent for vs. the listed asking? Can we see a recent rent roll and the last 12 months of T-12 income?
- Built in 1972 — when were the roof, HVAC, electrical panel, plumbing, and water heater last replaced?
- What does the HOA fee cover, when was the last increase, and are there any pending special assessments or reserve-fund shortfalls?
- Any open or pending special assessments — roof, HVAC, plumbing, elevator, façade? What's the per-unit balance and payoff schedule, and is the seller paying it off at close or rolling it to the buyer?
- Is there a deadline driving the sale (1031 exchange, divorce, estate, relocation)? That informs how much negotiation room exists.
- Schools are B-rated — typically a magnet for longer-tenancy family renters. What's the average tenant stay here, and is there a school-zone premium baked into asking?
- The area grade is low — what's the realistic commute time and amenity access for the typical tenant pool here? Any planned neighborhood developments (good or bad) we should know about?
- What's the average days-on-market for RENTAL listings here right now (not sales)? A rising rental-DOM trend means longer vacancies and softer asking-rent achievability than the comps imply.
- What's the recent tenant-quality profile in this submarket — average credit score on applications, eviction rate, late-payment / NSF rate, and stable-employment percentage? A property-management company in the area should have these aggregated.
- How much new apartment / multifamily construction is in the pipeline within 1–3 miles? Heavy new supply (>2% of stock underway) typically softens rents 12–24 months out; light construction supports rent growth.
Investment metrics
- 1% rule
- 1.07% ✓
- Cap rate
- 5.93%
- Cash-on-cash
- -1.31%
- DSCR
- 0.94
- GRM
- 7.8
CMA / ARV
No comps found within radius.
Projected returns pro-forma
-3.0% appreciation · 4.47% rent growth · sell at horizon
- IRR
- -16.2%
- Equity multiple
- 0.41×
- Total profit
- $-23,810
- Equity at exit
- $21,620
- IRR
- -4.8%
- Equity multiple
- 0.66×
- Total profit
- $-13,770
- Equity at exit
- $12,537
Cash invested: $40,600 (down + closing). Projections, not guarantees.
Landlord ↔ Tenant lean methodology
- Overall (STATE)
- 43 Moderately Tenant-Leaning
- State Illinois
- 43 Moderately Tenant-Leaning · D+7
- County
- — inherits STATE
- City
- — inherits STATE
ZIP-level market 60543
- Home prices YoY
- -30.3%
- Rents YoY
- 4.5%
- Active inventory
- 296
- Price-to-rent
- 7.8×
Monthly cashflow live
- Estimated rent
- $1,551 high interval (Pro) →
- Mortgage (P&I)
- −$760
- Tax est. 1.5%
- −$181 /mo · $2,175/yr
- Insurance
- −$60
- HOA
- −$268
- Vacancy / Maint / Mgmt
- −$326
- Net cashflow
- $-44
Break-even live
UW: 25.0% down · 7.5% · 30yr · 1.5% tax · 5.0% vac · 8.0% maint · 8.0% mgmt
Financing live
Cash to close
- Down payment
- $36,250
- Closing costs
- $4,350
- Reserves months
- —
- Total cash needed
- —
Loan-product check · same deal, 3 products live
Conventional
25% down · 7.5% · 30yr
- Down + closing
- —
- Monthly P&I
- —
- Monthly cashflow
- —
- DSCR
- —
- Eligible?
- —
Personal DTI + credit; lowest rate.
DSCR
20% down · 8.5% · 30yr
- Down + closing
- —
- Monthly P&I
- —
- Monthly cashflow
- —
- DSCR
- —
- Eligible?
- —
No personal income docs; deal must DSCR.
Hard money
10% down · 12.0% · 12mo
- Down + closing
- —
- Monthly P&I
- —
- Monthly cashflow
- —
- DSCR
- —
- Eligible?
- —
Short-term bridge; refi at stabilization.
Rent comps 10 comps
| Address | Beds | Baths | Sqft | Rent | $/sqft | DOM | Units | Dist |
|---|---|---|---|---|---|---|---|---|
| 2100 Light Rd #210 Oswego, IL | 1.0 | 1.0 | 700 | $1,495 | $2.14 | 6d | 1 | 0.05mi |
| 2800 Light Rd #204 Oswego, IL | 1.0 | 1.0 | 600 | $1,500 | $2.50 | 24d | 1 | 0.06mi |
| 2300 Light Rd #208 Oswego, IL | 1.0 | 1.0 | 585 | $1,395 | $2.38 | 43d | 1 | 0.08mi |
| 2500 Light Rd #202 Oswego, IL | 1.0 | 1.0 | 585 | $1,400 | $2.39 | 24d | 1 | 0.13mi |
| 24 Hillstone Rd Unit 78HS-30 Montgomery, IL | 1.0 | 1.0 | 570 | $1,175 | $2.06 | 24d | 1 | 1.01mi |
| 24 Hillstone Rd Unit 46HS-13 Montgomery, IL | 1.0 | 1.0 | 570 | $1,200 | $2.11 | 24d | 1 | 1.01mi |
| 24 Hillstone Rd Unit 88HS-28 Montgomery, IL | 1.0 | 1.0 | 570 | $1,100 | $1.93 | 24d | 1 | 1.01mi |
| 24 Hillstone Rd Montgomery, IL | 2.0 | 1.0 | 725 | $1,450 | $2.00 | 2d | 1 | 1.06mi |
| 77 S Adams St Unit 438 Oswego, IL | 1.0 | 1.0 | 687 | $1,770 | $2.58 | 43d | 1 | 1.16mi |
| 76 Washington St Unit B Oswego, IL | 1.0 | 1.0 | 725 | $1,600 | $2.21 | 43d | 1 | 1.21mi |
HOA detail condo
- Monthly dues
- $268 · $3,216/yr
- Assessments
- None detected in remarks — confirm with the listing agent.
Listing history 7 events
-
2026-06-18days on market $145,000 Coming Soon 9 DOM
-
2026-06-17days on market $145,000 Coming Soon 8 DOM
-
2026-06-16days on market $145,000 Coming Soon 7 DOM
-
2026-06-15days on market $145,000 Coming Soon 6 DOM
-
2026-06-13days on market $145,000 Coming Soon 4 DOM
-
2026-06-10remarks 699-char remark
-
2026-06-10$145,000 Coming Soon 1 DOM
ⓘ Source: listings_history table (triggers on properties + properties_extension) + one-shot
backfill from property_details.listing_events for pre-trigger history.
Nearby sold comps map
Loading sold comps map…
Walkable amenities ~0.75 mi
Loading nearby amenities…
Taxation est. · year 1
- Rental income
- $18,617
- − Mortgage interest
- −$8,122
- − Property taxes
- −$2,175
- − Insurance
- −$725
- − Repairs & maintenance
- −$1,489
- − Management
- −$1,489
- − HOA
- −$3,216
- − Depreciation
- −$4,218
- Taxable loss
- −$2,818
- Est. tax savings @ 24.0%
- +$676
- After-tax cash flow
- $143/yr
For passive investors: Depreciation is non-cash, so a rental often shows a tax loss while cash-flowing — sheltering income. Rental losses are passive: they offset passive income freely, and up to $25,000/yr can offset ordinary (W-2) income if you actively participate and your MAGI is under $100k (phasing out to $0 by $150k); unused losses carry forward. On sale, claimed depreciation is recaptured at up to 25%, and gains may owe capital-gains tax (a 1031 exchange can defer both). Figures are a year-1 estimate at your 24.0% rate — not tax advice; consult a CPA.
Schools (NCES district)
- District
- CUSD 308
- NCES district ID
- 1730270
- Math proficiency
- 29% ▼ -10.00%
- Reading proficiency
- 34% ▼ -9.00%
- Median HH income
- $89,945
- Composite
- 31.25/100
- National rank
- #6028
- State rank
- #179 of 620 in IL
Livability — Oswego
- Score
- 81/100
- State rank
- #83
- US rank
- #1366
Category grades
Schools grade is shown separately in the Schools card above.
Census & demographics
- County
- Kendall County · 71,842 people
- City population
- 43,047
- Metro
- Chicago-Naperville-Elgin, IL-IN-WI
- Population (ZIP)
- 43,047
- Household income
- $119,371
- Rent vs Own
- Severe rent burden
- 317.0
Population outlook (Kendall County) Hauer SSP2
- Today (2025)
- 138,283 people
- By 2030
- 144,935 · +4.8%
- By 2040
- 156,944 · +13.5%
- By 2050
- 165,424 · +19.6%
- By 2075
- 174,715 · +26.3%
- By 2100
- 168,523 · +21.9%
Race, ethnicity, and origin ACS 2023
- Neighborhood character
- Majority White (64%)
- Race & ethnicity
- White 64% Hispanic / Latino 18% Two or more races 13% Black 10% Asian 4%
- Hispanic origin (detail)
- Mexican 14% Puerto Rican 2%
- Common ancestry
- Romanian 7% Lithuanian 2% Italian 2%
- Foreign-born
- 13% · Canada
- Languages at home
- 79% English-only · Spanish 14% Other Indo-European 2% Russian/Polish/Slavic 2%
Political lean MEDSL · Kendall
- 2024 margin
- Toss-up / Even · D 50.0% · R 48.5% · Other 1.6%
- 2008→2024 swing
- -5.7pp toward R · 2008: 7.2pp · 2024: 1.5pp
- All cycles
- 2024: D+1.5 2020: D+5.7 2016: R+1.5 2012: R+4.1 2008: D+7.2
Not yet ingested
- Civics
- —
Market trends
- HPI YoY
- ▼ -91.42%
- Current HPI
- 210.3944
- Rent YoY
- ▲ 4.47%
- Metro
- Chicago-Naperville-Elgin, IL-IN-WI
- State GDP YoY
- ▲ 1.59%
- F500 in state
- 60
Industry mix (Fortune 500 HQ in IL)
| Industry | F500 HQs | Revenue |
|---|---|---|
| Insurance | 4 | $201B |
|
||
| Consumer Goods | 4 | $87B |
|
||
| Industrial Machinery | 3 | $64B |
|
||
| Healthcare | 2 | $55B |
|
||
| Retail / Pharmacy | 1 | $148B |
|
||
| Agriculture / Food | 1 | $86B |
|
||
Cash-flow waterfall
monthlySold comps — $/sqft
last 12 mo · ≤1 miLoading sold comps…