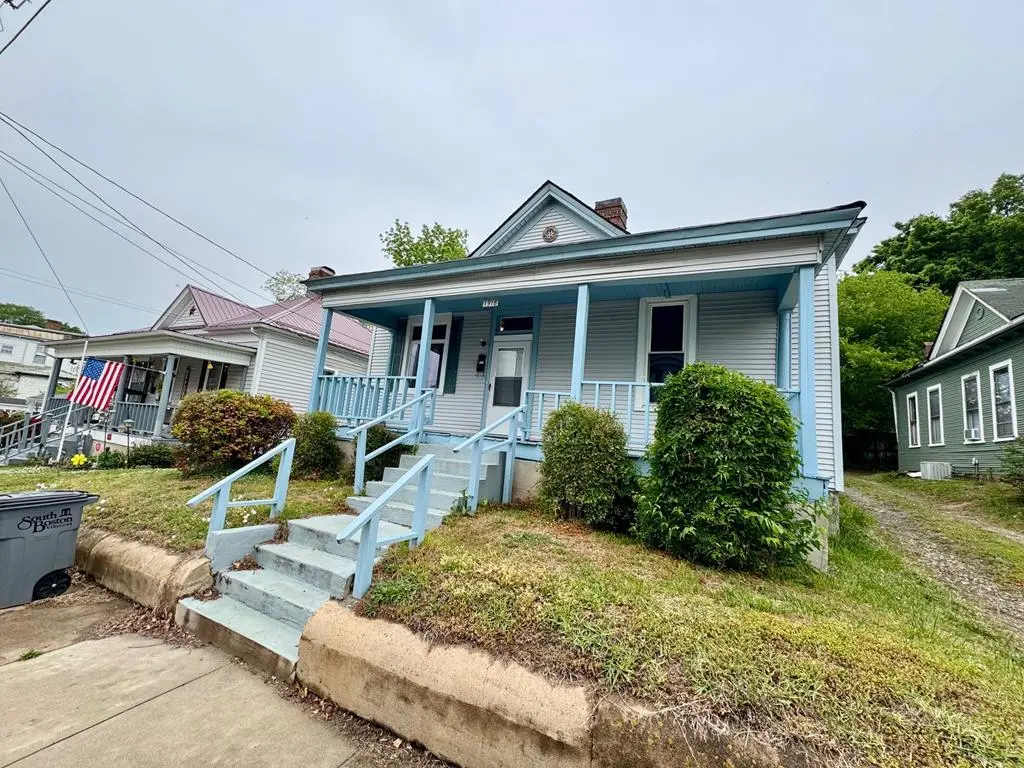
1318 Shepherd St · South Boston, VA
Flood risk 1/10 · Minimal
- FEMA flood zone
- X (unshaded)
- Chance of flooding over 30 yrs
- 0.0%
- Est. flood insurance / yr
- $507 – $1,088
Fire risk 3/10 · Minor
- Est. fire insurance / yr
- $666 – $1,236
Heat risk 6/10 · Moderate
- Hot days now (above 104°F)
- 7 days/yr
- Hot days in 30 yrs
- 17 days/yr
Wind risk 4/10 · Minor
- Chance of severe wind over 30 yrs
- 15.0%
Air-quality risk 2/10 · Minimal
- Unhealthy air days now
- 1 days/yr
- Unhealthy air days in 30 yrs
- 1 days/yr
Risk factors via First Street. Map © Google.
Why this score? — see what drove the B grade
The composite is a weighted blend of 9 inputs, each scored 0–100. Each bar is that input's sub-score; the figure is the points it added to the 100-point composite (weight × sub-score).
- Cash flow +29.0/30.0
- ARV discount +15.0/15.0
- DSCR +10.0/10.0
- 1% rule +8.1/10.0
- Livability +3.7/5.0
- Schools +3.6/10.0
- Rent growth +2.5/5.0
- Condition / age +2.5/5.0
- Appreciation +0.0/10.0
$105,000
🖨 Deal sheet 📄 Offer letter ✓ Due diligence
Listing remarks
Investment property, with a good rental history. All on one level this three bedroom one bath home has almost 1500 Sq. Feet of living space. 12 feet ceiling, tall duel pain replacement windows, metal roof, vinyl siding, four fireplaces with original mantels and a updated bath, enclosed back porch with storage room and small yard make this a great rental in town. Walking distance to the post office, restaurants and other down town facilities. Being sold AS-IS.
Key facts
- Storage room
- Enclosed back porch
- Metal roof
Tags
Property features AI
Exterior
- Parking: No garage
- Security: Smoke detector(s)
- Utilities: Cable available and connected; Public sewer
- Home design: Single family residence; Residential property
- Construction: Vinyl siding; Composition roof; Crawl space / no basement
- Exterior features: Enclosed porch; Porch; Has view
Interior
- Kitchen: Electric range
- Flooring: Wood flooring
- Bathrooms: 1 full bathroom
- Heating & cooling: Has heating; Ceiling fan(s); Window unit(s)
- Interior features: Ceiling fans; High ceilings; 3 fireplaces (in bedroom, dining room, and living room); Electric water heater
Neighborhood map
What this means for you Summary
Snapshot
- This is a 2-bed/1.0-bath single-family listed at $105k.
Deal economics
- At list price, monthly cash flow is $361 ($4k/yr) — positive.
- The deal already cash-flows at list — no discount required.
- Meets the 1% rule at list price ($1k rent vs $105k).
- Recommended offer: $103k (1.5% below list) — sets the bar for market timing.
- Cap rate 10.4% vs local median 4.9% in South Boston — top-decile yield for the area; either an underpriced asset or a hidden risk that comps aren't pricing in. Stress-test before assuming the spread holds.
Location & tenants
- Location reads 74/100 on livability (#147 in VA, #4,742 nationally) — a middle-class / working-renter tenant base. Strengths: cost of living A+, housing A+, health & safety A+; Watch: crime F, amenities F, commute F.
- Halifax County Public School District (town): math 29% / reading 59% proficiency, ranked #116 of 131 in VA (top 88%) — families likely to look elsewhere, expect single-tenant / working-renter base with shorter leases.
- Zoned schools: South Boston Elementary (math 18% / reading 48%, grade F, #986 of 1,108 statewide, top 89%, 666 students, 93% FRL); Halifax County Middle (math 27% / reading 60%, grade D, #285 of 342 statewide, top 84%, 925 students, 92% FRL); Halifax County High (math 40% / reading 69%, grade C-, #281 of 319 statewide, top 90%, 1,397 students, 90% FRL) — zoned schools average 92% FRL vs 58% district-wide (34 pts higher); higher-poverty schools than district average — tighter screening recommended.
- Market conditions: 61 active listings in the ZIP; 1 comparable units currently listed for rent nearby; 97 units permitted in Halifax County in 2024 (0 in 5+ unit buildings).
Forward outlook
- Local home prices are declining (-3.0%/yr); year-one equity from $726 of loan paydown is wiped out by about $3k of value loss. Plan a longer hold.
- Halifax County population projected at -22% by 2050 — secular population decline; favor cash flow + early exit over multi-decade hold.
- At projected returns (-3.0% appreciation + 3.0% rent growth), your $29k cash investment doubles in ~8 years — after that, you're playing with house money.
Negotiation context
- It's been on market 28 days — a 2% lower offer ($103k) is reasonable based on typical stale-listing flexibility.
- Current owner paid $18k; list at $105k implies a 483% gain — meaningful room to come down on a strong offer.
Risks & watch-outs
- Watch-outs: built in 1900 — expect roof / HVAC / electrical / plumbing capex.
- Climate carrying-cost: extreme-heat days projected 7→17/yr by 2055 (HVAC capex compounding) — expect insurance premiums to compound above CPI over the hold.
Questions for the listing agent
- Built in 1900 — when were the roof, HVAC, electrical panel, plumbing, and water heater last replaced?
- Is there a deadline driving the sale (1031 exchange, divorce, estate, relocation)? That informs how much negotiation room exists.
- Schools are B-rated — typically a magnet for longer-tenancy family renters. What's the average tenant stay here, and is there a school-zone premium baked into asking?
- Crime grade is F in this area — have there been break-ins, vandalism, or insurance claims at this property in the last 3 years? What carrier currently insures it and at what premium?
- What's the average days-on-market for RENTAL listings here right now (not sales)? A rising rental-DOM trend means longer vacancies and softer asking-rent achievability than the comps imply.
- What's the recent tenant-quality profile in this submarket — average credit score on applications, eviction rate, late-payment / NSF rate, and stable-employment percentage? A property-management company in the area should have these aggregated.
- How much new for-sale + rental construction is in the pipeline within 1–3 miles? Heavy new supply typically softens prices + rents 12–24 months out; constrained supply supports both.
Investment metrics
- 1% rule
- 1.31% ✓
- Cap rate
- 10.41%
- Cash-on-cash
- 14.72%
- DSCR
- 1.65
- GRM
- 6.4
CMA / ARV
- ARV (on-the-fly)
- $179,828
- Comps found
- 4
Show comp detail 4 sales within ~0.75 mi
| Address | Dist | Beds/Ba | Sqft | Sold | Price | $/sf | Match |
|---|---|---|---|---|---|---|---|
| 1411 Fenton St | 0.28mi | 3/2.0 (+1) | 1,440 (-2%) | 6mo | $170,000 | $118 | 69 |
| 104 Elizabeth Ct | 0.39mi | 3/1.5 (+1) | 1,443 (-2%) | 4mo | $200,000 | $139 | 67 |
| 212 Leigh St | 0.62mi | 2/1.0 | 1,414 (-4%) | 13mo | $136,000 | $96 | 53 |
| 1733 Chamberlain St | 0.36mi | 3/1.0 (+1) | 1,560 (+6%) | 23mo | $190,000 | $122 | 50 |
Match score weights: distance 35% · size 25% · config 20% · recency 20%. Top-matched comps best support the ARV.
Projected returns pro-forma
-3.0% appreciation · 3.0% rent growth · sell at horizon
- IRR
- 5.2%
- Equity multiple
- 1.20×
- Total profit
- $5,974
- Equity at exit
- $15,656
- IRR
- 14.7%
- Equity multiple
- 2.19×
- Total profit
- $34,862
- Equity at exit
- $9,078
Cash invested: $29,400 (down + closing). Projections, not guarantees.
Landlord ↔ Tenant lean methodology
- Overall (STATE)
- 55 Moderately Landlord-Leaning
- State Virginia
- 55 Moderately Landlord-Leaning · D+2
- County
- — inherits STATE
- City
- — inherits STATE
ZIP-level market 24592
- Home prices YoY
- -27.0%
- Active inventory
- 61
- Price-to-rent
- 6.4×
Monthly cashflow live
- Estimated rent
- $1,375 medium interval (Pro) →
- Mortgage (P&I)
- −$551
- Tax est. 1.5%
- −$131 /mo · $1,575/yr
- Insurance
- −$44
- HOA
- −$0
- Vacancy / Maint / Mgmt
- −$289
- Net cashflow
- $361
Break-even live
UW: 25.0% down · 7.5% · 30yr · 1.5% tax · 5.0% vac · 8.0% maint · 8.0% mgmt
Financing live
Cash to close
- Down payment
- $26,250
- Closing costs
- $3,150
- Reserves months
- —
- Total cash needed
- —
Loan-product check · same deal, 3 products live
Conventional
25% down · 7.5% · 30yr
- Down + closing
- —
- Monthly P&I
- —
- Monthly cashflow
- —
- DSCR
- —
- Eligible?
- —
Personal DTI + credit; lowest rate.
DSCR
20% down · 8.5% · 30yr
- Down + closing
- —
- Monthly P&I
- —
- Monthly cashflow
- —
- DSCR
- —
- Eligible?
- —
No personal income docs; deal must DSCR.
Hard money
10% down · 12.0% · 12mo
- Down + closing
- —
- Monthly P&I
- —
- Monthly cashflow
- —
- DSCR
- —
- Eligible?
- —
Short-term bridge; refi at stabilization.
Rent comps 1 comps
| Address | Beds | Baths | Sqft | Rent | $/sqft | DOM | Units | Dist |
|---|---|---|---|---|---|---|---|---|
| 701 Jefferson Ave Apt 113 South Boston, VA | 2.0 | 2.0 | 1119 | $1,375 | $1.23 | 43d | 1 | 0.23mi |
Listing history 17 events
-
2026-06-18days on market $105,000 Active 28 DOM
-
2026-06-17days on market $105,000 Active 27 DOM
-
2026-06-16days on market $105,000 Active 26 DOM
-
2026-06-15days on market $105,000 Active 25 DOM
-
2026-06-15days on market $105,000 Active 24 DOM
-
2026-06-13days on market $105,000 Active 23 DOM
-
2026-06-12days on market $105,000 Active 22 DOM
-
2026-06-09days on market $105,000 Active 19 DOM
-
2026-06-08days on market $105,000 Active 18 DOM
-
2026-06-08days on market $105,000 Active 17 DOM
-
2026-06-07days on market $105,000 Active 16 DOM
-
2026-06-03days on market $105,000 Active 13 DOM
-
2026-06-02days on market $105,000 Active 12 DOM
-
2026-06-01days on market $105,000 Active 11 DOM
-
2026-05-31days on market $105,000 Active 10 DOM
-
2026-05-21$105,000 Active
-
2011-07-01soldstatus $18,025
ⓘ Source: listings_history table (triggers on properties + properties_extension) + one-shot
backfill from property_details.listing_events for pre-trigger history.
Climate risk First Street
- Flood 1/10 Low FEMA zone X (unshaded) · 0% chance over 30 yrs
- Wildfire 3/10 Moderate
- Heat 6/10 Major 7 d/yr ≥104°F today · 17 d/yr by 30 yrs out
- Wind 4/10 Moderate 15% chance of damaging wind over 30 yrs
- Air quality 2/10 Low 1 unhealthy d/yr today · 1 by 30 yrs out
Nearby sold comps map
Loading sold comps map…
Walkable amenities ~0.75 mi
Loading nearby amenities…
Taxation est. · year 1
- Rental income
- $16,500
- − Mortgage interest
- −$5,882
- − Property taxes
- −$1,575
- − Insurance
- −$525
- − Repairs & maintenance
- −$1,320
- − Management
- −$1,320
- − Depreciation
- −$3,055
- Taxable income
- $2,824
- Est. tax owed @ 24.0%
- −$678
- After-tax cash flow
- $3,650/yr
For passive investors: Depreciation is non-cash, so a rental often shows a tax loss while cash-flowing — sheltering income. Rental losses are passive: they offset passive income freely, and up to $25,000/yr can offset ordinary (W-2) income if you actively participate and your MAGI is under $100k (phasing out to $0 by $150k); unused losses carry forward. On sale, claimed depreciation is recaptured at up to 25%, and gains may owe capital-gains tax (a 1031 exchange can defer both). Figures are a year-1 estimate at your 24.0% rate — not tax advice; consult a CPA.
Schools (NCES district)
- District
- Halifax County Public School District
- NCES district ID
- 5101770
- Math proficiency
- 29% ▼ -51.00%
- Reading proficiency
- 59% ▼ -15.00%
- Median HH income
- $36,137
- Composite
- 36.36/100
- National rank
- #4687
- State rank
- #116 of 131 in VA
Livability — South Boston
- Score
- 74/100
- State rank
- #147
- US rank
- #4742
Category grades
Schools grade is shown separately in the Schools card above.
Census & demographics
- Census place
- South Boston, VA
- Population (ZIP)
- 14,411
Population outlook (Halifax County) Hauer SSP2
- Today (2025)
- 32,892 people
- By 2030
- 31,438 · -4.4%
- By 2040
- 28,350 · -13.8%
- By 2050
- 25,553 · -22.3%
- By 2075
- 20,217 · -38.5%
- By 2100
- 14,645 · -55.5%
Race, ethnicity, and origin ACS 2023
- Neighborhood character
- Majority White (55%)
- Race & ethnicity
- White 55% Black 40% Two or more races 3% Hispanic / Latino 1%
- Common ancestry
- Iranian 1% Romanian 1%
- Foreign-born
- 2% · Canada
- Languages at home
- 98% English-only · Spanish 1% Other Indo-European 1%
Political lean MEDSL · Halifax
- 2024 margin
- Strong R (+21.1) · D 39.1% · R 60.2%
- 2008→2024 swing
- -18.2pp toward R · 2008: -2.8pp · 2024: -21.1pp
- All cycles
- 2024: R+21.1 2020: R+15.1 2016: R+16.6 2012: R+5.6 2008: R+2.8
Not yet ingested
- Civics
- —
Market trends
- HPI YoY
- ▼ -70.37%
- Current HPI
- 190.3767
- Rent YoY
- —
- Metro
- —
- State GDP YoY
- ▲ 2.40%
- F500 in state
- 50
Industry mix (Fortune 500 HQ in VA)
| Industry | F500 HQs | Revenue |
|---|---|---|
| Aerospace / Defense | 4 | $236B |
|
||
| Technology / Defense | 3 | $32B |
|
||
| Financial Services | 2 | $176B |
|
||
| Utilities | 2 | $27B |
|
||
| Insurance | 2 | $25B |
|
||
| Technology | 2 | $15B |
|
||
Price history
+482.5% since first listed2 events — show timeline
- 2026-05-21 Listed $105,000 SPLLAR
- 2011-07-01 Sold (Public Records) $18,025 Public Records
Property tax history
-0.2%/yrLatest (2025): $182 · +0.0% YoY. Source: county tax records.
Cash-flow waterfall
monthlySold comps — $/sqft
last 12 mo · ≤1 miLoading sold comps…