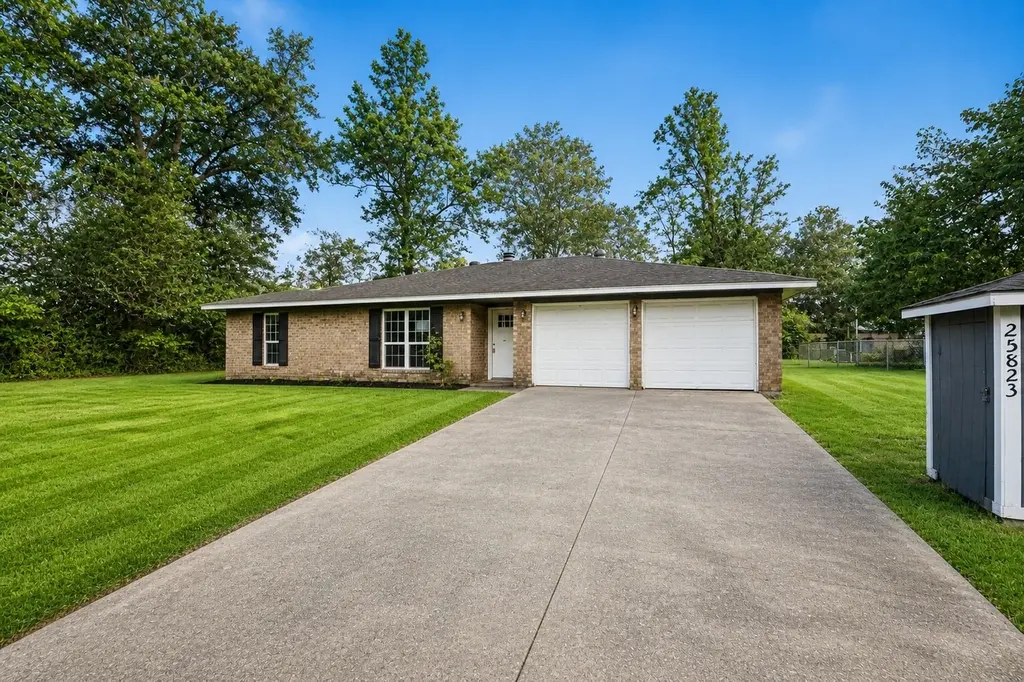
25823 Water Ridge Dr · Houston, TX
Flood risk 1/10 · Minimal
- FEMA flood zone
- X (unshaded)
- Chance of flooding over 30 yrs
- 0.0%
- Est. flood insurance / yr
- $507 – $1,088
Fire risk 2/10 · Minimal
- Est. fire insurance / yr
- $1,222 – $2,270
Heat risk 9/10 · Severe
- Hot days now (above 112°F)
- 7 days/yr
- Hot days in 30 yrs
- 24 days/yr
Wind risk 9/10 · Severe
- Chance of severe wind over 30 yrs
- 99.0%
Air-quality risk 2/10 · Minimal
- Unhealthy air days now
- 2 days/yr
- Unhealthy air days in 30 yrs
- 2 days/yr
Risk factors via First Street. Map © Google.
Why this score? — see what drove the D+ grade
The composite is a weighted blend of 9 inputs, each scored 0–100. Each bar is that input's sub-score; the figure is the points it added to the 100-point composite (weight × sub-score).
- Cash flow +15.8/30.0
- ARV discount +11.1/15.0
- DSCR +4.9/10.0
- 1% rule +4.8/10.0
- Livability +3.7/5.0
- Schools +3.1/10.0
- Rent growth +2.5/5.0
- Condition / age +2.5/5.0
- Appreciation +0.7/10.0
$220,000
🖨 Deal sheet 📄 Offer letter ✓ Due diligence
Listing remarks MLS
Completely remodeled in 2019. Great location on quiet street with partial view of Lake Houston! Neighborhood has two private parks, boat launch, low taxes, no water bill, no MUD fees and affordable HOA. Upgraded 14 SEER HVAC unit was installed in 2022 and the roof & water heater are only 4 years old. Schedule your tour today.
Key facts
- 0.24 acre lot
- 2 garage spots
- Built 1982
Property features AI
Finance
- HOA & community: Member of Water Wonderland POA with an annual fee of $25
Exterior
- Parking: Attached 2-car garage
- Utilities: Well water; Septic tank
- Home design: Residential property; Single-story entry (first-floor living areas)
- Construction: Brick construction; Composition roof; Built in 1982; Slab foundation
- Exterior features: Located in a subdivision
Interior
- Kitchen: Kitchen on the first floor (approx. 10 x 10)
- Bedrooms: Primary bedroom on the first floor (approx. 15 x 16); Two additional bedrooms on the first floor (each approx. 12 x 12); Another bedroom on the first floor (approx. 12 x 12)
- Bathrooms: 2 full bathrooms
- Heating & cooling: Central heating (electric); Central air conditioning (electric)
- Interior features: One fireplace; 5 total rooms
Neighborhood map
What this means for you Summary
Snapshot
- This is a 3-bed/2.0-bath single-family listed at $220k.
Deal economics
- At list price, monthly cash flow is $101 ($1k/yr) — positive.
- The deal already cash-flows at list — no discount required.
- To meet the 1% rule (rent ≥ 1% of price), the offer needs to be $215k (2.1% below list).
- Recommended offer: $213k (3.0% below list) — sets the bar for market timing.
- Cap rate 6.8% vs local median 3.2% in Houston — top-decile yield for the area; either an underpriced asset or a hidden risk that comps aren't pricing in. Stress-test before assuming the spread holds.
Location & tenants
- Location reads 74/100 on livability (#184 in TX, #4,771 nationally) — a middle-class / working-renter tenant base. Strengths: amenities A+, cost of living A+, housing A+; Watch: crime F.
- Huffman ISD (rural): math 32% / reading 35% proficiency, ranked #500 of 826 in TX (top 60%) — families likely to look elsewhere, expect single-tenant / working-renter base with shorter leases.
- Zoned schools: Huffman Middle (math 36% / reading 32%, grade F, #892 of 1,662 statewide, top 55%, 907 students, 42% FRL); Hargrave H S (math 31% / reading 46%, grade F, #866 of 1,632 statewide, top 54%, 1,125 students, 36% FRL) — zoned schools at 39% FRL track the district average.
- Market conditions: 585 active listings in the ZIP; 5 comparable units currently listed for rent nearby; rentals lingering (median 44d on market — plan ~5-8 weeks vacancy on turnover, expect pricing pressure); 80% of comp listings sitting > 30 days — soft ceiling on asking rent; solid renter incomes; 29,883 units permitted in Harris County in 2024 (8,621 in 5+ unit buildings).
Forward outlook
- Local home prices are declining (-3.0%/yr); year-one equity from $2k of loan paydown is wiped out by about $7k of value loss. Plan a longer hold.
- Harris County population projected at +47% by 2050 — long-run rental-demand tailwind backs the buy-and-hold thesis.
Negotiation context
- It's been on market 43 days — a 3% lower offer ($213k) is reasonable based on typical stale-listing flexibility.
- 5 sale attempts since 7y ago with the ask held roughly flat each time — persistent listings suggest the price (not the market) is what's stuck; bring a comps-based counter.
Risks & watch-outs
- Climate carrying-cost: severe wind risk, 99% chance of damaging wind over 30y; extreme-heat days projected 7→24/yr by 2055 (HVAC capex compounding) — expect insurance premiums to compound above CPI over the hold.
Questions for the listing agent
- It's been on market 43 days. Have you received any prior offers? Is the seller open to a 3% concession, seller financing, or rate buy-down credit?
- What does the HOA fee cover, when was the last increase, and are there any pending special assessments or reserve-fund shortfalls?
- Is there a deadline driving the sale (1031 exchange, divorce, estate, relocation)? That informs how much negotiation room exists.
- Schools are D-rated, which usually means shorter tenancies and higher turnover. Who's the typical renter profile here, and what's been the actual vacancy rate?
- Crime grade is F in this area — have there been break-ins, vandalism, or insurance claims at this property in the last 3 years? What carrier currently insures it and at what premium?
- The area grade is low — what's the realistic commute time and amenity access for the typical tenant pool here? Any planned neighborhood developments (good or bad) we should know about?
- What's the average days-on-market for RENTAL listings here right now (not sales)? A rising rental-DOM trend means longer vacancies and softer asking-rent achievability than the comps imply.
- What's the recent tenant-quality profile in this submarket — average credit score on applications, eviction rate, late-payment / NSF rate, and stable-employment percentage? A property-management company in the area should have these aggregated.
- How much new for-sale + rental construction is in the pipeline within 1–3 miles? Heavy new supply typically softens prices + rents 12–24 months out; constrained supply supports both.
Investment metrics
- 1% rule
- 0.98% ✗
- Cap rate
- 6.85%
- Cash-on-cash
- 1.97%
- DSCR
- 1.09
- GRM
- 8.5
CMA / ARV
- ARV (median comp)
- $239,366
- List price
- $220,000
- Delta
- -8.09%
- Verdict
- FAIR
- Comps
- 20 within 1.0 mi
Show comp detail 10 sales within ~0.75 mi
| Address | Dist | Beds/Ba | Sqft | Sold | Price | $/sf | Match |
|---|---|---|---|---|---|---|---|
| 531 Brookwater Dr | 0.09mi | 3/2.0 | 1,512 (+1%) | 0mo | $259,900 | $172 | 95 |
| 407 Brookwater Dr | 0.14mi | 3/2.0 | 1,459 (-3%) | 10mo | $234,999 | $161 | 80 |
| 25930 Water Ridge Dr | 0.09mi | 3/3.0 | 1,542 (+3%) | 12mo | $325,000 | $211 | 77 |
| 25810 Beaver Run Dr | 0.24mi | 4/2.0 (+1) | 1,417 (-6%) | 2mo | $164,656 | $116 | 73 |
| 223 Sparkling Water Dr | 0.34mi | 3/2.0 | 1,574 (+5%) | 5mo | $260,000 | $165 | 72 |
| 507 Springwater Dr | 0.05mi | 3/2.0 | 1,689 (+12%) | 8mo | $245,000 | $145 | 71 |
| 25839 Water Ridge Dr | 0.05mi | 3/2.0 | 1,300 (-14%) | 21mo | $239,900 | $185 | 57 |
| 25639 Beaver Run Dr | 0.32mi | 3/2.0 | 1,642 (+9%) | 15mo | $229,500 | $140 | 57 |
| 1101 Wood Branch Ln | 0.62mi | 3/2.0 | 1,428 (-5%) | 19mo | $284,900 | $200 | 47 |
| 1102 Wood Branch Ln | 0.63mi | 4/2.5 (+1) | 1,674 (+11%) | 1mo | $365,000 | $218 | 44 |
Match score weights: distance 35% · size 25% · config 20% · recency 20%. Top-matched comps best support the ARV.
Projected returns pro-forma
-3.0% appreciation · 3.0% rent growth · sell at horizon
- IRR
- -13.1%
- Equity multiple
- 0.53×
- Total profit
- $-29,113
- Equity at exit
- $32,803
- IRR
- -4.1%
- Equity multiple
- 0.73×
- Total profit
- $-16,707
- Equity at exit
- $19,022
Cash invested: $61,600 (down + closing). Projections, not guarantees.
Landlord ↔ Tenant lean methodology
- Overall (STATE)
- 87 Strongly Landlord-Friendly
- State Texas
- 87 Strongly Landlord-Friendly · R+5
- County
- — inherits STATE
- City
- — inherits STATE
ZIP-level market 77336
- Home prices YoY
- -1.8%
- Active inventory
- 585
- Price-to-rent
- 8.5×
Monthly cashflow live
- Estimated rent
- $2,155 high interval (Pro) →
- Mortgage (P&I)
- −$1,154
- Tax from tax record
- −$353 /mo · $4,242/yr
- Insurance
- −$92
- HOA
- −$2
- Vacancy / Maint / Mgmt
- −$452
- Net cashflow
- $101
Break-even live
UW: 25.0% down · 7.5% · 30yr · 1.5% tax · 5.0% vac · 8.0% maint · 8.0% mgmt
Financing live
Cash to close
- Down payment
- $55,000
- Closing costs
- $6,600
- Reserves months
- —
- Total cash needed
- —
Loan-product check · same deal, 3 products live
Conventional
25% down · 7.5% · 30yr
- Down + closing
- —
- Monthly P&I
- —
- Monthly cashflow
- —
- DSCR
- —
- Eligible?
- —
Personal DTI + credit; lowest rate.
DSCR
20% down · 8.5% · 30yr
- Down + closing
- —
- Monthly P&I
- —
- Monthly cashflow
- —
- DSCR
- —
- Eligible?
- —
No personal income docs; deal must DSCR.
Hard money
10% down · 12.0% · 12mo
- Down + closing
- —
- Monthly P&I
- —
- Monthly cashflow
- —
- DSCR
- —
- Eligible?
- —
Short-term bridge; refi at stabilization.
Rent comps 5 comps
| Address | Beds | Baths | Sqft | Rent | $/sqft | DOM | Units | Dist |
|---|---|---|---|---|---|---|---|---|
| 24719 Colony Meadow Trl Huffman, TX | 4.0 | 2.0 | 1613 | $2,200 | $1.36 | 44d | 1 | 1.11mi |
| 24730 Russet Bluff Trl Huffman, TX | 4.0 | 2.0 | 1604 | $2,150 | $1.34 | 1d | 1 | 1.17mi |
| 408 Emerald Thicket Ln Huffman, TX | 3.0 | 2.5 | 1755 | $2,200 | $1.25 | 44d | 1 | 1.23mi |
| 24523 Whitesail Dr Huffman, TX | 3.0 | 2.0 | 1512 | $1,800 | $1.19 | 44d | 1 | 1.37mi |
| 24527 Lightwoods Dr Huffman, TX | 4.0 | 2.0 | 2095 | $2,100 | $1.00 | 44d | 1 | 1.43mi |
HOA detail
- Monthly dues
- $2 · $24/yr
- Likely covers
- water
Listing history 39 events
-
2026-06-18days on market $220,000 Active 43 DOM
-
2026-06-17days on market $220,000 Active 42 DOM
-
2026-06-16days on market $220,000 Active 41 DOM
-
2026-06-15days on market $220,000 Active 40 DOM
-
2026-06-13days on market $220,000 Active 38 DOM
-
2026-06-09days on market $220,000 Active 34 DOM
-
2026-06-08days on market $220,000 Active 33 DOM
-
2026-06-07days on market $220,000 Active 32 DOM
-
2026-06-04days on market $220,000 Active 29 DOM
-
2026-06-03days on market $220,000 Active 28 DOM
-
2026-06-02days on market $220,000 Active 27 DOM
-
2026-06-01days on market $220,000 Active 26 DOM
-
2026-05-31days on market $220,000 Active 25 DOM
-
2026-05-06$220,000 Active 612-char remark
-
2023-12-20soldstatus Sold 335-char remark
Show marketing remark (335 chars)
Completely remodeled in 2019. Great location on quiet street with partial view of Lake Houston! Neighborhood has two private parks, boat launch, low taxes, no water bill, no MUD fees and affordable HOA. Upgraded 14 SEER HVAC unit was installed in 2022 and the roof & water heater are only 4 years old. Schedule your tour today.
-
2023-12-20soldstatus
Show marketing remark (335 chars)
Completely remodeled in 2019. Great location on quiet street with partial view of Lake Houston! Neighborhood has two private parks, boat launch, low taxes, no water bill, no MUD fees and affordable HOA. Upgraded 14 SEER HVAC unit was installed in 2022 and the roof & water heater are only 4 years old. Schedule your tour today.
-
2023-12-15status Pending 335-char remark
Show marketing remark (335 chars)
Completely remodeled in 2019. Great location on quiet street with partial view of Lake Houston! Neighborhood has two private parks, boat launch, low taxes, no water bill, no MUD fees and affordable HOA. Upgraded 14 SEER HVAC unit was installed in 2022 and the roof & water heater are only 4 years old. Schedule your tour today.
-
2023-10-27$244,900 Active 335-char remark
Show marketing remark (335 chars)
Completely remodeled in 2019. Great location on quiet street with partial view of Lake Houston! Neighborhood has two private parks, boat launch, low taxes, no water bill, no MUD fees and affordable HOA. Upgraded 14 SEER HVAC unit was installed in 2022 and the roof & water heater are only 4 years old. Schedule your tour today.
-
2023-09-29status Pending
-
2023-09-19status Option Pending
-
2023-09-18historical
-
2023-08-23price $217,500
-
2023-08-10price $219,999
-
2023-08-03price $221,500
-
2023-07-26$225,000 Active
-
2020-03-11soldstatus
-
2020-03-06soldstatus Sold
-
2020-02-09status Pending
-
2020-01-30status Option Pending
-
2019-12-17price $199,900
-
2019-10-10price $204,900
-
2019-08-21price $209,900
-
2019-08-02$219,900 Active
-
2019-05-21soldstatus
-
2019-05-17soldstatus Sold
-
2019-05-07status Pending
-
2019-05-03status Option Pending
-
2019-04-23$169,900 Active
-
2019-04-22soldstatus
ⓘ Source: listings_history table (triggers on properties + properties_extension) + one-shot
backfill from property_details.listing_events for pre-trigger history.
Tax reassessment forecast TX · Resets to sale price
- Current annual tax
- $4,242 · $353/mo
- Projected year-2 tax
- $4,242 · $353/mo
- Expected delta
- $0/yr ($0/mo · 0.0%)
ⓘ Screening estimate from a state-policy table — verify with the county assessor before closing.
Climate risk First Street
- Flood 1/10 Low FEMA zone X (unshaded) · 0% chance over 30 yrs
- Wildfire 2/10 Low
- Heat 9/10 Extreme 7 d/yr ≥112°F today · 24 d/yr by 30 yrs out
- Wind 9/10 Extreme 99% chance of damaging wind over 30 yrs
- Air quality 2/10 Low 2 unhealthy d/yr today · 2 by 30 yrs out
Nearby sold comps map
Loading sold comps map…
Walkable amenities ~0.75 mi
Loading nearby amenities…
Taxation est. · year 1
- Rental income
- $25,856
- − Mortgage interest
- −$12,323
- − Property taxes
- −$4,242
- − Insurance
- −$1,100
- − Repairs & maintenance
- −$2,068
- − Management
- −$2,068
- − HOA
- −$24
- − Depreciation
- −$6,400
- Taxable loss
- −$2,370
- Est. tax savings @ 24.0%
- +$569
- After-tax cash flow
- $1,785/yr
For passive investors: Depreciation is non-cash, so a rental often shows a tax loss while cash-flowing — sheltering income. Rental losses are passive: they offset passive income freely, and up to $25,000/yr can offset ordinary (W-2) income if you actively participate and your MAGI is under $100k (phasing out to $0 by $150k); unused losses carry forward. On sale, claimed depreciation is recaptured at up to 25%, and gains may owe capital-gains tax (a 1031 exchange can defer both). Figures are a year-1 estimate at your 24.0% rate — not tax advice; consult a CPA.
Schools (NCES district)
- District
- Huffman ISD
- NCES district ID
- 4823820
- Math proficiency
- 32% ▼ -9.00%
- Reading proficiency
- 35% ▼ -9.00%
- Median HH income
- $65,848
- Composite
- 30.61/100
- National rank
- #6195
- State rank
- #500 of 826 in TX
Livability — Houston
- Score
- 74/100
- State rank
- #184
- US rank
- #4771
Category grades
Schools grade is shown separately in the Schools card above.
Census & demographics
- County
- Harris County · 4,702,590 people
- City population
- 3,226,434
- Metro
- Houston-The Woodlands-Sugar Land, TX
- Population (ZIP)
- 14,342
- Household income
- $96,404
- Rent vs Own
- Severe rent burden
- 377.0
Population outlook (Harris County) Hauer SSP2
- Today (2025)
- 5,571,493 people
- By 2030
- 6,089,821 · +9.3%
- By 2040
- 7,142,806 · +28.2%
- By 2050
- 8,185,864 · +46.9%
- By 2075
- 10,574,329 · +89.8%
- By 2100
- 12,109,958 · +117.4%
Race, ethnicity, and origin ACS 2023
- Neighborhood character
- Majority White (65%)
- Race & ethnicity
- White 65% Hispanic / Latino 23% Two or more races 9% Black 5% Native American 4%
- Hispanic origin (detail)
- Mexican 20%
- Common ancestry
- Lithuanian 4% Slovak 2% Romanian 2%
- Foreign-born
- 9% · Canada
- Languages at home
- 79% English-only · Spanish 18% Other Indo-European 2%
Political lean MEDSL · Harris
- 2024 margin
- Lean D (+5.5) · D 52.0% · R 46.4% · Other 1.6%
- 2008→2024 swing
- +3.9pp toward D · 2008: 1.6pp · 2024: 5.5pp
- All cycles
- 2024: D+5.5 2020: D+13.3 2016: D+12.4 2012: D+0.1 2008: D+1.6
Not yet ingested
- Civics
- —
Market trends
- HPI YoY
- ▼ -8.59%
- Current HPI
- 472.03
- Rent YoY
- —
- Metro
- Houston-The Woodlands-Sugar Land, TX
- State GDP YoY
- ▲ 3.95%
- F500 in state
- 110
Industry mix (Fortune 500 HQ in TX)
| Industry | F500 HQs | Revenue |
|---|---|---|
| Energy | 16 | $1,198B |
|
||
| Technology | 5 | $198B |
|
||
| Engineering / Construction | 4 | $72B |
|
||
| Energy Services | 3 | $60B |
|
||
| Utilities | 3 | $41B |
|
||
| Healthcare | 2 | $330B |
|
||
Price history
+29.5% since first listed26 events — show timeline
- 2026-05-06 Listed $220,000 HARMLS
- 2023-12-20 Sold (Public Records) — Public Records
- 2023-12-20 Sold (MLS) — HARMLS
- 2023-12-15 Pending — HARMLS
- 2023-10-27 Listed $244,900 HARMLS
- 2023-09-29 Pending — HARMLS
- 2023-09-19 Pending — HARMLS
- 2023-09-18 Listing Removed — HARMLS
- 2023-08-23 Price Changed $217,500 HARMLS
- 2023-08-10 Price Changed $219,999 HARMLS
- 2023-08-03 Price Changed $221,500 HARMLS
- 2023-07-26 Listed $225,000 HARMLS
- 2020-03-11 Sold (Public Records) — Public Records
- 2020-03-06 Sold (MLS) — HARMLS
- 2020-02-09 Pending — HARMLS
- 2020-01-30 Pending — HARMLS
- 2019-12-17 Price Changed $199,900 HARMLS
- 2019-10-10 Price Changed $204,900 HARMLS
- 2019-08-21 Price Changed $209,900 HARMLS
- 2019-08-02 Listed $219,900 HARMLS
- 2019-05-21 Sold (Public Records) — Public Records
- 2019-05-17 Sold (MLS) — HARMLS
- 2019-05-07 Pending — HARMLS
- 2019-05-03 Pending — HARMLS
- 2019-04-23 Listed $169,900 HARMLS
- 2019-04-22 Sold (Public Records) — Public Records
Property tax history
+4.1%/yrLatest (2025): $4,242 · -0.6% YoY. Source: county tax records.
Cash-flow waterfall
monthlySold comps — $/sqft
last 12 mo · ≤1 miLoading sold comps…