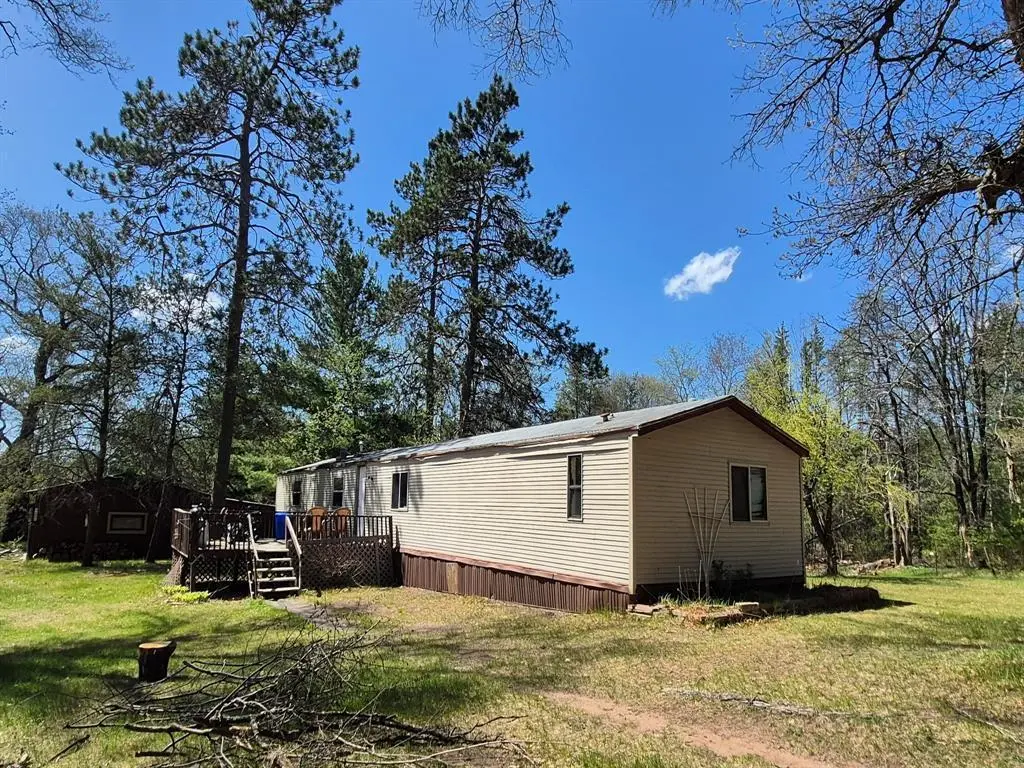
N9505 Wild River Dr · Hayward, WI
Flood risk 1/10 · Minimal
- FEMA flood zone
- X (unshaded)
- Chance of flooding over 30 yrs
- 0.0%
- Est. flood insurance / yr
- $473 – $860
Fire risk 4/10 · Minor
- Est. fire insurance / yr
- $636 – $1,182
Heat risk 1/10 · Minimal
- Hot days now (above 95°F)
- 7 days/yr
- Hot days in 30 yrs
- 13 days/yr
Wind risk 1/10 · Minimal
- Chance of severe wind over 30 yrs
- —
Air-quality risk 1/10 · Minimal
- Unhealthy air days now
- 0 days/yr
- Unhealthy air days in 30 yrs
- 0 days/yr
Risk factors via First Street. Map © Google.
Why this score? — see what drove the B- grade
The composite is a weighted blend of 9 inputs, each scored 0–100. Each bar is that input's sub-score; the figure is the points it added to the 100-point composite (weight × sub-score).
- Cash flow +30.0/30.0
- 1% rule +10.0/10.0
- DSCR +10.0/10.0
- ARV discount +7.5/15.0
- Livability +3.9/5.0
- Schools +3.3/10.0
- Rent growth +2.5/5.0
- Condition / age +2.5/5.0
- Appreciation +0.0/10.0
$50,000
🖨 Deal sheet 📄 Offer letter ✓ Due diligence
Listing remarks MLS
Fixer-upper. Septic pumped and inspected fall 2005, well tested every 2 years. Moderately wooded lot on a cul-d-sac.
Key facts
- 1.460-acre lot
- Mobile home
- Large country yard
Tags
Property features AI
Finance
- Other: Lot size about 1.46 acres
Exterior
- Parking: Detached 2-car garage
- Utilities: Private well; Private septic system
- Home design: Single-family, 1-story (4-season); Residential zoning (see remarks)
- Construction: Finished above-grade living area approximately 1,216; No finished below-grade living area reported
- Exterior features: Deck; Vinyl exterior; Storage shed; Machine shed
Interior
- Kitchen: Range/Oven; Range hood; Refrigerator
- Bedrooms: Primary bedroom on the main level (11 x 10); Second bedroom on the main level (8 x 11); Third bedroom on the main level (12 x 14)
- Bathrooms: Two full bathrooms
- Heating & cooling: Forced air heating; LP gas fuel
- Interior features: Circuit breakers
- Laundry & utility: Washer; Dryer
Neighborhood map
What this means for you Summary
Snapshot
- This is a 3-bed/2.0-bath other listed at $50k.
Deal economics
- At list price, monthly cash flow is $772 ($9k/yr) — positive.
- The deal already cash-flows at list — no discount required.
- Meets the 1% rule at list price ($1k rent vs $50k).
- Recommended offer: $49k (1.5% below list) — sets the bar for market timing.
- Cap rate 24.8% vs local median 1.6% in Hayward — top-decile yield for the area; either an underpriced asset or a hidden risk that comps aren't pricing in. Stress-test before assuming the spread holds.
Location & tenants
- Location reads 77/100 on livability (#122 in WI, #3,155 nationally) — a middle-class / working-renter tenant base. Strengths: cost of living A+, health & safety A+, amenities A; Watch: schools D+, employment D+, crime F.
- Hayward Community School District (rural): math 40% / reading 38% proficiency, ranked #187 of 342 in WI (top 55%) — families likely to look elsewhere, expect single-tenant / working-renter base with shorter leases.
- Market conditions: 209 active listings in the ZIP; 121 units permitted in Washburn County in 2024 (0 in 5+ unit buildings).
Forward outlook
- Local home prices are declining (-3.0%/yr); year-one equity from $346 of loan paydown is wiped out by about $2k of value loss. Plan a longer hold.
- Washburn County population projected at -30% by 2050 — secular population decline; favor cash flow + early exit over multi-decade hold.
- At projected returns (-3.0% appreciation + 3.0% rent growth), your $14k cash investment doubles in ~2 years — after that, you're playing with house money.
Negotiation context
- It's been on market 21 days — a 2% lower offer ($49k) is reasonable based on typical stale-listing flexibility.
- 2 sale attempts since 20y ago; this cycle's ask has dropped $25k (33%) from the opening price — seller is motivated, your offer sets the floor, not the list.
- Current owner paid $42k; 19% above their basis — modest negotiation headroom, anchor on the comps not their cost.
Questions for the listing agent
- Is there a deadline driving the sale (1031 exchange, divorce, estate, relocation)? That informs how much negotiation room exists.
- Schools are D-rated, which usually means shorter tenancies and higher turnover. Who's the typical renter profile here, and what's been the actual vacancy rate?
- Crime grade is F in this area — have there been break-ins, vandalism, or insurance claims at this property in the last 3 years? What carrier currently insures it and at what premium?
- What's the average days-on-market for RENTAL listings here right now (not sales)? A rising rental-DOM trend means longer vacancies and softer asking-rent achievability than the comps imply.
- What's the recent tenant-quality profile in this submarket — average credit score on applications, eviction rate, late-payment / NSF rate, and stable-employment percentage? A property-management company in the area should have these aggregated.
- How much new for-sale + rental construction is in the pipeline within 1–3 miles? Heavy new supply typically softens prices + rents 12–24 months out; constrained supply supports both.
Investment metrics
- 1% rule
- 2.75% ✓
- Cap rate
- 24.82%
- Cash-on-cash
- 66.17%
- DSCR
- 3.94
- GRM
- 3.0
CMA / ARV
No comps found within radius.
Projected returns pro-forma
-3.0% appreciation · 3.0% rent growth · sell at horizon
- IRR
- 65.4%
- Equity multiple
- 3.93×
- Total profit
- $41,066
- Equity at exit
- $7,455
- IRR
- 69.7%
- Equity multiple
- 8.08×
- Total profit
- $99,075
- Equity at exit
- $4,323
Cash invested: $14,000 (down + closing). Projections, not guarantees.
Landlord ↔ Tenant lean methodology
- Overall (STATE)
- 73 Landlord-Friendly
- State Wisconsin
- 73 Landlord-Friendly · R+2
- County
- — inherits STATE
- City
- — inherits STATE
ZIP-level market 54843
- Home prices YoY
- -22.1%
- Active inventory
- 209
- Price-to-rent
- 3.0×
Monthly cashflow live
- Estimated rent
- $1,374 medium interval (Pro) →
- Mortgage (P&I)
- −$262
- Tax from tax record
- −$30 /mo · $364/yr
- Insurance
- −$21
- HOA
- −$0
- Vacancy / Maint / Mgmt
- −$289
- Net cashflow
- $772
Break-even live
UW: 25.0% down · 7.5% · 30yr · 1.5% tax · 5.0% vac · 8.0% maint · 8.0% mgmt
Financing live
Cash to close
- Down payment
- $12,500
- Closing costs
- $1,500
- Reserves months
- —
- Total cash needed
- —
Loan-product check · same deal, 3 products live
Conventional
25% down · 7.5% · 30yr
- Down + closing
- —
- Monthly P&I
- —
- Monthly cashflow
- —
- DSCR
- —
- Eligible?
- —
Personal DTI + credit; lowest rate.
DSCR
20% down · 8.5% · 30yr
- Down + closing
- —
- Monthly P&I
- —
- Monthly cashflow
- —
- DSCR
- —
- Eligible?
- —
No personal income docs; deal must DSCR.
Hard money
10% down · 12.0% · 12mo
- Down + closing
- —
- Monthly P&I
- —
- Monthly cashflow
- —
- DSCR
- —
- Eligible?
- —
Short-term bridge; refi at stabilization.
Listing history 14 events
-
2026-06-12statusdays on market $50,000 Pending 21 DOM
-
2026-06-09days on market $50,000 Active 19 DOM
-
2026-06-08days on market $50,000 Active 18 DOM
-
2026-06-08days on market $50,000 Active 17 DOM
-
2026-06-07days on market $50,000 Active 16 DOM
-
2026-06-04price $50,000 Active 13 DOM
-
2026-06-03days on market $75,000 Active 13 DOM
-
2026-06-02days on market $75,000 Active 12 DOM
-
2026-06-01days on market $75,000 Active 11 DOM
-
2026-05-31days on market $75,000 Active 10 DOM
-
2026-05-21$75,000 Active
-
2015-02-24soldstatus $42,000
-
2006-10-19soldstatus $32,500 116-char remark
Show marketing remark (116 chars)
Fixer-upper. Septic pumped and inspected fall 2005, well tested every 2 years. Moderately wooded lot on a cul-d-sac.
-
2006-07-05$35,000 116-char remark
Show marketing remark (116 chars)
Fixer-upper. Septic pumped and inspected fall 2005, well tested every 2 years. Moderately wooded lot on a cul-d-sac.
ⓘ Source: listings_history table (triggers on properties + properties_extension) + one-shot
backfill from property_details.listing_events for pre-trigger history.
Tax reassessment forecast WI · Partial reset (capped growth)
- Current annual tax
- $364 · $30/mo
- Projected year-2 tax
- $644 · $54/mo
- Expected delta
- +$281/yr (+$23/mo · 77.1%)
ⓘ Screening estimate from a state-policy table — verify with the county assessor before closing.
Climate risk First Street
- Flood 1/10 Low FEMA zone X (unshaded) · 0% chance over 30 yrs
- Wildfire 4/10 Moderate
- Heat 1/10 Low 7 d/yr ≥95°F today · 13 d/yr by 30 yrs out
- Wind 1/10 Low
- Air quality 1/10 Low 0 unhealthy d/yr today · 0 by 30 yrs out
Nearby sold comps map
Loading sold comps map…
Walkable amenities ~0.75 mi
Loading nearby amenities…
Taxation est. · year 1
- Rental income
- $16,486
- − Mortgage interest
- −$2,801
- − Property taxes
- −$364
- − Insurance
- −$250
- − Repairs & maintenance
- −$1,319
- − Management
- −$1,319
- − Depreciation
- −$1,455
- Taxable income
- $8,979
- Est. tax owed @ 24.0%
- −$2,155
- After-tax cash flow
- $7,109/yr
For passive investors: Depreciation is non-cash, so a rental often shows a tax loss while cash-flowing — sheltering income. Rental losses are passive: they offset passive income freely, and up to $25,000/yr can offset ordinary (W-2) income if you actively participate and your MAGI is under $100k (phasing out to $0 by $150k); unused losses carry forward. On sale, claimed depreciation is recaptured at up to 25%, and gains may owe capital-gains tax (a 1031 exchange can defer both). Figures are a year-1 estimate at your 24.0% rate — not tax advice; consult a CPA.
Schools (NCES district)
- District
- Hayward Community School District
- NCES district ID
- 5506270
- Math proficiency
- 40% ▼ -8.00%
- Reading proficiency
- 38% ▼ -4.00%
- Median HH income
- $41,508
- Composite
- 32.87/100
- National rank
- #5612
- State rank
- #187 of 342 in WI
Livability — Hayward
- Score
- 77/100
- State rank
- #122
- US rank
- #3155
Category grades
Schools grade is shown separately in the Schools card above.
Census & demographics
- Population (ZIP)
- 13,167
Population outlook (Washburn County) Hauer SSP2
- Today (2025)
- 14,408 people
- By 2030
- 13,552 · -5.9%
- By 2040
- 11,723 · -18.6%
- By 2050
- 10,065 · -30.1%
- By 2075
- 7,616 · -47.1%
- By 2100
- 5,901 · -59.0%
Race, ethnicity, and origin ACS 2023
- Neighborhood character
- Predominantly White (78%)
- Race & ethnicity
- White 78% Native American 15% Two or more races 4% Hispanic / Latino 2%
- Common ancestry
- Portuguese 8% Romanian 5% Lithuanian 3%
- Foreign-born
- 1% · Canada
- Languages at home
- 97% English-only · Spanish 1%
Political lean MEDSL · Washburn
- 2024 margin
- Strong R (+28.2) · D 35.3% · R 63.6% · Other 1.1%
- 2008→2024 swing
- -32.5pp toward R · 2008: 4.3pp · 2024: -28.2pp
- All cycles
- 2024: R+28.2 2020: R+23.8 2016: R+23.4 2012: R+2.8 2008: D+4.3
Not yet ingested
- Civics
- —
Market trends
- HPI YoY
- ▼ -53.39%
- Current HPI
- 188.4382
- Rent YoY
- —
- Metro
- —
- State GDP YoY
- ▲ 2.10%
- F500 in state
- 20
Industry mix (Fortune 500 HQ in WI)
| Industry | F500 HQs | Revenue |
|---|---|---|
| Industrial Machinery | 4 | $23B |
|
||
| Industrial Technology | 2 | $36B |
|
||
| Insurance | 1 | $36B |
|
||
| Professional Services | 1 | $19B |
|
||
| Utilities | 1 | $9B |
|
||
| Consumer Goods | 1 | $3B |
|
||
Price history
+114.3% since first listed4 events — show timeline
- 2026-05-21 Listed $75,000 RANWW
- 2015-02-24 Sold (Public Records) $42,000 Public Records
- 2006-10-19 Sold (MLS) $32,500 NORTHSTARMLS as Distributed by MLS Grid
- 2006-07-05 Listed $35,000 NORTHSTARMLS as Distributed by MLS Grid
Property tax history
-1.3%/yrLatest (2025): $364 · +92.8% YoY. Source: county tax records.
Cash-flow waterfall
monthlySold comps — $/sqft
last 12 mo · ≤1 miLoading sold comps…