2822 E WELLESLEY Ave · Spokane, WA
Flood risk 1/10 · Minimal
- FEMA flood zone
- X (unshaded)
- Chance of flooding over 30 yrs
- 0.0%
- Est. flood insurance / yr
- $473 – $860
Fire risk 6/10 · Moderate
- Est. fire insurance / yr
- $604 – $1,122
Heat risk 3/10 · Minor
- Hot days now (above 94°F)
- 7 days/yr
- Hot days in 30 yrs
- 15 days/yr
Wind risk 1/10 · Minimal
- Chance of severe wind over 30 yrs
- —
Air-quality risk 10/10 · Severe
- Unhealthy air days now
- 19 days/yr
- Unhealthy air days in 30 yrs
- 21 days/yr
Risk factors via First Street. Map © Google.
Why this score? — see what drove the C+ grade
The composite is a weighted blend of 9 inputs, each scored 0–100. Each bar is that input's sub-score; the figure is the points it added to the 100-point composite (weight × sub-score).
- Cash flow +24.9/30.0
- DSCR +8.1/10.0
- 1% rule +7.7/10.0
- ARV discount +7.5/15.0
- Rent growth +4.9/5.0
- Schools +4.6/10.0
- Livability +4.0/5.0
- Condition / age +2.5/5.0
- Appreciation +0.0/10.0
$176,800
🖨 Deal sheet 📄 Offer letter ✓ Due diligence
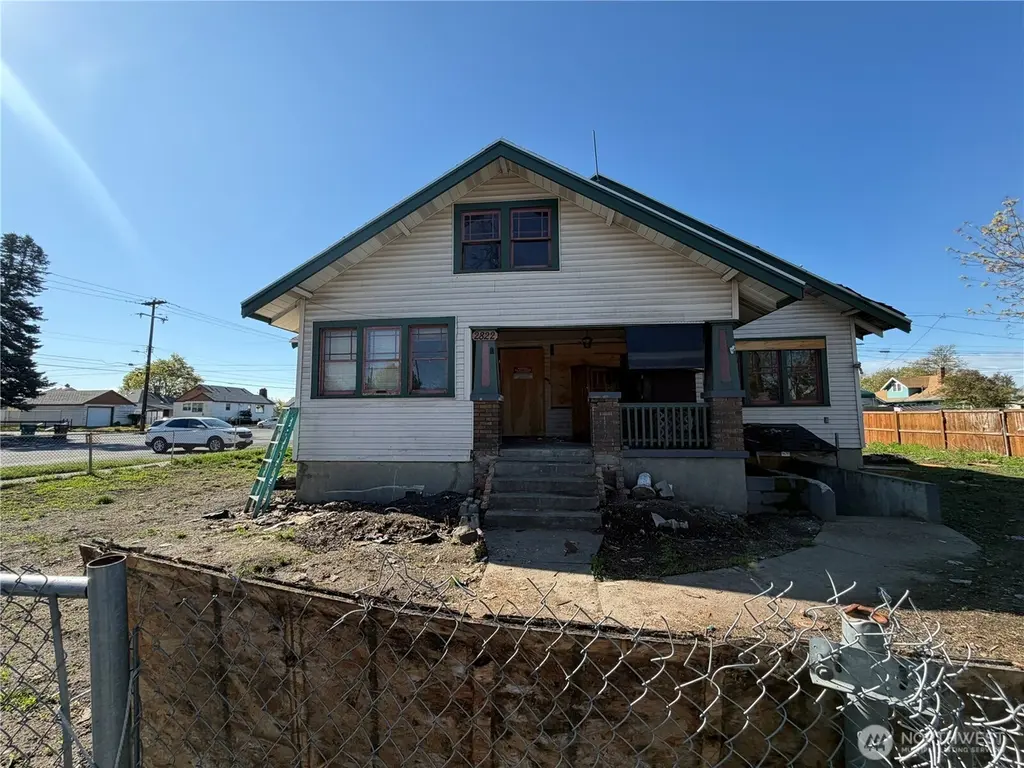
Listing remarks
Attention flippers/investors. Fixer in Spokane WA is now available. 1929 stick built with 2,898sqft of living area on the main floor. Main floor has 4 bedrooms, 1 bathroom, living room, and kitchen with eating area. The basement has 2 bedrooms, 1 bathroom, living room, and kitchen with eating area. The home is not habitable at the moment. Condition of structural, appliances, electrical, plumbing, and other systems are in unknown working conditions. Buyer needs to due their due diligence on this property. Property is being sold AS-IS. Everything you see on the pictures stays.
Key facts
- 9,020 sq ft lot
- Garage
- Built 1929
Property features AI
Finance
- Other: Zoning: SFR; Lot size: 0.2071 acres (source: County)
- Financial info: Listing terms: Cash
Exterior
- Parking: Detached garage; 1 covered parking space; 2 uncovered parking spaces
- Utilities: Electric energy source; Public water; Sewer available
- Home design: Single-family residence (house); Two levels with basement; Built on lot; Fixer condition; Facing/entry direction not provided
- Construction: Wood construction; Composition roof; Poured concrete foundation; Effective year built: 1929
- Exterior features: Wood products siding; Level topography
Interior
- Kitchen: Kitchen with eating space on main level; Kitchen with eating space on lower level
- Bedrooms: 7 bedrooms total — distribution: 1 on upper level, 3 on main level, 3 on lower level, additional bedroom on second level
- Bathrooms: 2 full bathrooms — 1 on main level, 1 on lower level
- Heating & cooling: Wall furnace heating; Wall unit(s) cooling
- Interior features: Finished basement; Water heater
- Laundry & utility: Electric water heater
Neighborhood map
What this means for you Summary
Snapshot
- This is a 4-bed/2.0-bath single-family listed at $177k.
Deal economics
- At list price, monthly cash flow is $378 ($5k/yr) — positive.
- The deal already cash-flows at list — no discount required.
- Meets the 1% rule at list price ($2k rent vs $177k).
- Recommended offer: $174k (1.5% below list) — sets the bar for market timing.
- Cap rate 8.9% vs local median 3.2% in Spokane — top-decile yield for the area; either an underpriced asset or a hidden risk that comps aren't pricing in. Stress-test before assuming the spread holds.
Location & tenants
- Location reads 80/100 on livability (#93 in WA, #1,822 nationally) — a professional / high-income tenant draw. Strengths: amenities A+, commute A+, housing A+; Watch: crime F.
- Spokane School District (urban): math 47% / reading 58% proficiency, ranked #136 of 291 in WA (top 47%) — acceptable for families but not a draw, mixed tenant base, ~2y average lease.
- Market conditions: Rents rising fast (+9.5%/yr); 207 active listings in the ZIP; 2 comparable units currently listed for rent nearby; 3,608 units permitted in Spokane County in 2024 (1,792 in 5+ unit buildings).
- This rent runs 36% of the median local income ($74k/yr) — at the standard rent-burdened threshold; future hikes will face affordability resistance.
Forward outlook
- Local home prices are declining (-3.0%/yr); year-one equity from $1k of loan paydown is wiped out by about $5k of value loss. Plan a longer hold.
- Spokane County population projected at +13% by 2050 — modest demand growth; plan on rents tracking national, not racing it.
- At projected returns (-3.0% appreciation + 8.0% rent growth), your $50k cash investment doubles in ~8 years — after that, you're playing with house money.
Negotiation context
- It's been on market 21 days — a 2% lower offer ($174k) is reasonable based on typical stale-listing flexibility.
- Current owner paid $98k; list at $177k implies a 80% gain — meaningful room to come down on a strong offer.
Risks & watch-outs
- Watch-outs: property tax is 2.6% of price; built in 1929 — expect roof / HVAC / electrical / plumbing capex.
- Climate carrying-cost: major wildfire risk — expect insurance premiums to compound above CPI over the hold.
Questions for the listing agent
- Built in 1929 — when were the roof, HVAC, electrical panel, plumbing, and water heater last replaced?
- Property tax is high relative to price — has the assessment been appealed recently, and will the sale trigger a re-assessment?
- Is there a deadline driving the sale (1031 exchange, divorce, estate, relocation)? That informs how much negotiation room exists.
- Schools are B-rated — typically a magnet for longer-tenancy family renters. What's the average tenant stay here, and is there a school-zone premium baked into asking?
- Crime grade is F in this area — have there been break-ins, vandalism, or insurance claims at this property in the last 3 years? What carrier currently insures it and at what premium?
- What's the average days-on-market for RENTAL listings here right now (not sales)? A rising rental-DOM trend means longer vacancies and softer asking-rent achievability than the comps imply.
- What's the recent tenant-quality profile in this submarket — average credit score on applications, eviction rate, late-payment / NSF rate, and stable-employment percentage? A property-management company in the area should have these aggregated.
- How much new for-sale + rental construction is in the pipeline within 1–3 miles? Heavy new supply typically softens prices + rents 12–24 months out; constrained supply supports both.
Investment metrics
- 1% rule
- 1.27% ✓
- Cap rate
- 8.86%
- Cash-on-cash
- 9.17%
- DSCR
- 1.41
- GRM
- 6.6
CMA / ARV
- ARV (on-the-fly)
- $394,128
- Comps found
- 2
Show comp detail 2 sales within ~0.75 mi
| Address | Dist | Beds/Ba | Sqft | Sold | Price | $/sf | Match |
|---|---|---|---|---|---|---|---|
| 5023 N Lacey St | 0.28mi | 5/2.0 (+1) | 2,576 (-11%) | 5mo | $350,000 | $136 | 59 |
| 1734 E Wellesley Ave | 0.67mi | 3/2.0 (-1) | 2,918 (+1%) | 11mo | $290,000 | $99 | 53 |
Match score weights: distance 35% · size 25% · config 20% · recency 20%. Top-matched comps best support the ARV.
Projected returns pro-forma
-3.0% appreciation · 8.0% rent growth · sell at horizon
- IRR
- 3.7%
- Equity multiple
- 1.15×
- Total profit
- $7,418
- Equity at exit
- $26,361
- IRR
- 17.8%
- Equity multiple
- 2.86×
- Total profit
- $91,896
- Equity at exit
- $15,286
Cash invested: $49,504 (down + closing). Projections, not guarantees.
Landlord ↔ Tenant lean methodology
- Overall (STATE)
- 28 Tenant-Leaning
- State Washington
- 28 Tenant-Leaning · D+8
- County
- — inherits STATE
- City
- — inherits STATE
ZIP-level market 99217
- Home prices YoY
- -30.7%
- Rents YoY
- 9.5%
- Active inventory
- 207
- Price-to-rent
- 6.6×
Monthly cashflow live
- Estimated rent
- $2,239 medium interval (Pro) →
- Mortgage (P&I)
- −$927
- Tax from tax record
- −$389 /mo · $4,673/yr
- Insurance
- −$74
- HOA
- −$0
- Vacancy / Maint / Mgmt
- −$470
- Net cashflow
- $378
Break-even live
UW: 25.0% down · 7.5% · 30yr · 1.5% tax · 5.0% vac · 8.0% maint · 8.0% mgmt
Financing live
Cash to close
- Down payment
- $44,200
- Closing costs
- $5,304
- Reserves months
- —
- Total cash needed
- —
Loan-product check · same deal, 3 products live
Conventional
25% down · 7.5% · 30yr
- Down + closing
- —
- Monthly P&I
- —
- Monthly cashflow
- —
- DSCR
- —
- Eligible?
- —
Personal DTI + credit; lowest rate.
DSCR
20% down · 8.5% · 30yr
- Down + closing
- —
- Monthly P&I
- —
- Monthly cashflow
- —
- DSCR
- —
- Eligible?
- —
No personal income docs; deal must DSCR.
Hard money
10% down · 12.0% · 12mo
- Down + closing
- —
- Monthly P&I
- —
- Monthly cashflow
- —
- DSCR
- —
- Eligible?
- —
Short-term bridge; refi at stabilization.
Rent comps 2 comps
| Address | Beds | Baths | Sqft | Rent | $/sqft | DOM | Units | Dist |
|---|---|---|---|---|---|---|---|---|
| 1928 E Bridgeport Ave Spokane, WA | 4.0 | 2.0 | 2200 | $2,045 | $0.93 | 23d | 1 | 1.00mi |
| 1508 E Nebraska Ave Spokane, WA | 3.0 | 2.0 | 2200 | $1,995 | $0.91 | 23d | 1 | 1.12mi |
Listing history 4 events
-
2026-05-19status Pending
-
2026-04-27$176,800 Active
-
2000-03-08soldstatus $98,000
-
1996-01-02soldstatus $60,000
ⓘ Source: listings_history table (triggers on properties + properties_extension) + one-shot
backfill from property_details.listing_events for pre-trigger history.
Tax reassessment forecast WA · Resets to sale price
- Current annual tax
- $4,673 · $389/mo
- Projected year-2 tax
- $4,673 · $389/mo
- Expected delta
- $0/yr ($0/mo · 0.0%)
ⓘ Screening estimate from a state-policy table — verify with the county assessor before closing.
Climate risk First Street
- Flood 1/10 Low FEMA zone X (unshaded) · 0% chance over 30 yrs
- Wildfire 6/10 Major
- Heat 3/10 Moderate 7 d/yr ≥94°F today · 15 d/yr by 30 yrs out
- Wind 1/10 Low
- Air quality 10/10 Extreme 19 unhealthy d/yr today · 21 by 30 yrs out
Nearby sold comps map
Loading sold comps map…
Walkable amenities ~0.75 mi
Loading nearby amenities…
Taxation est. · year 1
- Rental income
- $26,865
- − Mortgage interest
- −$9,904
- − Property taxes
- −$4,673
- − Insurance
- −$884
- − Repairs & maintenance
- −$2,149
- − Management
- −$2,149
- − Depreciation
- −$5,143
- Taxable income
- $1,963
- Est. tax owed @ 24.0%
- −$471
- After-tax cash flow
- $4,069/yr
For passive investors: Depreciation is non-cash, so a rental often shows a tax loss while cash-flowing — sheltering income. Rental losses are passive: they offset passive income freely, and up to $25,000/yr can offset ordinary (W-2) income if you actively participate and your MAGI is under $100k (phasing out to $0 by $150k); unused losses carry forward. On sale, claimed depreciation is recaptured at up to 25%, and gains may owe capital-gains tax (a 1031 exchange can defer both). Figures are a year-1 estimate at your 24.0% rate — not tax advice; consult a CPA.
Schools (NCES district)
- District
- Spokane School District
- NCES district ID
- 5308250
- Math proficiency
- 47% ▲ 1.00%
- Reading proficiency
- 58% ▲ 1.00%
- Median HH income
- $43,187
- Composite
- 46.1/100
- National rank
- #5477
- State rank
- #136 of 291 in WA
Livability — Spokane
- Score
- 80/100
- State rank
- #93
- US rank
- #1822
Category grades
Schools grade is shown separately in the Schools card above.
Census & demographics
- Census place
- Spokane, WA
- County
- Spokane County · 496,401 people
- City population
- 298,820
- Metro
- Spokane-Spokane Valley, WA
- Population (ZIP)
- 21,441
- Household income
- $73,620
- Rent vs Own
- Severe rent burden
- 630.0
Population outlook (Spokane County) Hauer SSP2
- Today (2025)
- 531,314 people
- By 2030
- 549,278 · +3.4%
- By 2040
- 577,822 · +8.8%
- By 2050
- 598,188 · +12.6%
- By 2075
- 630,744 · +18.7%
- By 2100
- 622,360 · +17.1%
Race, ethnicity, and origin ACS 2023
- Neighborhood character
- Predominantly White (79%)
- Race & ethnicity
- White 79% Two or more races 10% Hispanic / Latino 8% Asian 4% Pacific Islander 1% Native American 1%
- Hispanic origin (detail)
- Mexican 6%
- Common ancestry
- Portuguese 4% Scotch-Irish 4% Iranian 3%
- Foreign-born
- 12% · Canada, Vietnam
- Languages at home
- 85% English-only · Russian/Polish/Slavic 6% Spanish 3% Other Asian/Pacific 2%
Political lean MEDSL · Spokane
- 2024 margin
- Toss-up / Even · D 46.0% · R 51.0% · Other 3.0%
- 2008→2024 swing
- -3.8pp toward R · 2008: -1.1pp · 2024: -5.0pp
- All cycles
- 2024: R+5.0 2020: R+4.3 2016: R+8.3 2012: R+6.3 2008: R+1.1
Not yet ingested
- Civics
- —
Market trends
- HPI YoY
- ▼ -152.19%
- Current HPI
- 343.0283
- Rent YoY
- ▲ 9.52%
- Metro
- Spokane-Spokane Valley, WA
- State GDP YoY
- ▲ 4.65%
- F500 in state
- 22
Industry mix (Fortune 500 HQ in WA)
| Industry | F500 HQs | Revenue |
|---|---|---|
| Retail | 2 | $269B |
|
||
| Technology / Retail | 1 | $638B |
|
||
| Technology | 1 | $245B |
|
||
| Telecommunications | 1 | $38B |
|
||
| Food / Beverage | 1 | $36B |
|
||
| Automotive / Trucks | 1 | $34B |
|
||
Price history
+194.7% since first listed4 events — show timeline
- 2026-05-19 Pending — NWMLS as Distributed by MLS Grid
- 2026-04-27 Listed $176,800 NWMLS as Distributed by MLS Grid
- 2000-03-08 Sold (Public Records) $98,000 Public Records
- 1996-01-02 Sold (Public Records) $60,000 Public Records
Property tax history
+6.6%/yrLatest (2026): $4,673 · +3.5% YoY. Source: county tax records.
Cash-flow waterfall
monthlySold comps — $/sqft
last 12 mo · ≤1 miLoading sold comps…