 Fourplex
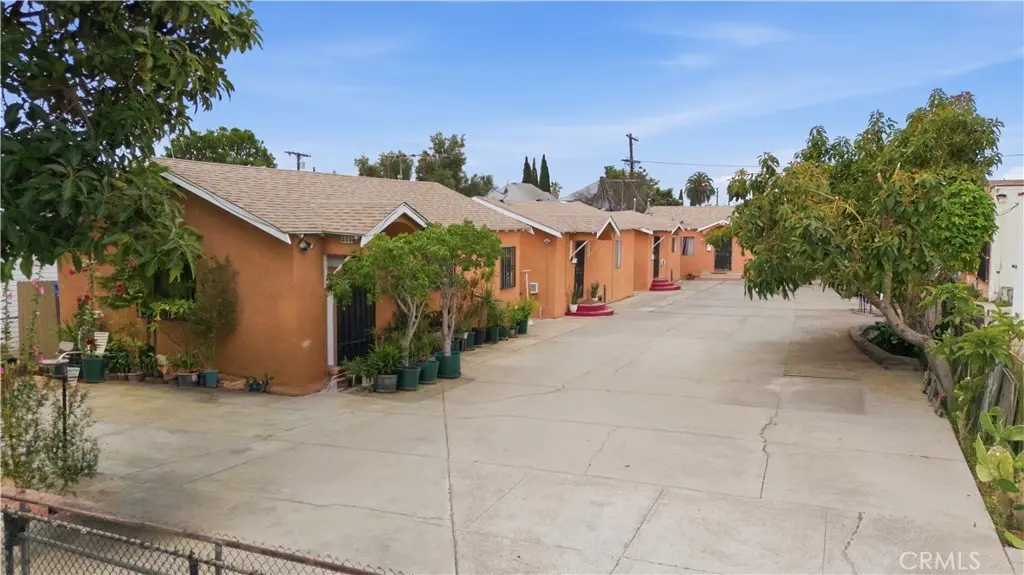
2229 Hancock St · Los Angeles, CA
Flood risk 1/10 · Minimal
- FEMA flood zone
- X (unshaded)
- Chance of flooding over 30 yrs
- 0.0%
- Est. flood insurance / yr
- $507 – $1,088
Fire risk 1/10 · Minimal
- Est. fire insurance / yr
- $659 – $1,223
Heat risk 6/10 · Moderate
- Hot days now (above 96°F)
- 7 days/yr
- Hot days in 30 yrs
- 22 days/yr
Wind risk 1/10 · Minimal
- Chance of severe wind over 30 yrs
- —
Air-quality risk 6/10 · Moderate
- Unhealthy air days now
- 11 days/yr
- Unhealthy air days in 30 yrs
- 12 days/yr
Risk factors via First Street. Map © Google.
Why this score? — see what drove the D+ grade
The composite is a weighted blend of 9 inputs, each scored 0–100. Each bar is that input's sub-score; the figure is the points it added to the 100-point composite (weight × sub-score).
- Cash flow +15.5/30.0
- ARV discount +7.5/15.0
- DSCR +4.8/10.0
- 1% rule +4.1/10.0
- Rent growth +3.8/5.0
- Schools +3.6/10.0
- Livability +3.4/5.0
- Condition / age +2.5/5.0
- Appreciation +0.0/10.0
$785,000
🖨 Deal sheet (PDF) 📄 Offer letter ✓ Due diligence
Multi-family units
County records classify this as Multi-Family (2-4 Unit). Listing-text estimate: 4 units. confirmed
Listing remarks
Lincoln Heights fourplex , ONE UNIT DELIVERED VACANT NOW HURRY !Rare opportunity featuring 4 detached standalone bungalow-style homes on an expansive 9,899 sq ft LARD3-zoned lot in rapidly evolving Northeast Los Angeles. Unlike traditional apartment-style properties, each unit enjoys its own separate structure, creating a more private residential feel perfect for future Owner-Users and tenants alike . The property offers a wide central driveway, excellent unit separation, and strong value-add potential with 1 Unit VACANT and Future Owner establishing Residency in the 2 bedroom unit ! The property consists of one 2-bedroom unit and three 1-bedroom units totaling approximately 2,394 sq ft of
Key facts
- Expansive lot
- Centrally located
- 9,899 sq ft lot
Tags
Property features AI
Finance
- Other: Four separate buildings comprising four total units; Total building area reported as 2,394
- Financial info: Gross scheduled income: $42,840; Gross income: $42,840; Total actual rent currently: $3,570; Net operating income: $29,020; Operating expenses: $13,812; Expenses detail includes insurance and utilities (insurance $4,000; water/sewer $1,800; trash $1,800); Rent control applies; Tenant pays gas and electricity; Vacancy allowance: 0
- HOA & community: Community features include biking, street lighting, sidewalks and an urban setting
Exterior
- Parking: Assigned parking spaces; Driveway parking; Each unit shown with 2 garage spaces
- Security: Accessible parking available
- Utilities: Public sewer; District/public water; Separate gas and electric meters for units (4 gas meters, 4 electric meters); One separate water meter for the property
- Home design: Single-story building; No shared/common walls; Has a view; Entry level: 1
- Construction: Composition roof; Property built (year source: assessor)
- Exterior features: No pool; Front yard; Walkstreet; Near public transit; Park nearby
Interior
- Kitchen: Gas cooktop; Gas range
- Bedrooms: Combination of one- and two-bedroom units (unit mix includes 1-bed and 2-bed units)
- Flooring: Vinyl flooring; Laminate flooring
- Bathrooms: All units have one full bathroom
- Heating & cooling: Wall heaters; Wall/window air conditioning
- Interior features: One-level layout; All bedrooms on ground level; Screens on windows; Entry at ground level
- Laundry & utility: No on-site laundry listed
Neighborhood map
What this means for you Summary
Snapshot
- This is a 1×2bd/1.0ba + 3×1bd/1.0ba units multifamily listed at $785k.
Deal economics
- At list price, monthly cash flow is $320 ($4k/yr) — positive. Per door: $80/mo.
- The deal already cash-flows at list — no discount required.
- To meet the 1% rule (rent ≥ 1% of price), the offer needs to be $711k (9.4% below list).
- Recommended offer: $711k (9.4% below list) — sets the bar for 1% rule.
- Cap rate 6.8% vs local median 2.1% in Los Angeles — top-decile yield for the area; either an underpriced asset or a hidden risk that comps aren't pricing in. Stress-test before assuming the spread holds.
Location & tenants
- Location reads 68/100 on livability (#273 in CA) — a middle-class / working-renter tenant base. Strengths: amenities A+, commute A+, employment B; Watch: health & safety C-, crime F, cost of living F.
- Los Angeles Unified (urban): math 29% / reading 54% proficiency, ranked #223 of 517 in CA (top 43%) — families likely to look elsewhere, expect single-tenant / working-renter base with shorter leases; 67% free/reduced lunch — lower-income household profile, screen leases tightly.
- Zoned schools: Griffin Avenue Elementary (335 students, 93% FRL); Florence Nightingale Middle (790 students, 93% FRL); Woodrow Wilson Senior High (math 23% / reading 59%, grade F, #502 of 1,170 statewide, top 43%, 1,406 students, 93% FRL) — zoned schools average 93% FRL vs 67% district-wide (26 pts higher); higher-poverty schools than district average — tighter screening recommended.
- Market conditions: Rents rising fast (+5.1%/yr); 126 active listings in the ZIP; 40 comparable units currently listed for rent nearby; rentals at typical pace (median 22d on market — plan ~3-4 weeks tenant-placement turnaround); 19,697 units permitted in Los Angeles County in 2024 (9,426 in 5+ unit buildings).
- At $7,113/mo this rent would consume 135% of the median local household income ($63k/yr) (locally 2683% of renters already pay >50% of income on rent) — very limited rent-growth headroom before tenants either downsize or default.
Forward outlook
- Local home prices are declining (-3.0%/yr); year-one equity from $5k of loan paydown is wiped out by about $24k of value loss. Plan a longer hold.
- Los Angeles County population projected at +9% by 2050 — modest demand growth; plan on rents tracking national, not racing it.
Negotiation context
- It's been on market 25 days — a 2% lower offer ($773k) is reasonable based on typical stale-listing flexibility.
- 5 sale attempts since 5y ago with the ask held roughly flat each time — persistent listings suggest the price (not the market) is what's stuck; bring a comps-based counter.
Risks & watch-outs
- Watch-outs: built in 1920 — expect roof / HVAC / electrical / plumbing capex.
- Climate carrying-cost: extreme-heat days projected 7→22/yr by 2055 (HVAC capex compounding) — expect insurance premiums to compound above CPI over the hold.
Questions for the listing agent
- Can we see the unit-by-unit rent roll, current vacancy, and any below-market leases? What's the average tenancy length?
- What capital expenditures (roof, boiler, parking lot, exteriors) have been made in the last 5 years, and what's planned in the next 2?
- Built in 1920 — when were the roof, HVAC, electrical panel, plumbing, and water heater last replaced?
- Is there a deadline driving the sale (1031 exchange, divorce, estate, relocation)? That informs how much negotiation room exists.
- Schools are D-rated, which usually means shorter tenancies and higher turnover. Who's the typical renter profile here, and what's been the actual vacancy rate?
- Crime grade is F in this area — have there been break-ins, vandalism, or insurance claims at this property in the last 3 years? What carrier currently insures it and at what premium?
- The area grade is low — what's the realistic commute time and amenity access for the typical tenant pool here? Any planned neighborhood developments (good or bad) we should know about?
- What's the average days-on-market for RENTAL listings here right now (not sales)? A rising rental-DOM trend means longer vacancies and softer asking-rent achievability than the comps imply.
- What's the recent tenant-quality profile in this submarket — average credit score on applications, eviction rate, late-payment / NSF rate, and stable-employment percentage? A property-management company in the area should have these aggregated.
- How much new apartment / multifamily construction is in the pipeline within 1–3 miles? Heavy new supply (>2% of stock underway) typically softens rents 12–24 months out; light construction supports rent growth.
Investment metrics
- 1% rule
- 0.91% ✗
- Cap rate
- 6.78%
- Cash-on-cash
- 1.75%
- DSCR
- 1.08
- GRM
- 9.2
CMA / ARV
No comps found within radius.
Projected returns pro-forma
-3.0% appreciation · 5.11% rent growth · sell at horizon
- IRR
- -11.2%
- Equity multiple
- 0.58×
- Total profit
- $-91,389
- Equity at exit
- $117,046
- IRR
- 0.8%
- Equity multiple
- 1.06×
- Total profit
- $12,828
- Equity at exit
- $67,872
Cash invested: $219,800 (down + closing). Projections, not guarantees.
Landlord ↔ Tenant lean methodology
- Overall (CITY)
- 0 Strongly Tenant-Friendly
- State California
- 18 Strongly Tenant-Friendly · D+13
- County
- — inherits STATE
- City Los Angeles
- 0 Strongly Tenant-Friendly · D+22
ZIP-level market 90031
- Rents YoY
- 5.1%
- Active inventory
- 126
- Price-to-rent
- 31.6×
Monthly cashflow live
- Estimated rent
- $7,113 high interval (Pro) →
- Mortgage (P&I)
- −$4,117
- Tax from tax record
- −$856 /mo · $10,270/yr
- Insurance
- −$327
- HOA
- −$0
- Vacancy / Maint / Mgmt
- −$1,494
- Net cashflow
- $320
Break-even live
Sensitivity live
| Price | -10% $764 | -5% $542 | +0% $320 | +5% $98 | +10% $-125 |
|---|---|---|---|---|---|
| Rent | -10% $-242 | -5% $39 | +0% $320 | +5% $601 | +10% $882 |
| Rate | -1.0pp $715 | -0.5pp $519 | base $320 | +0.5pp $116 | +1.0pp $-91 |
4-unit breakdown (identical units grouped — click to expand)
| Units | Beds | Baths | Est. rent |
|---|---|---|---|
| 1× unit | 2 | 1 | $2,069 |
| 3× units | 1 | 1 | $5,043 |
| #2 | 1 | 1 | $1,681 |
| #3 | 1 | 1 | $1,681 |
| #4 | 1 | 1 | $1,681 |
| Total (4 units) | $7,113 | ||
UW: 25.0% down · 7.5% · 30yr · 1.5% tax · 5.0% vac · 8.0% maint · 8.0% mgmt
Financing live
Cash to close
- Down payment
- $196,250
- Closing costs
- $23,550
- Reserves months
- —
- Total cash needed
- —
Loan-product check · same deal, 3 products live
Conventional
25% down · 7.5% · 30yr
- Down + closing
- —
- Monthly P&I
- —
- Monthly cashflow
- —
- DSCR
- —
- Eligible?
- —
Personal DTI + credit; lowest rate.
DSCR
20% down · 8.5% · 30yr
- Down + closing
- —
- Monthly P&I
- —
- Monthly cashflow
- —
- DSCR
- —
- Eligible?
- —
No personal income docs; deal must DSCR.
Hard money
10% down · 12.0% · 12mo
- Down + closing
- —
- Monthly P&I
- —
- Monthly cashflow
- —
- DSCR
- —
- Eligible?
- —
Short-term bridge; refi at stabilization.
Rent comps 40 comps
| Address | Beds | Baths | Sqft | Rent | $/sqft | DOM | Units | Dist |
|---|---|---|---|---|---|---|---|---|
| 3020 Altura St Apt 3 Lincoln Heights, CA | 1.0 | 1.0 | 600 | $1,850 | $3.08 | 24d | 1 | 0.30mi |
| 2422 Sichel St Los Angeles, CA | 1.0 | 1.0 | 680 | $1,895 | $2.79 | 26d | 1 | 0.32mi |
| 2431 Sichel St Apt 204 Los Angeles, CA | — | 1.0 | 500 | $1,500 | $3.00 | 26d | 1 | 0.36mi |
| 3421 N Mission Rd Lincoln Heights, CA | — | 1.0 | 700 | $1,495 | $2.14 | 19d | 1 | 0.37mi |
| 2819 1/2 Altura St Los Angeles, CA | 2.0 | 1.0 | 720 | $2,250 | $3.12 | 1d | 1 | 0.38mi |
| 2205 Daly St Unit G Lincoln Heights, CA | 1.0 | 1.0 | 700 | $1,800 | $2.57 | 1d | 1 | 0.38mi |
| 2349 Lincoln Park Ave Los Angeles, CA | 1.0 | 1.0 | 600 | $1,795 | $2.99 | 45d | 1 | 0.40mi |
| 2532 Daly St Los Angeles, CA | — | 1.0 | 325 | $1,074 | $3.31 | 16d | 3 | 0.52mi |
| 323 S Avenue 20 Los Angeles, CA | 1.0 | 1.0 | 599 | $2,287 | $3.82 | 45d | 1 | 0.56mi |
| 323 1/4 South Avenue 20 Los Angeles, CA | 1.0 | 1.0 | 599 | $2,287 | $3.82 | 45d | 1 | 0.56mi |
| 141 S Avenue 22 Los Angeles, CA | 2.0 | 1.0 | 750 | $1,950 | $2.60 | 45d | 1 | 0.59mi |
| 1743 Sichel St Los Angeles, CA | 1.0 | 1.0 | 450 | $1,530 | $3.40 | 1d | 1 | 0.60mi |
| 2814 Sichel St Los Angeles, CA | — | 1.0 | 500 | $1,695 | $3.39 | 21d | 1 | 0.64mi |
| 2814 Sichel St Unit 3 Lincoln Heights, CA | — | 1.0 | 500 | $1,695 | $3.39 | 26d | 1 | 0.64mi |
| 1709 Sichel St Unit 1711 Lincoln Heights, CA | 1.0 | 1.0 | 702 | $2,150 | $3.06 | 5d | 1 | 0.66mi |
| 1740 Workman St Unit 214 Lincoln Heights, CA | 1.0 | 1.0 | 650 | $1,750 | $2.69 | 21d | 1 | 0.66mi |
| 1740 Workman St Unit 101 Lincoln Heights, CA | 1.0 | 1.0 | 650 | $1,850 | $2.85 | 21d | 1 | 0.66mi |
| 1740 Workman St Unit 105 Lincoln Heights, CA | 1.0 | 1.0 | 650 | $1,725 | $2.65 | 45d | 1 | 0.66mi |
| 1734 Workman St Unit 311 Lincoln Heights, CA | 1.0 | 1.0 | 650 | $1,775 | $2.73 | 45d | 1 | 0.67mi |
| 2020 Barranca St Los Angeles, CA | 3.0 | 1.0–3.0 | 705 | $2,228 | $3.16 | 5d | 13 | 0.82mi |
| 2620 Commodore St Los Angeles, CA | 1.0 | 1.0 | 600 | $1,800 | $3.00 | 45d | 1 | 0.83mi |
| 144 East Avenue 33 Unit 3 Los Angeles, CA | 1.0 | 1.0 | 700 | $1,650 | $2.36 | 20d | 1 | 0.84mi |
| 360 W Avenue 26 #323 Los Angeles, CA | — | 1.0 | 630 | $2,250 | $3.57 | 45d | 1 | 0.91mi |
| 131 West Avenue 34 Lincoln Heights, CA | 2.0 | 1.0–2.0 | 869 | $4,092 | $4.71 | 0d | 179 | 0.97mi |
| 1529 Tremont St Unit 1/2 Los Angeles, CA | 1.0 | 1.0 | 650 | $1,750 | $2.69 | 1d | 1 | 1.01mi |
| 1041 N Cummings St Los Angeles, CA | 1.0 | 1.0 | 707 | $2,150 | $3.04 | 26d | 1 | 1.04mi |
| 2573 1/2 Lancaster Ave Unit 2522 Los Angeles, CA | 1.0 | 1.0 | 500 | $2,200 | $4.40 | 9d | 1 | 1.05mi |
| 1126 Cornwell St Los Angeles, CA | 1.0–2.0 | 1.0–2.0 | 920 | $2,495 | $2.71 | 1d | 3 | 1.05mi |
| 1030 Brittania St Los Angeles, CA | 1.0 | 1.0 | 500 | $1,775 | $3.55 | 45d | 1 | 1.05mi |
| 1063 N Chicago St Unit 8 Los Angeles, CA | — | 1.0 | 350 | $1,500 | $4.29 | 45d | 1 | 1.05mi |
| 1220 1/4 N Soto St Los Angeles, CA | 1.0 | 1.0 | 525 | $1,549 | $2.95 | 9d | 1 | 1.09mi |
| 2416 Chelsea St Unit & 1216 Los Angeles, CA | 1.0 | 1.0 | 525 | $1,604 | $3.06 | 1d | 1 | 1.09mi |
| 2416 Chelsea St Unit 2406 Los Angeles, CA | 1.0 | 1.0 | 525 | $1,549 | $2.95 | 26d | 1 | 1.09mi |
| 2416 Chelsea St Unit 1222 Los Angeles, CA | 1.0 | 1.0 | 525 | $1,549 | $2.95 | 1d | 1 | 1.09mi |
| 3607 Griffin Ave Los Angeles, CA | 1.0 | 1.0 | 700 | $1,850 | $2.64 | 45d | 1 | 1.10mi |
| 3607 Griffin Ave Unit 3 Los Angeles, CA | 1.0 | 1.0 | 500 | $1,850 | $3.70 | 21d | 1 | 1.10mi |
| 4321 Beagle St Los Angeles, CA | 1.0 | 1.0 | 630 | $1,850 | $2.94 | 22d | 1 | 1.14mi |
| 200 Mesnager St #1247 Los Angeles, CA | 1.0 | 1.0 | 502 | $2,750 | $5.47 | 4d | 2 | 1.15mi |
| 200 Mesnager St Los Angeles, CA | 1.0–2.0 | 1.0–2.0 | 803 | $2,443 | $3.04 | 0d | 63 | 1.15mi |
| 3907 Berenice Pl Los Angeles, CA | 1.0 | 1.0 | 750 | $3,595 | $4.79 | 45d | 1 | 1.17mi |
Listing history 24 events
-
2026-06-21days on market $785,000 Active 25 DOM
-
2026-06-18days on market $785,000 Active 22 DOM
-
2026-06-17days on market $785,000 Active 21 DOM
-
2026-06-16days on market $785,000 Active 20 DOM
-
2026-06-15days on market $785,000 Active 19 DOM
-
2026-06-13days on market $785,000 Active 17 DOM
-
2026-06-09days on market $785,000 Active 13 DOM
-
2026-06-08days on market $785,000 Active 12 DOM
-
2026-06-07days on market $785,000 Active 11 DOM
-
2026-06-04days on market $785,000 Active 8 DOM
-
2026-06-03days on market $785,000 Active 7 DOM
-
2026-06-02days on market $785,000 Active 6 DOM
-
2026-06-01days on market $785,000 Active 5 DOM
-
2026-05-31days on market $785,000 Active 4 DOM
-
2026-05-27$785,000 Active
-
2023-04-25price
-
2023-01-17price
-
2022-11-16Active
-
2022-07-01price
-
2022-05-26Active
-
2022-01-11Active
-
2021-11-08Active
-
2021-05-24soldstatus $745,000
-
1989-08-01soldstatus $260,000
ⓘ Source: listings_history table (triggers on properties + properties_extension) + one-shot
backfill from property_details.listing_events for pre-trigger history.
Tax reassessment forecast CA · Resets to sale price
- Current annual tax
- $10,270 · $856/mo
- Projected year-2 tax
- $10,270 · $856/mo
- Expected delta
- $0/yr ($0/mo · 0.0%)
ⓘ Screening estimate from a state-policy table — verify with the county assessor before closing.
Climate risk First Street
- Flood 1/10 Low FEMA zone X (unshaded) · 0% chance over 30 yrs
- Wildfire 1/10 Low
- Heat 6/10 Major 7 d/yr ≥96°F today · 22 d/yr by 30 yrs out
- Wind 1/10 Low
- Air quality 6/10 Major 11 unhealthy d/yr today · 12 by 30 yrs out
Nearby sold comps map
Loading sold comps map…
Walkable amenities ~0.75 mi
Loading nearby amenities…
Taxation est. · year 1
- Rental income
- $85,356
- − Mortgage interest
- −$43,972
- − Property taxes
- −$10,270
- − Insurance
- −$3,925
- − Repairs & maintenance
- −$6,828
- − Management
- −$6,828
- − Depreciation
- −$22,836
- Taxable loss
- −$9,304
- Est. tax savings @ 24.0%
- +$2,233
- After-tax cash flow
- $6,070/yr
For passive investors: Depreciation is non-cash, so a rental often shows a tax loss while cash-flowing — sheltering income. Rental losses are passive: they offset passive income freely, and up to $25,000/yr can offset ordinary (W-2) income if you actively participate and your MAGI is under $100k (phasing out to $0 by $150k); unused losses carry forward. On sale, claimed depreciation is recaptured at up to 25%, and gains may owe capital-gains tax (a 1031 exchange can defer both). Figures are a year-1 estimate at your 24.0% rate — not tax advice; consult a CPA.
Schools (NCES district)
- District
- Los Angeles Unified
- NCES district ID
- 0622710
- Math proficiency
- 29% ▼ -4.00%
- Reading proficiency
- 54% ▲ 10.00%
- Median HH income
- $50,403
- Composite
- 35.67/100
- National rank
- #4875
- State rank
- #223 of 517 in CA
Livability — Los Angeles
- Score
- 68/100
- State rank
- #273
- US rank
- #9237
Category grades
Schools grade is shown separately in the Schools card above.
Census & demographics
- Census place
- Los Angeles, CA
- County
- Los Angeles County · 9,444,647 people
- City population
- 3,838,149
- Metro
- Los Angeles-Long Beach-Anaheim, CA
- Population (ZIP)
- 36,127
- Household income
- $63,090
- Rent vs Own
- Severe rent burden
- 2683.0
Population outlook (Los Angeles County) Hauer SSP2
- Today (2025)
- 10,940,515 people
- By 2030
- 11,256,481 · +2.9%
- By 2040
- 11,729,929 · +7.2%
- By 2050
- 11,948,407 · +9.2%
- By 2075
- 11,818,114 · +8.0%
- By 2100
- 10,842,928 · -0.9%
Race, ethnicity, and origin ACS 2023
- Neighborhood character
- Diverse neighborhood (Simpson 0.57)
- Race & ethnicity
- Hispanic / Latino 57% Asian 29% Two or more races 11% White 9% Native American 2% Black 2%
- Hispanic origin (detail)
- Mexican 40%
- Common ancestry
- Italian 1% Slovak 1%
- Foreign-born
- 46% · Canada, China, Vietnam
- Languages at home
- 26% English-only · Spanish 48% Chinese 14% Other Asian/Pacific 3%
Political lean MEDSL · Los Angeles
- 2024 margin
- Solid D (+32.9) · D 64.8% · R 31.9% · Other 3.3%
- 2008→2024 swing
- -7.4pp toward R · 2008: 40.4pp · 2024: 32.9pp
- All cycles
- 2024: D+32.9 2020: D+44.2 2016: D+48.0 2012: D+40.0 2008: D+40.4
Not yet ingested
- Civics
- —
Market trends
- HPI YoY
- ▼ -762.68%
- Current HPI
- 523.6412
- Rent YoY
- ▲ 5.11%
- Metro
- Los Angeles-Long Beach-Anaheim, CA
- State GDP YoY
- ▲ 3.21%
- F500 in state
- 116
Industry mix (Fortune 500 HQ in CA)
| Industry | F500 HQs | Revenue |
|---|---|---|
| Technology | 27 | $1,492B |
|
||
| Financial Services | 3 | $174B |
|
||
| Retail | 3 | $44B |
|
||
| Insurance | 3 | $26B |
|
||
| Media / Entertainment | 2 | $115B |
|
||
| Pharmaceuticals / Biotech | 2 | $62B |
|
||
Price history
+201.9% since first listed10 events — show timeline
- 2026-05-27 Listed $785,000 CRMLS
- 2023-04-25 Price Changed — TheMLS
- 2023-01-17 Price Changed — TheMLS
- 2022-11-16 Listed — TheMLS
- 2022-07-01 Price Changed — TheMLS
- 2022-05-26 Listed — TheMLS
- 2022-01-11 Listed — TheMLS
- 2021-11-08 Listed — TheMLS
- 2021-05-24 Sold (Public Records) $745,000 Public Records
- 1989-08-01 Sold (Public Records) $260,000 Public Records
Property tax history
+4.8%/yrLatest (2025): $10,270 · +1.4% YoY. Source: county tax records.
Cash-flow waterfall
monthlySold comps — $/sqft
last 12 mo · ≤1 miLoading sold comps…