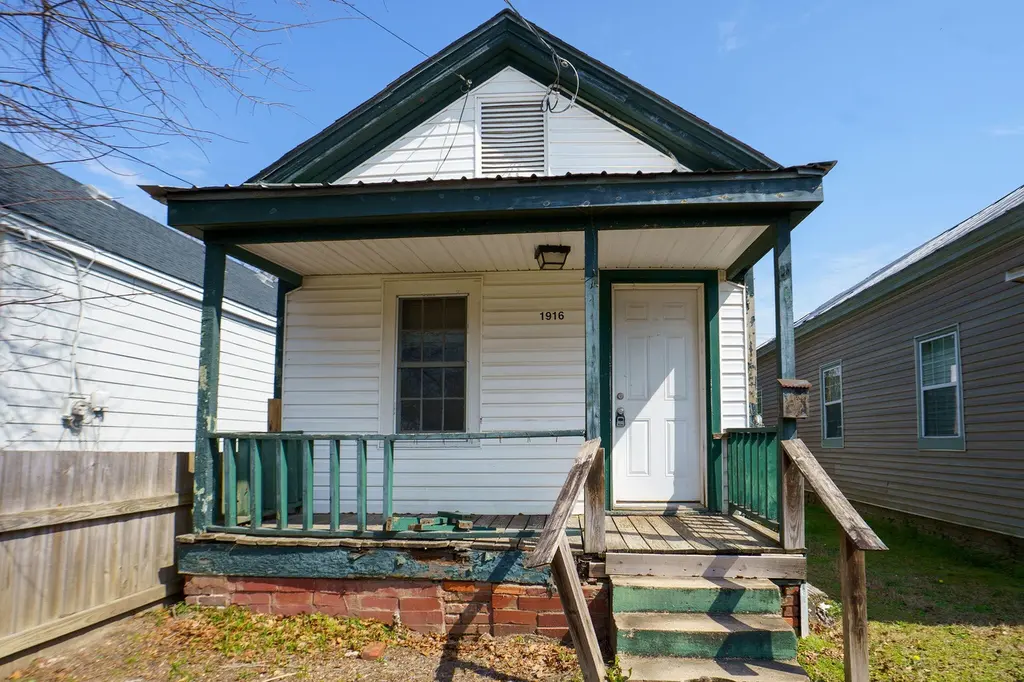
1916 Walker St · Augusta-Richmond County consolidated government (balance), GA
Flood risk 1/10 · Minimal
- FEMA flood zone
- X (unshaded)
- Chance of flooding over 30 yrs
- 0.0%
- Est. flood insurance / yr
- $507 – $1,088
Fire risk 1/10 · Minimal
- Est. fire insurance / yr
- $963 – $1,789
Heat risk 8/10 · Major
- Hot days now (above 108°F)
- 7 days/yr
- Hot days in 30 yrs
- 17 days/yr
Wind risk 6/10 · Moderate
- Chance of severe wind over 30 yrs
- 64.0%
Air-quality risk 4/10 · Minor
- Unhealthy air days now
- 4 days/yr
- Unhealthy air days in 30 yrs
- 4 days/yr
Risk factors via First Street. Map © Google.
Why this score? — see what drove the B grade
The composite is a weighted blend of 9 inputs, each scored 0–100. Each bar is that input's sub-score; the figure is the points it added to the 100-point composite (weight × sub-score).
- Cash flow +30.0/30.0
- ARV discount +15.0/15.0
- 1% rule +10.0/10.0
- DSCR +10.0/10.0
- Rent growth +3.6/5.0
- Livability +2.5/5.0
- Condition / age +2.5/5.0
- Schools +1.3/10.0
- Appreciation +0.0/10.0
$49,400
🖨 Deal sheet 📄 Offer letter ✓ Due diligence
Listing remarks
Charming 1-bedroom cottage offering an excellent investment opportunity! With a little TLC, it has great potential to shine. Conveniently located just minutes from downtown Augusta, the medical district, and local colleges. Property is being sold as-is.
Key facts
- Local colleges
- Medical district
- 3,485 sq ft lot
Tags
Property features AI
Exterior
- Parking: See remarks for parking details
- Utilities: Public water; Public sewer; Water and sewer available
- Home design: Single-family residence; One story; Entry on level 1; Wood siding (see remarks)
- Construction: Composition roof; Wood siding construction; Crawl space/no basement
- Exterior features: Front porch; Fenced yard; Paved road access; Has a view
Interior
- Bedrooms: 3 total rooms (includes bedrooms and other rooms)
- Flooring: Carpet; Vinyl
- Bathrooms: 1 full bathroom
- Heating & cooling: Heating with fireplace; Ceiling fan cooling
- Interior features: Ceiling fans; Window coverings; Fireplace
Neighborhood map
What this means for you Summary
Snapshot
- This is a 1-bed/1.0-bath single-family listed at $49k.
Deal economics
- At list price, monthly cash flow is $514 ($6k/yr) — positive.
- The deal already cash-flows at list — no discount required.
- Meets the 1% rule at list price ($1k rent vs $49k).
- Recommended offer: $48k (3.0% below list) — sets the bar for market timing.
- Cap rate 18.8% vs local median 5.3% in Augusta-Richmond County consolidated government (balance) — top-decile yield for the area; either an underpriced asset or a hidden risk that comps aren't pricing in. Stress-test before assuming the spread holds.
Location & tenants
- Location reads: area grade B — affects rentability + tenant quality, not the cash-flow math above.
- Richmond County (urban): math 12% / reading 20% proficiency, ranked #154 of 174 in GA (top 88%) — low school quality limits family demand, transient renter base, plan for 1-2y turnover; 72% free/reduced lunch — lower-income household profile, screen leases tightly.
- Zoned schools: Lamar - Milledge Elementary School (math 12% / reading 12%, grade F, #1,041 of 1,228 statewide, top 87%, 301 students, 98% FRL); W.S. Hornsby Middle School (math 2% / reading 5%, grade F, #468 of 470 statewide, top 100%, 399 students, 98% FRL) — zoned schools average 98% FRL vs 72% district-wide (26 pts higher); higher-poverty schools than district average — tighter screening recommended.
- Market conditions: Rents rising fast (+4.3%/yr); 222 active listings in the ZIP; 40 comparable units currently listed for rent nearby; rentals at typical pace (median 24d on market — plan ~3-4 weeks tenant-placement turnaround); 40% of comp listings sitting > 30 days — soft ceiling on asking rent; 561 units permitted in Richmond County in 2024 (0 in 5+ unit buildings).
Forward outlook
- Local home prices are declining (-3.0%/yr); year-one equity from $342 of loan paydown is wiped out by about $1k of value loss. Plan a longer hold.
- Richmond County population projected to shrink 5% by 2050 — rents likely to lag national; underwrite the cash flow, not the appreciation.
- At projected returns (-3.0% appreciation + 4.3% rent growth), your $14k cash investment doubles in ~3 years — after that, you're playing with house money.
Negotiation context
- It's been on market 36 days — a 3% lower offer ($48k) is reasonable based on typical stale-listing flexibility.
- 7 sale attempts since 2y ago with the ask held roughly flat each time — persistent listings suggest the price (not the market) is what's stuck; bring a comps-based counter.
Risks & watch-outs
- Watch-outs: built in 1906 — expect roof / HVAC / electrical / plumbing capex.
- Climate carrying-cost: major wind risk, 64% chance of damaging wind over 30y; extreme-heat days projected 7→17/yr by 2055 (HVAC capex compounding) — expect insurance premiums to compound above CPI over the hold.
Questions for the listing agent
- It's been on market 36 days. Have you received any prior offers? Is the seller open to a 3% concession, seller financing, or rate buy-down credit?
- Built in 1906 — when were the roof, HVAC, electrical panel, plumbing, and water heater last replaced?
- Is there a deadline driving the sale (1031 exchange, divorce, estate, relocation)? That informs how much negotiation room exists.
- What's the average days-on-market for RENTAL listings here right now (not sales)? A rising rental-DOM trend means longer vacancies and softer asking-rent achievability than the comps imply.
- What's the recent tenant-quality profile in this submarket — average credit score on applications, eviction rate, late-payment / NSF rate, and stable-employment percentage? A property-management company in the area should have these aggregated.
- How much new for-sale + rental construction is in the pipeline within 1–3 miles? Heavy new supply typically softens prices + rents 12–24 months out; constrained supply supports both.
Investment metrics
- 1% rule
- 2.24% ✓
- Cap rate
- 18.78%
- Cash-on-cash
- 44.61%
- DSCR
- 2.98
- GRM
- 3.7
CMA / ARV
- ARV (median comp)
- $63,597
- List price
- $49,400
- Delta
- -22.32%
- Verdict
- UNDERPRICED
- Comps
- 20 within 1.0 mi
Show comp detail 12 sales within ~0.75 mi
| Address | Dist | Beds/Ba | Sqft | Sold | Price | $/sf | Match |
|---|---|---|---|---|---|---|---|
| 1918 Walker St | 0.01mi | 1/1.0 | 780 (-4%) | 3mo | $69,198 | $89 | 91 |
| 1817 Ellis St | 0.25mi | 2/1.0 (+1) | 832 (+3%) | 3mo | $20,000 | $24 | 76 |
| 1961 Battle Row | 0.12mi | 2/1.0 (+1) | 892 (+10%) | 14mo | $64,375 | $72 | 61 |
| 1932 Fenwick St | 0.20mi | 2/1.0 (+1) | 690 (-15%) | 2mo | $45,000 | $65 | 59 |
| 2151 Ellis St | 0.49mi | 2/1.0 (+1) | 825 (+2%) | 18mo | $110,000 | $133 | 54 |
| 1926 Telfair St | 0.08mi | 2/2.0 (+1) | 902 (+12%) | 20mo | $129,000 | $143 | 52 |
| 1740 Starnes St | 0.35mi | 2/1.0 (+1) | 690 (-15%) | 4mo | $65,000 | $94 | 51 |
| 1664 Brinson Street St | 0.53mi | 1/1.0 | 718 (-11%) | 14mo | $60,000 | $84 | 45 |
| 322 Milledge Rd | 0.60mi | 1/1.0 | 729 (-10%) | 15mo | $125,500 | $172 | 43 |
| 2100 Lake Ave | 0.63mi | 2/1.5 (+1) | 888 (+10%) | 6mo | $149,000 | $168 | 42 |
| 2100 Lake Ave | 0.63mi | 2/1.5 (+1) | 888 (+10%) | 6mo | $149,000 | $168 | 42 |
| 324 Milledge Rd | 0.60mi | 2/1.0 (+1) | 709 (-12%) | 15mo | $145,500 | $205 | 34 |
Match score weights: distance 35% · size 25% · config 20% · recency 20%. Top-matched comps best support the ARV.
Projected returns pro-forma
-3.0% appreciation · 4.29% rent growth · sell at horizon
- IRR
- 43.1%
- Equity multiple
- 2.90×
- Total profit
- $26,226
- Equity at exit
- $7,366
- IRR
- 49.8%
- Equity multiple
- 6.15×
- Total profit
- $71,253
- Equity at exit
- $4,271
Cash invested: $13,832 (down + closing). Projections, not guarantees.
Landlord ↔ Tenant lean methodology
- Overall (STATE)
- 90 Strongly Landlord-Friendly
- State Georgia
- 90 Strongly Landlord-Friendly · R+3
- County
- — inherits STATE
- City
- — inherits STATE
ZIP-level market 30904
- Rents YoY
- 4.3%
- Active inventory
- 222
- Price-to-rent
- 3.7×
Monthly cashflow live
- Estimated rent
- $1,107 high interval (Pro) →
- Mortgage (P&I)
- −$259
- Tax from tax record
- −$81 /mo · $972/yr
- Insurance
- −$21
- HOA
- −$0
- Vacancy / Maint / Mgmt
- −$233
- Net cashflow
- $514
Break-even live
UW: 25.0% down · 7.5% · 30yr · 1.5% tax · 5.0% vac · 8.0% maint · 8.0% mgmt
Financing live
Cash to close
- Down payment
- $12,350
- Closing costs
- $1,482
- Reserves months
- —
- Total cash needed
- —
Loan-product check · same deal, 3 products live
Conventional
25% down · 7.5% · 30yr
- Down + closing
- —
- Monthly P&I
- —
- Monthly cashflow
- —
- DSCR
- —
- Eligible?
- —
Personal DTI + credit; lowest rate.
DSCR
20% down · 8.5% · 30yr
- Down + closing
- —
- Monthly P&I
- —
- Monthly cashflow
- —
- DSCR
- —
- Eligible?
- —
No personal income docs; deal must DSCR.
Hard money
10% down · 12.0% · 12mo
- Down + closing
- —
- Monthly P&I
- —
- Monthly cashflow
- —
- DSCR
- —
- Eligible?
- —
Short-term bridge; refi at stabilization.
Rent comps 40 comps
| Address | Beds | Baths | Sqft | Rent | $/sqft | DOM | Units | Dist |
|---|---|---|---|---|---|---|---|---|
| 1836 Greene St Augusta, GA | 1.0 | 1.0 | 620 | $950 | $1.53 | 23d | 1 | 0.13mi |
| 1838 Watkins St Augusta, GA | 2.0 | 1.0 | 672 | $1,050 | $1.56 | 23d | 1 | 0.15mi |
| 1730 Hicks St Apt A Augusta, GA | 2.0 | 1.0 | 750 | $750 | $1.00 | 14d | 1 | 0.26mi |
| 2028 Battle Row Augusta, GA | 2.0 | 2.0 | 1100 | $1,650 | $1.50 | 43d | 1 | 0.33mi |
| 102 Curry St Augusta, GA | 2.0 | 1.0 | 1001 | $895 | $0.89 | 14d | 1 | 0.38mi |
| 102 Curry St Augusta, GA | 2.0 | 1.0 | 1001 | $895 | $0.89 | 23d | 1 | 0.38mi |
| 531 Tubman St Augusta, GA | 2.0 | 1.0 | 864 | $1,250 | $1.45 | 43d | 1 | 0.41mi |
| 1701 Goodrich St Augusta, GA | 1.0–3.0 | 1.0–2.0 | 1056 | $1,631 | $1.54 | 14d | 11 | 0.47mi |
| 2165 Telfair St Unit B Augusta, GA | 2.0 | 1.0 | 825 | $800 | $0.97 | 14d | 1 | 0.53mi |
| 2165 Telfair St Unit A Augusta, GA | 2.0 | 1.0 | 825 | $850 | $1.03 | 43d | 1 | 0.53mi |
| 2165 1/2 Telfair St Augusta, GA | 2.0 | 1.0 | 825 | $800 | $0.97 | 14d | 1 | 0.54mi |
| 2097 Heckle St Unit B Augusta, GA | 1.0 | 1.0 | 700 | $1,095 | $1.56 | 14d | 1 | 0.58mi |
| 1606 Broad St Augusta, GA | 2.0 | 2.0 | 1066 | $1,200 | $1.13 | 23d | 1 | 0.62mi |
| 1202 Holden Dr Augusta, GA | 2.0 | 1.0 | 675 | $1,150 | $1.70 | 43d | 1 | 0.71mi |
| 1220 Holden Dr Augusta, GA | 2.0 | 1.0 | 675 | $1,095 | $1.62 | 43d | 1 | 0.73mi |
| 501 Milledge Rd Augusta, GA | 2.0 | 1.0 | 1008 | $1,098 | $1.09 | 14d | 2 | 0.73mi |
| 1240 Holden Dr Augusta, GA | 2.0 | 1.0 | 675 | $1,095 | $1.62 | 43d | 1 | 0.82mi |
| 930 Hickman Rd Unit C Augusta, GA | 1.0 | 1.0 | 600 | $950 | $1.58 | 14d | 1 | 0.83mi |
| 930 Hickman Rd Unit F Augusta, GA | 1.0 | 1.0 | 600 | $995 | $1.66 | 43d | 1 | 0.83mi |
| 936 Hickman Rd Unit 7 Augusta, GA | 1.0 | 1.0 | 600 | $995 | $1.66 | 43d | 1 | 0.84mi |
| 936 Hickman Rd Unit 3 Augusta, GA | 2.0 | 2.0 | 875 | $1,195 | $1.37 | 14d | 1 | 0.84mi |
| 938 Hickman Rd Unit 8 Augusta, GA | 1.0 | 1.0 | 600 | $995 | $1.66 | 14d | 1 | 0.85mi |
| 938 Hickman Rd Unit 6 Augusta, GA | 1.0 | 1.0 | 550 | $875 | $1.59 | 43d | 1 | 0.85mi |
| 1450 Greene St Augusta, GA | 1.0 | 1.0 | 720 | $1,480 | $2.06 | 43d | 1 | 0.98mi |
| 1313 Wilson St Apt C Augusta, GA | 2.0 | 2.0 | 900 | $1,350 | $1.50 | 43d | 1 | 1.06mi |
| 2016 Central Ave Unit A Augusta, GA | 1.0 | 1.0 | 900 | $1,000 | $1.11 | 23d | 1 | 1.09mi |
| 1399 Walton Way Augusta, GA | 2.0 | 2.0 | 1017 | $1,690 | $1.66 | 23d | 1 | 1.10mi |
| 1399 Walton Way Augusta, GA | 1.0 | 1.0 | 582 | $1,401 | $2.41 | 43d | 1 | 1.10mi |
| 1328 Baker Ave Augusta, GA | 2.0 | 1.0 | 761 | $975 | $1.28 | 43d | 1 | 1.11mi |
| 1912 Richmond Ave Unit 1912 Augusta, GA | 2.0 | 1.0 | 812 | $1,195 | $1.47 | 14d | 1 | 1.12mi |
| 1110 Troupe St Augusta, GA | 2.0 | 1.0 | 1035 | $1,100 | $1.06 | 23d | 1 | 1.16mi |
| 1112 Troupe St Augusta, GA | 2.0 | 1.0 | 1035 | $1,100 | $1.06 | 23d | 1 | 1.16mi |
| 339 Railroad Ave North Augusta, SC | 1.0–2.0 | 1.0–2.0 | 956 | $1,459 | $1.53 | 14d | 27 | 1.21mi |
| 1480 Wrightsboro Rd Augusta, GA | 1.0 | 1.0 | 775 | $1,628 | $2.10 | 14d | 1 | 1.22mi |
| 1480 Wrightsboro Rd Augusta, GA | 1.0–3.0 | 1.0–2.0 | 1046 | $1,350 | $1.29 | 21d | 13 | 1.22mi |
| 505 13th St Augusta, GA | 2.0 | 2.0 | 950 | $1,122 | $1.18 | 43d | 3 | 1.23mi |
| 2198 Central Ave Unit D Augusta, GA | 2.0 | 1.0 | 900 | $950 | $1.06 | 23d | 1 | 1.27mi |
| 1425 Lee Beard Way Augusta, GA | 1.0–2.0 | 1.0 | 776 | $923 | $1.19 | 43d | 1 | 1.33mi |
| 302 Crystal Lake Dr North Augusta, SC | 1.0 | 1.0 | 540 | $1,135 | $2.10 | 14d | 1 | 1.36mi |
| 824 Ann St Augusta, GA | 2.0 | 1.0 | 768 | $1,795 | $2.34 | 43d | 1 | 1.41mi |
Listing history 26 events
-
2026-06-18days on market $49,400 Active 36 DOM
-
2026-06-17days on market $49,400 Active 35 DOM
-
2026-06-16days on market $49,400 Active 34 DOM
-
2026-06-15price $49,400 Active 33 DOM
-
2026-06-15days on market $49,900 Active 33 DOM
-
2026-06-14days on market $49,900 Active 31 DOM
-
2026-06-10days on market $49,900 Active 28 DOM
-
2026-06-09days on market $49,900 Active 27 DOM
-
2026-06-08days on market $49,900 Active 26 DOM
-
2026-06-07days on market $49,900 Active 25 DOM
-
2026-06-03days on market $49,900 Active 21 DOM
-
2026-05-31days on market $49,900 Active 20 DOM
-
2026-05-30days on market $49,900 Active 19 DOM
-
2026-05-11historical
-
2025-11-04$49,900 Active
-
2025-11-04$49,900 Active 253-char remark
-
2025-10-29historical
-
2025-10-29historical
-
2025-07-06$49,500
-
2025-07-06$49,500
-
2025-01-07historical
-
2025-01-07historical
-
2024-07-30$49,900
-
2024-07-30$49,900
-
2023-08-11soldstatus $4,166,000
-
2016-01-15soldstatus $3,280,000
ⓘ Source: listings_history table (triggers on properties + properties_extension) + one-shot
backfill from property_details.listing_events for pre-trigger history.
Tax reassessment forecast GA · Resets to sale price
- Current annual tax
- $972 · $81/mo
- Projected year-2 tax
- $972 · $81/mo
- Expected delta
- $0/yr ($0/mo · 0.0%)
ⓘ Screening estimate from a state-policy table — verify with the county assessor before closing.
Climate risk First Street
- Flood 1/10 Low FEMA zone X (unshaded) · 0% chance over 30 yrs
- Wildfire 1/10 Low
- Heat 8/10 Severe 7 d/yr ≥108°F today · 17 d/yr by 30 yrs out
- Wind 6/10 Major 64% chance of damaging wind over 30 yrs
- Air quality 4/10 Moderate 4 unhealthy d/yr today · 4 by 30 yrs out
Nearby sold comps map
Loading sold comps map…
Walkable amenities ~0.75 mi
Loading nearby amenities…
Taxation est. · year 1
- Rental income
- $13,288
- − Mortgage interest
- −$2,767
- − Property taxes
- −$972
- − Insurance
- −$247
- − Repairs & maintenance
- −$1,063
- − Management
- −$1,063
- − Depreciation
- −$1,437
- Taxable income
- $5,739
- Est. tax owed @ 24.0%
- −$1,377
- After-tax cash flow
- $4,793/yr
For passive investors: Depreciation is non-cash, so a rental often shows a tax loss while cash-flowing — sheltering income. Rental losses are passive: they offset passive income freely, and up to $25,000/yr can offset ordinary (W-2) income if you actively participate and your MAGI is under $100k (phasing out to $0 by $150k); unused losses carry forward. On sale, claimed depreciation is recaptured at up to 25%, and gains may owe capital-gains tax (a 1031 exchange can defer both). Figures are a year-1 estimate at your 24.0% rate — not tax advice; consult a CPA.
Schools (NCES district)
- District
- Richmond County
- NCES district ID
- 1304380
- Math proficiency
- 12% ▼ -9.00%
- Reading proficiency
- 20% ▼ -6.00%
- Median HH income
- $38,069
- Composite
- 13.43/100
- National rank
- #9524
- State rank
- #154 of 174 in GA
Livability — Augusta-Richmond County consolidated government (balance)
No livability data for this city. (Only ~50 U.S. cities are tracked.)
Census & demographics
- Census place
- Augusta-Richmond County consolidated government (balance), GA
- County
- Richmond County · 190,917 people
- City population
- 154,035
- Metro
- Augusta-Richmond County, GA-SC
- Population (ZIP)
- 23,400
- Household income
- $46,696
- Rent vs Own
- Severe rent burden
- 1594.0
Population outlook (Richmond County) Hauer SSP2
- Today (2025)
- 200,753 people
- By 2030
- 200,232 · -0.3%
- By 2040
- 196,813 · -2.0%
- By 2050
- 190,347 · -5.2%
- By 2075
- 172,496 · -14.1%
- By 2100
- 146,284 · -27.1%
Race, ethnicity, and origin ACS 2023
- Neighborhood character
- Diverse neighborhood (Simpson 0.61)
- Race & ethnicity
- Black 47% White 41% Hispanic / Latino 6% Two or more races 6% Asian 2%
- Hispanic origin (detail)
- Mexican 1%
- Common ancestry
- Italian 1% Slovak 1% Romanian 1%
- Foreign-born
- 3% · Canada, South Korea, Jamaica
- Languages at home
- 93% English-only · Spanish 4% Korean 1%
Political lean MEDSL · Richmond
- 2024 margin
- Solid D (+36.1) · D 67.8% · R 31.7%
- 2008→2024 swing
- +4.3pp toward D · 2008: 31.8pp · 2024: 36.1pp
- All cycles
- 2024: D+36.1 2020: D+37.2 2016: D+32.4 2012: D+33.8 2008: D+31.8
Not yet ingested
- Civics
- —
Market trends
- HPI YoY
- ▼ -211.97%
- Current HPI
- 199.0807
- Rent YoY
- ▲ 4.29%
- Metro
- Augusta-Richmond County, GA-SC
- State GDP YoY
- ▲ 2.66%
- F500 in state
- 28
Industry mix (Fortune 500 HQ in GA)
| Industry | F500 HQs | Revenue |
|---|---|---|
| Paper / Packaging | 2 | $29B |
|
||
| Retail | 1 | $160B |
|
||
| Transportation / Logistics | 1 | $91B |
|
||
| Airlines | 1 | $62B |
|
||
| Consumer Goods | 1 | $47B |
|
||
| Utilities | 1 | $25B |
|
||
Price history
-98.5% since first listed16 events — show timeline
- 2026-06-15 Price Changed $49,400 Hive MLS
- 2026-06-02 Relisted — Hive MLS
- 2026-05-31 Listing Removed — Hive MLS
- 2026-05-11 Listing Removed — Hive MLS
- 2025-11-04 Listed $49,900 Hive MLS
- 2025-11-04 Listed $49,900 Hive MLS
- 2025-10-29 Listing Removed — Hive MLS
- 2025-10-29 Listing Removed — Hive MLS
- 2025-07-06 Listed $49,500 Hive MLS
- 2025-07-06 Listed $49,500 Hive MLS
- 2025-01-07 Listing Removed — Hive MLS
- 2025-01-07 Listing Removed — Hive MLS
- 2024-07-30 Listed $49,900 Hive MLS
- 2024-07-30 Listed $49,900 Hive MLS
- 2023-08-11 Sold (Public Records) $4,166,000 Public Records
- 2016-01-15 Sold (Public Records) $3,280,000 Public Records
Property tax history
+4.2%/yrLatest (2025): $972 · +20.3% YoY. Source: county tax records.
Cash-flow waterfall
monthlySold comps — $/sqft
last 12 mo · ≤1 miLoading sold comps…