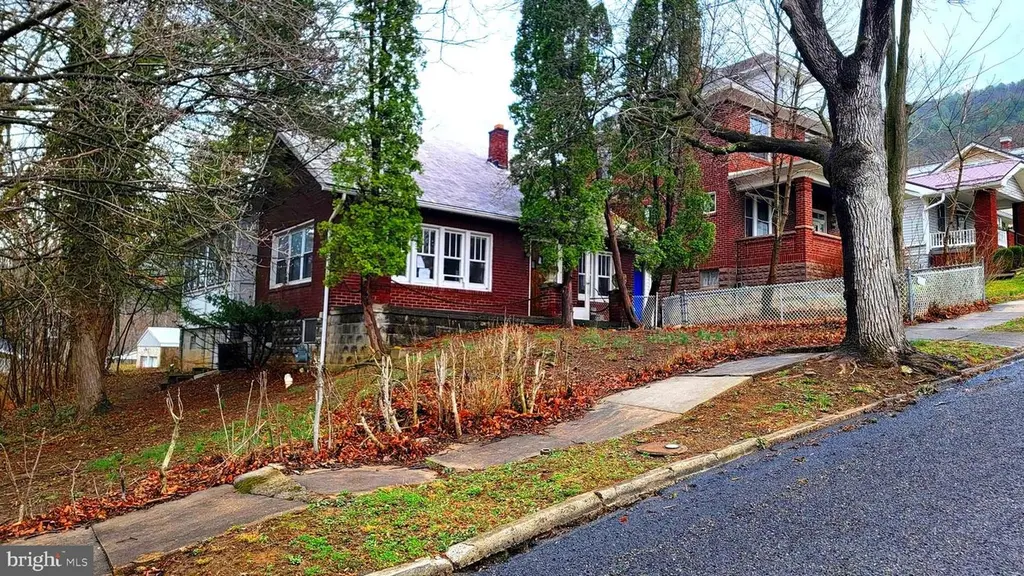
8 Buchanan Ave · La Vale, MD
Flood risk 1/10 · Minimal
- FEMA flood zone
- X (unshaded)
- Chance of flooding over 30 yrs
- 0.0%
- Est. flood insurance / yr
- $473 – $860
Fire risk 2/10 · Minimal
- Est. fire insurance / yr
- $755 – $1,403
Heat risk 4/10 · Minor
- Hot days now (above 102°F)
- 7 days/yr
- Hot days in 30 yrs
- 18 days/yr
Wind risk 2/10 · Minimal
- Chance of severe wind over 30 yrs
- —
Air-quality risk 2/10 · Minimal
- Unhealthy air days now
- 0 days/yr
- Unhealthy air days in 30 yrs
- 1 days/yr
Risk factors via First Street. Map © Google.
Why this score? — see what drove the B+ grade
The composite is a weighted blend of 9 inputs, each scored 0–100. Each bar is that input's sub-score; the figure is the points it added to the 100-point composite (weight × sub-score).
- Cash flow +30.0/30.0
- ARV discount +15.0/15.0
- DSCR +10.0/10.0
- 1% rule +8.6/10.0
- Rent growth +5.0/5.0
- Livability +3.9/5.0
- Condition / age +2.5/5.0
- Schools +1.9/10.0
- Appreciation +0.0/10.0
$99,900
🖨 Deal sheet (PDF) 📄 Offer letter ✓ Due diligence
Listing remarks MLS
3 BEDROOM 2 FULL BATH BRICK HOME IN LAVALE WITH OFF STREET PARKING. FEATURING A TRADITIONAL FLOORPLAN WITH EXTRA SPACE FOR EXPANSION IN BASEMENT. TERRIFIC LOCATION! TONS OF POTENTIAL. NICE YARD WITH DRIVEWAY. FRONT PORCH AND SUNROOM. QUIET AREA.
Key facts
- Off street parking
- Terrific location
- Tons of potential
Tags
Neighborhood map
What this means for you Summary
Snapshot
- This is a 3-bed/1.5-bath single-family listed at $100k.
Deal economics
- At list price, monthly cash flow is $384 ($5k/yr) — positive.
- The deal already cash-flows at list — no discount required.
- Meets the 1% rule at list price ($1k rent vs $100k).
- Recommended offer: $88k (12.0% below list) — sets the bar for market timing.
Location & tenants
- Location reads 77/100 on livability (#82 in MD, #3,161 nationally) — a middle-class / working-renter tenant base. Strengths: employment A+, cost of living A+, housing A+; Watch: amenities F, commute F.
- Allegany County Public Schools (other): math 15% / reading 30% proficiency, ranked #18 of 24 in MD (top 75%) — low school quality limits family demand, transient renter base, plan for 1-2y turnover.
- Zoned schools: Cash Valley Elementary (math 17% / reading 22%, grade F, #353 of 860 statewide, top 45%, 275 students, 68% FRL); Braddock Middle (math 13% / reading 33%, grade F, #122 of 225 statewide, top 54%, 603 students, 60% FRL); Allegany High (math 42% / reading 62%, grade D+, #100 of 222 statewide, top 47%, 684 students, 54% FRL).
- Market conditions: Rents rising fast (+10.9%/yr); 238 active listings in the ZIP; 24 units permitted in Allegany County in 2024 (0 in 5+ unit buildings).
Forward outlook
- Local home prices are declining (-3.0%/yr); year-one equity from $691 of loan paydown is wiped out by about $3k of value loss. Plan a longer hold.
- Allegany County population projected at -14% by 2050 — secular population decline; favor cash flow + early exit over multi-decade hold.
- At projected returns (-3.0% appreciation + 8.0% rent growth), your $28k cash investment doubles in ~6 years — after that, you're playing with house money.
Negotiation context
- It's been on market 134 days — a 12% lower offer ($88k) is reasonable based on typical stale-listing flexibility.
- 2 sale attempts; this cycle's ask has dropped $40k (29%) from the opening price — seller is motivated, your offer sets the floor, not the list.
- Current owner paid $40k; list at $100k implies a 150% gain — meaningful room to come down on a strong offer.
Risks & watch-outs
- Watch-outs: built in 1937 — expect roof / HVAC / electrical / plumbing capex.
Questions for the listing agent
- It's been on market 134 days. Have you received any prior offers? Is the seller open to a 12% concession, seller financing, or rate buy-down credit?
- Built in 1937 — when were the roof, HVAC, electrical panel, plumbing, and water heater last replaced?
- Why hasn't it sold? Are there any deal-killer items the seller is aware of (foundation, flood, title, zoning, code violations)?
- Is there a deadline driving the sale (1031 exchange, divorce, estate, relocation)? That informs how much negotiation room exists.
- Schools are B-rated — typically a magnet for longer-tenancy family renters. What's the average tenant stay here, and is there a school-zone premium baked into asking?
- What's the average days-on-market for RENTAL listings here right now (not sales)? A rising rental-DOM trend means longer vacancies and softer asking-rent achievability than the comps imply.
- What's the recent tenant-quality profile in this submarket — average credit score on applications, eviction rate, late-payment / NSF rate, and stable-employment percentage? A property-management company in the area should have these aggregated.
- How much new for-sale + rental construction is in the pipeline within 1–3 miles? Heavy new supply typically softens prices + rents 12–24 months out; constrained supply supports both.
Investment metrics
- 1% rule
- 1.36% ✓
- Cap rate
- 10.90%
- Cash-on-cash
- 16.46%
- DSCR
- 1.73
- GRM
- 6.1
CMA / ARV
- ARV (median comp)
- $152,060
- List price
- $99,900
- Delta
- -34.30%
- Verdict
- UNDERPRICED
- Comps
- 20 within 1.0 mi
Show comp detail 8 sales within ~0.75 mi
| Address | Dist | Beds/Ba | Sqft | Sold | Price | $/sf | Match |
|---|---|---|---|---|---|---|---|
| 313 National Hwy | 0.24mi | 2/1.0 (-1) | 1,342 (-5%) | 4mo | $125,000 | $93 | 70 |
| 299 National Hwy | 0.21mi | 3/2.0 | 1,472 (+4%) | 13mo | $50,000 | $34 | 70 |
| 23 Park Ave | 0.07mi | 3/1.5 | 1,540 (+9%) | 24mo | $200,000 | $130 | 62 |
| 11106 Arizona Ave NW | 0.43mi | 4/2.0 (+1) | 1,440 (+2%) | 12mo | $180,000 | $125 | 60 |
| 416 Georges Creek Blvd | 0.45mi | 3/1.0 | 1,248 (-12%) | 5mo | $194,000 | $155 | 53 |
| 523 Maryland St | 0.69mi | 3/2.0 | 1,500 (+6%) | 21mo | $185,000 | $123 | 38 |
| 529 B St | 0.73mi | 2/1.5 (-1) | 1,224 (-13%) | 3mo | $147,500 | $121 | 36 |
| 10706 Cash Valley Rd NW | 0.68mi | 3/2.0 | 1,600 (+13%) | 10mo | $280,000 | $175 | 36 |
Match score weights: distance 35% · size 25% · config 20% · recency 20%. Top-matched comps best support the ARV.
Projected returns pro-forma
-3.0% appreciation · 8.0% rent growth · sell at horizon
- IRR
- 13.1%
- Equity multiple
- 1.55×
- Total profit
- $15,427
- Equity at exit
- $14,895
- IRR
- 25.5%
- Equity multiple
- 3.77×
- Total profit
- $77,580
- Equity at exit
- $8,638
Cash invested: $27,972 (down + closing). Projections, not guarantees.
Landlord ↔ Tenant lean methodology
- Overall (STATE)
- 27 Tenant-Leaning
- State Maryland
- 27 Tenant-Leaning · D+14
- County
- — inherits STATE
- City
- — inherits STATE
ZIP-level market 21502
- Home prices YoY
- -17.4%
- Rents YoY
- 10.9%
- Active inventory
- 238
- Price-to-rent
- 6.1×
Monthly cashflow live
- Estimated rent
- $1,356 medium interval (Pro) →
- Mortgage (P&I)
- −$524
- Tax from tax record
- −$122 /mo · $1,463/yr
- Insurance
- −$42
- HOA
- −$0
- Vacancy / Maint / Mgmt
- −$285
- Net cashflow
- $384
Break-even live
Sensitivity live
| Price | -10% $440 | -5% $412 | +0% $384 | +5% $355 | +10% $327 |
|---|---|---|---|---|---|
| Rent | -10% $276 | -5% $330 | +0% $384 | +5% $437 | +10% $491 |
| Rate | -1.0pp $434 | -0.5pp $409 | base $384 | +0.5pp $358 | +1.0pp $331 |
UW: 25.0% down · 7.5% · 30yr · 1.5% tax · 5.0% vac · 8.0% maint · 8.0% mgmt
Financing live
Cash to close
- Down payment
- $24,975
- Closing costs
- $2,997
- Reserves months
- —
- Total cash needed
- —
Loan-product check · same deal, 3 products live
Conventional
25% down · 7.5% · 30yr
- Down + closing
- —
- Monthly P&I
- —
- Monthly cashflow
- —
- DSCR
- —
- Eligible?
- —
Personal DTI + credit; lowest rate.
DSCR
20% down · 8.5% · 30yr
- Down + closing
- —
- Monthly P&I
- —
- Monthly cashflow
- —
- DSCR
- —
- Eligible?
- —
No personal income docs; deal must DSCR.
Hard money
10% down · 12.0% · 12mo
- Down + closing
- —
- Monthly P&I
- —
- Monthly cashflow
- —
- DSCR
- —
- Eligible?
- —
Short-term bridge; refi at stabilization.
Listing history 22 events
-
2026-06-21days on market $99,900 Active 134 DOM
-
2026-06-19days on market $99,900 Active 132 DOM
-
2026-06-18days on market $99,900 Active 131 DOM
-
2026-06-17days on market $99,900 Active 130 DOM
-
2026-06-16days on market $99,900 Active 129 DOM
-
2026-06-15days on market $99,900 Active 128 DOM
-
2026-06-14days on market $99,900 Active 126 DOM
-
2026-06-12days on market $99,900 Active 125 DOM
-
2026-06-09days on market $99,900 Active 122 DOM
-
2026-06-08days on market $99,900 Active 121 DOM
-
2026-06-07days on market $99,900 Active 120 DOM
-
2026-06-02days on market $99,900 Active 115 DOM
-
2026-06-01pricedays on market $99,900 Active 114 DOM
-
2026-05-31days on market $109,900 Active 113 DOM
-
2026-05-30days on market $109,900 Active 112 DOM
-
2026-05-11status Active 246-char remark
Show marketing remark (246 chars)
3 BEDROOM 2 FULL BATH BRICK HOME IN LAVALE WITH OFF STREET PARKING. FEATURING A TRADITIONAL FLOORPLAN WITH EXTRA SPACE FOR EXPANSION IN BASEMENT. TERRIFIC LOCATION! TONS OF POTENTIAL. NICE YARD WITH DRIVEWAY. FRONT PORCH AND SUNROOM. QUIET AREA.
-
2026-05-08historical 246-char remark
Show marketing remark (246 chars)
3 BEDROOM 2 FULL BATH BRICK HOME IN LAVALE WITH OFF STREET PARKING. FEATURING A TRADITIONAL FLOORPLAN WITH EXTRA SPACE FOR EXPANSION IN BASEMENT. TERRIFIC LOCATION! TONS OF POTENTIAL. NICE YARD WITH DRIVEWAY. FRONT PORCH AND SUNROOM. QUIET AREA.
-
2026-04-29price $109,900 246-char remark
Show marketing remark (246 chars)
3 BEDROOM 2 FULL BATH BRICK HOME IN LAVALE WITH OFF STREET PARKING. FEATURING A TRADITIONAL FLOORPLAN WITH EXTRA SPACE FOR EXPANSION IN BASEMENT. TERRIFIC LOCATION! TONS OF POTENTIAL. NICE YARD WITH DRIVEWAY. FRONT PORCH AND SUNROOM. QUIET AREA.
-
2026-03-14price $119,900 246-char remark
Show marketing remark (246 chars)
3 BEDROOM 2 FULL BATH BRICK HOME IN LAVALE WITH OFF STREET PARKING. FEATURING A TRADITIONAL FLOORPLAN WITH EXTRA SPACE FOR EXPANSION IN BASEMENT. TERRIFIC LOCATION! TONS OF POTENTIAL. NICE YARD WITH DRIVEWAY. FRONT PORCH AND SUNROOM. QUIET AREA.
-
2026-02-18price $129,900 246-char remark
Show marketing remark (246 chars)
3 BEDROOM 2 FULL BATH BRICK HOME IN LAVALE WITH OFF STREET PARKING. FEATURING A TRADITIONAL FLOORPLAN WITH EXTRA SPACE FOR EXPANSION IN BASEMENT. TERRIFIC LOCATION! TONS OF POTENTIAL. NICE YARD WITH DRIVEWAY. FRONT PORCH AND SUNROOM. QUIET AREA.
-
2026-02-04$139,900 Active 246-char remark
Show marketing remark (246 chars)
3 BEDROOM 2 FULL BATH BRICK HOME IN LAVALE WITH OFF STREET PARKING. FEATURING A TRADITIONAL FLOORPLAN WITH EXTRA SPACE FOR EXPANSION IN BASEMENT. TERRIFIC LOCATION! TONS OF POTENTIAL. NICE YARD WITH DRIVEWAY. FRONT PORCH AND SUNROOM. QUIET AREA.
-
1987-12-01soldstatus $39,900
ⓘ Source: listings_history table (triggers on properties + properties_extension) + one-shot
backfill from property_details.listing_events for pre-trigger history.
Tax reassessment forecast MD · Partial reset (capped growth)
- Current annual tax
- $1,463 · $122/mo
- Projected year-2 tax
- $1,463 · $122/mo
- Expected delta
- $0/yr ($0/mo · 0.0%)
ⓘ Screening estimate from a state-policy table — verify with the county assessor before closing.
Climate risk First Street
- Flood 1/10 Low FEMA zone X (unshaded) · 0% chance over 30 yrs
- Wildfire 2/10 Low
- Heat 4/10 Moderate 7 d/yr ≥102°F today · 18 d/yr by 30 yrs out
- Wind 2/10 Low
- Air quality 2/10 Low 0 unhealthy d/yr today · 1 by 30 yrs out
Nearby sold comps map
Loading sold comps map…
Walkable amenities ~0.75 mi
Loading nearby amenities…
Taxation est. · year 1
- Rental income
- $16,269
- − Mortgage interest
- −$5,596
- − Property taxes
- −$1,463
- − Insurance
- −$500
- − Repairs & maintenance
- −$1,302
- − Management
- −$1,302
- − Depreciation
- −$2,906
- Taxable income
- $3,201
- Est. tax owed @ 24.0%
- −$768
- After-tax cash flow
- $3,835/yr
For passive investors: Depreciation is non-cash, so a rental often shows a tax loss while cash-flowing — sheltering income. Rental losses are passive: they offset passive income freely, and up to $25,000/yr can offset ordinary (W-2) income if you actively participate and your MAGI is under $100k (phasing out to $0 by $150k); unused losses carry forward. On sale, claimed depreciation is recaptured at up to 25%, and gains may owe capital-gains tax (a 1031 exchange can defer both). Figures are a year-1 estimate at your 24.0% rate — not tax advice; consult a CPA.
Schools (NCES district)
- District
- Allegany County Public Schools
- NCES district ID
- 2400030
- Math proficiency
- 15% ▼ -26.00%
- Reading proficiency
- 30% ▼ -20.00%
- Median HH income
- $39,760
- Composite
- 18.95/100
- National rank
- #8854
- State rank
- #18 of 24 in MD
Livability — La Vale
- Score
- 77/100
- State rank
- #82
- US rank
- #3161
Category grades
Schools grade is shown separately in the Schools card above.
Census & demographics
- Census place
- La Vale, MD
- County
- Allegany County · 41,015 people
- Metro
- Cumberland, MD-WV
- Population (ZIP)
- 41,015
- Household income
- $60,725
- Rent vs Own
- Severe rent burden
- 824.0
Population outlook (Allegany County) Hauer SSP2
- Today (2025)
- 68,778 people
- By 2030
- 66,766 · -2.9%
- By 2040
- 62,784 · -8.7%
- By 2050
- 59,179 · -14.0%
- By 2075
- 50,732 · -26.2%
- By 2100
- 40,837 · -40.6%
Race, ethnicity, and origin ACS 2023
- Neighborhood character
- Predominantly White (83%)
- Race & ethnicity
- White 83% Black 9% Two or more races 5% Hispanic / Latino 2%
- Common ancestry
- Slovak 3% Romanian 2% Italian 1%
- Foreign-born
- 2% · Canada
- Languages at home
- 96% English-only · Spanish 2%
Political lean MEDSL · Allegany
- 2024 margin
- Solid R (+40.3) · D 28.9% · R 69.2% · Other 2.0%
- 2008→2024 swing
- -14.4pp toward R · 2008: -25.9pp · 2024: -40.3pp
- All cycles
- 2024: R+40.3 2020: R+38.3 2016: R+48.0 2012: R+32.9 2008: R+25.9
Not yet ingested
- Civics
- —
Market trends
- HPI YoY
- ▼ -54.33%
- Current HPI
- 258.6676
- Rent YoY
- ▲ 10.88%
- Metro
- Cumberland, MD-WV
- State GDP YoY
- ▲ 2.97%
- F500 in state
- 12
Industry mix (Fortune 500 HQ in MD)
| Industry | F500 HQs | Revenue |
|---|---|---|
| Aerospace / Defense | 1 | $71B |
|
||
| Utilities | 1 | $25B |
|
||
| Hotels | 1 | $24B |
|
||
| Consumer Goods | 1 | $7B |
|
||
| Real Estate | 1 | $6B |
|
||
| Chemicals | 1 | $2B |
|
||
Price history
+175.4% since first listed7 events — show timeline
- 2026-05-11 Relisted — BRIGHT MLS
- 2026-05-08 Listing Removed — BRIGHT MLS
- 2026-04-29 Price Changed $109,900 BRIGHT MLS
- 2026-03-14 Price Changed $119,900 BRIGHT MLS
- 2026-02-18 Price Changed $129,900 BRIGHT MLS
- 2026-02-04 Listed $139,900 BRIGHT MLS
- 1987-12-01 Sold (Public Records) $39,900 Public Records
Property tax history
+1.9%/yrLatest (2025): $1,463 · +23.9% YoY. Source: county tax records.
Cash-flow waterfall
monthlySold comps — $/sqft
last 12 mo · ≤1 miLoading sold comps…